CRO Glossary
Net Promoter Score (NPS)
Are we winning, or losing with our clients?
If upper management came and asked you this question, would you be able to give a definite yes or no? Would you know where to start?
If not, keep on reading because, inside this article, you’ll discover the metric created distinctly to measure customer happiness: the Net Promoter Score (NPS).
Created in 2003 by Fred Reichheld, the NPS is the one number you need to grow.
Fast forward to today, when the NPS is measured and acted upon by 2/3 of companies in the Fortune 1000. Coincidence?
No. Data shows that companies using the NPS ( = companies focused on customer loyalty) make higher profits.
Not only this, but they also pay their employees more, keep employees longer, and reward investors better.
There’s a perfectly logical explanation for this: if customer loyalty is your benchmark, then customer happiness is the result.
Happier customers mean lower churn and more recommendations.
This, in turn, translates into higher revenue and lower costs, meaning the company can afford better salaries and more ROI for the investors.
And NPS is in the middle of this – since it’s the customer loyalty and satisfaction measurement, right from your customers’ mouths.
Let’s look at the NPS and why it plays such an essential role in eCommerce.
The Net Promoter Score – Definition
“What is NPS?”, you might ask.
The Net Promoter Score refers to the number of customers willing to recommend a product or a service to their peers.
The NPS is a crucial metric for your eCommerce business since it reveals essential factors:
- how pleasurable the shopping experience is
- how straightforward the delivery process is
- whether or not you deliver on the promise you made pre-purchase
How to Do/ Create an NPS Survey
Which Questions Should I Ask?
NPS questions change depending on each eCommerce business. Your model, product assortment, or intent may vary.
The more detailed your analysis needs to be, the more complex the survey.
However, the standard grading for NPS surveys is from 0 to 10. Ten is the highest, while 0 is the lowest.
The crucial question you want to ask at this point to accomplish the survey’s purpose is:
“How likely is it that you recommend [business] to a friend?”.

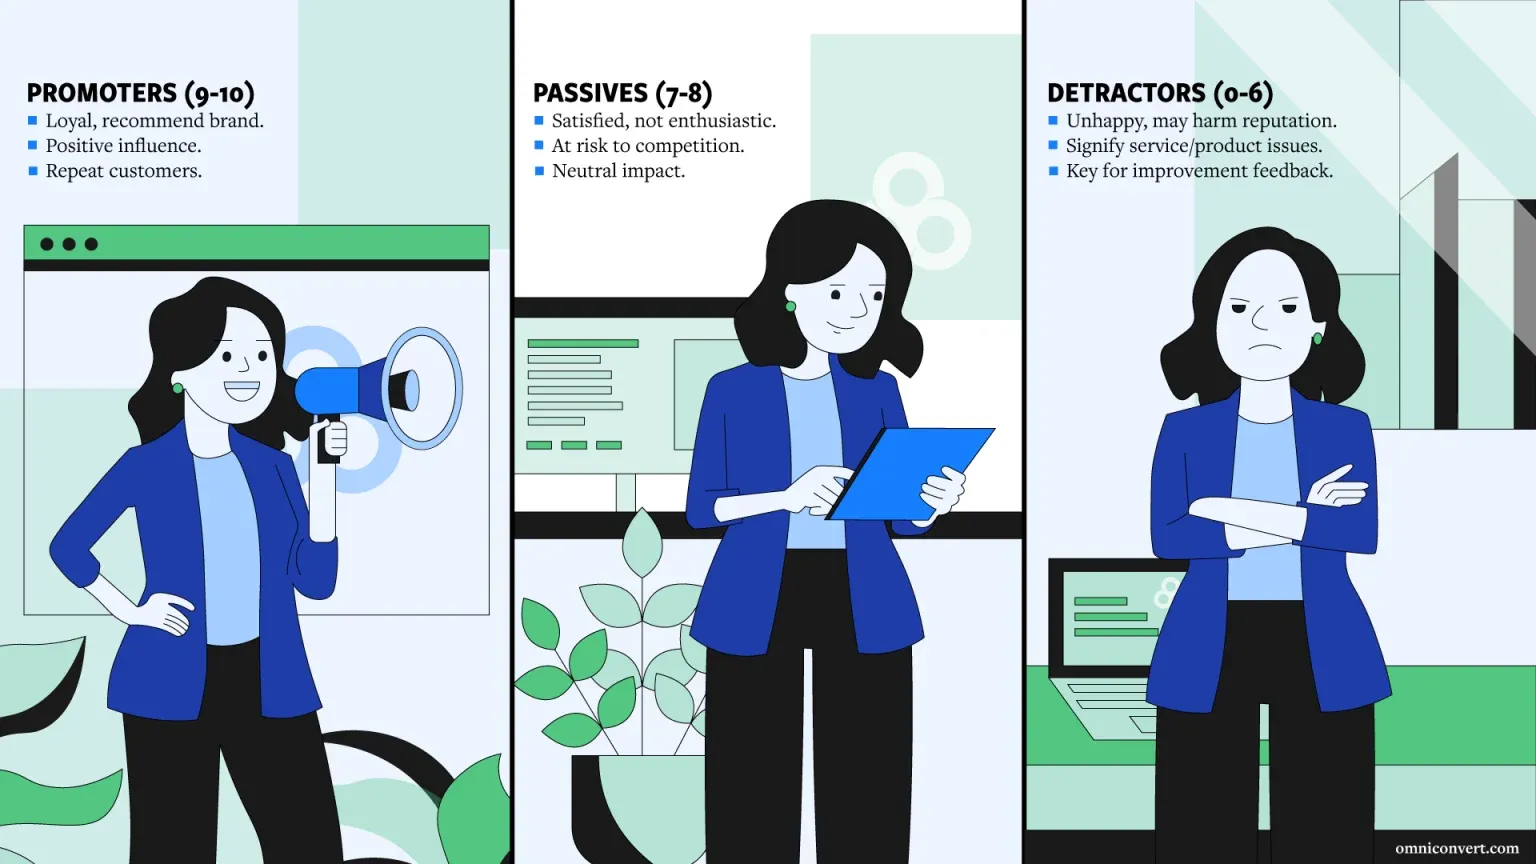
Customers grade their satisfaction on a scale of 0 to 10; then they’re sorted into three categories:
Promoters – gave a score of 9-10.
These are the people you’ve hit the right spot with.
They will not only come back for purchase and become loyal customers but also promote the business in their circle of friends.
Neutrals – gave a score of 7-8.
These people liked your service but not to the extent that they would advocate it or come back for a second purchase.
Detractors – gave a score of 0-6.
This final segment consists of people who were displeased with their experiences. The shopping experience was tiresome, the website was difficult to navigate, or the products were below expectations.
If you’re not careful, this segment can negatively influence other people and ruin your online reputation, making the acquisition process even more difficult.
Ideally, you would want to go further and analyze the reasons behind the grading. Simply looking at the first data from the scaling question will help with quantitative research.
However, you can go the extra mile and gather even more complex NPS data.
Quantitative research helps you get a bird-eye view of how well you can meet customer needs and expectations. However, it can’t pinpoint exactly where you went wrong (if you did).
Thus being said, after the initial question, you should follow up with open-ended questions that allow you to grasp customer expectations further:
For detractors: “Can you elaborate on what we did wrong?”
For passives: “Is there anything we could do to provide a more fulfilling shopping experience?”
For promoters: “We’re glad you’re happy with our collaboration. What is it you liked most in your shopping experience?”
Word of advice: be adaptive.
The NPS is all about listening to the voice of the customer. Your customers are only humans – flawed and unique.
So you shouldn’t base your net promoter score surveys on templates. Adapt classic NPS questions to fit your business and customer base. Make the questions as specific as you need them, as informal as possible, and as straightforward as possible.
When Should I Send the NPS Survey?
There are two crucial instants when you can measure the NPS – before and after delivery.

While many eComm businesses will measure the NPS pre-delivery, few will also measure post-delivery.
This is a pity, considering post-delivery NPS closes the loop, and NPS results show you whether or not you managed to deliver on the experience you promised.
Pre-delivery NPS reveals how easy the shopping experience is, how intuitive the website is, and how easy it is to find the products.
It can also show you the sentiment of your shoppers. Whether they’re excited to get the product or afraid they might receive a product below their expectations.
With pre-delivery, you’ll identify friction points on the website or the need to include more social proof, or maybe you’ll get ideas for a more intuitive shopping experience.
However, with post-delivery NPS, you can quickly see if you managed to play by the under-promise / over-deliver rule and truly delight your customers.
Measuring your net promoter score post-delivery highlights unhappy customers (who will most likely churn) and fix their problems in real-time.

How to Calculate the NPS
NPS represents the difference between the percentage of Promoters and the percentage of Detractors.
The NPS formula is:
NPS = %Promoters – %Detractors

For example, suppose your NPS results look like this:
20% Detractors.
40% Passives.
40% Promoters.
To calculate your NPS, you would subtract 20 (detractors) from 40 (promoters) and get an NPS score of 20. You can do this manually (but why would you?), or using a Net Promoter Score calculator.
If you’re looking for an NPS Calculator, check out Omniconvert Reveal! The first platform built for CLV, Reveal, offers you priceless insights about your customer base. Its latest update lets you get real-time NPS alerts from detractors, so you can treat problems in real-time and prevent churn.
Why Is the NPS Important?
There’s a lot of talk (including from our side) about the rising costs in the acquisition and how focusing on customer loyalty and increasing retention rates unlocks accelerated growth.
Yet, maybe your problem isn’t necessarily the acquisition of new clients right now.
You believe your Ads are working reasonably well. New clients are rolling in each month; the numbers look good enough.
Your situation is not great, not terrible.

However, what you do after you close the sale matters just as much as promoting your products and getting people to buy them.
Customer experience management plays a big part in your company’s margin.
So, back to basics – are you asking yourself the essential questions post-acquisition?
Are your customers happy with the product? Did they enjoy the delivery process? Did you deliver on your promise?
The secret to becoming more successful and extracting more value from your existing customers hides in the answers.
And here’s the catch – most businesses aren’t asking these questions as they don’t calculate NPS.
They go on their gut feelings, ignore customer feedback – then wonder WHY almost no one comes back for a second purchase.
If customers “seem” happy but don’t return for a 2nd purchase, net promoter score surveys are the key to unlocking the retention rates.
So, if you really think about it, NPS is the mirror customers hold in front of you, allowing you to see where you need to improve and where you’re doing great.
Or, if you want to leave the metaphors aside – NPS is how you measure customer loyalty and gives you access to predictive data.
Even if we talk about first-time buyers, NPS results should bring out customers with high potential and help you prioritize retaining them (in turn increasing the ROI of the initial purchase).
What’s even more important (maybe) – NPS surveys combined with an NPS software can also help you identify customers at risk of churning and even reduce customer churn. Customers with low scores (detractors) aren’t prone to return for a second purchase.
If you identify WHY they were unhappy with the experience in the first place (product quality, shipment problems, unhelpful CX teams), you can address the problem and make it up to the customer.
While it’s not 100% certain, solving their problem (or at least showing you care, making them feel heard) can definitely help in keeping your customers from churning.
And you can do better next time since you are already aware of the issue and can do what it takes to solve it.
Speaking of fixing the issues – even if you have a majority of Detractors in your surveys, your net promoter system can still be a blessing in disguise.
Since it’s feedback coming right from the horse’s mouth (people who actually need & use your products), you can use this feedback as a guide for product or service improvement.
It is even better if you follow the classic “rate us from 0-10” question with an open-ended question, where customers can explain what you did wrong or pinpoint what they needed and didn’t deliver. Or highlighted points of friction in the buying process.
(or simply vent – as some will do)
How to Interpret the Net Promoter Score
Since NPS is the only customer experience metric that’s all about the likelihood of your customers recommending you, the higher you score, the more likely you are to grow organically.
A good NPS score is considered anything that’s over 0.
An excellent NPS is over 50.
A bad NPS is below 0.
Let’s start with the worst-case scenario: NPS below 0.
Yes, your NPS can go lower than 0, meaning you have more Detractors than Promoters inside your customer base.
Unfortunately, this proves customer experience wasn’t a priority inside your organization. We already covered the negative impact of Detractors, so if you find yourself in this scenario, your job is to improve your customer satisfaction levels ASAP.
So, get on with the qualitative research and identify why your customers are so unhappy – then start putting out those fires.
The average scenario: NPS between 0-50.
While this score isn’t a cause for alarm, it doesn’t mean your road to customer-centricity is over.
Passives aren’t that beneficial to your brand, seeing how they won’t recommend you and won’t contribute to your organic growth.
People don’t trust brands.
It’s a hard truth to acknowledge, but the quicker we are to accept it, the faster we can take action.
One way of combating this lack of trust has strong brand advocacy behind our customers, and this only happens when we work intentionally to improve customer loyalty.
Get in touch with the Passives and see how and where you need to improve so their score gets higher.
Identify the “why” behind their grading and start working on it.
Suppose you’re uninspired or unsure how to find the “why,” check out this article. You’ll discover 21 nps survey questions to include in your NPS surveys to get accurate feedback and many improvement ideas!
Best-case scenario: NPS above 50.
Wow, you’re doing great!
NPS above 50 means you’re on your way to the eCommerce promised land: a place where referrals and recommendations are flying high, and you don’t need to invest at all in acquisition!
Well…not quite.
That’s never the case since acquisition is still essential. But a marketer can dream, right?
An NPS above 50 proves you prioritize customer satisfaction, so kudos!
You can set up specific email flows and get referrals, reviews, and recommendations from your loyal customers. They help with social proof and treat some of the customers’ objections.
If you want a more accurate score interpretation, we advise you to check out the NPS benchmark for your Industry and compare your results to other competitors in the field.
Wrap-up
When used right, the NPS is an excellent source of growth for your company.
It provides honest feedback, identifies loyal customers, and helps you prevent churn.
However, the NPS can also become just another metric unless you take action. Everyone has ideas, but ideas without execution aren’t worth much.
If you believe you aren’t yet ready to use this metric or want to explore more before including the NPS in your strategy, check out the courses in the CVO Academy.
Global eCommerce leaders share CVO strategies and priceless insights about growing a business in a hyper-competitive landscape.
Good luck!
FAQs
What Is NPS and How Does It Work?
NPS stands for Net Promoter Score. It’s a metric revealing your customers’ sentiment regarding your brand. The NPS also reveals the number of customers willing to recommend you to their peers. To find your NPS, you need to send a survey pre-purchase u0026 one post-purchase, and ask customers to rate their willingness to recommend on a scale of 1 to 10.
What NPS Means?
NPS stands for Net Promoter Score. It’s a metric revealing the number of customers willing to recommend you to their peers.
How Are NPS Calculated?
The NPS formula is the difference between the percentage of Promoters (answered 9-10 in the survey) and the percentage of Detractors (1-6 in the survey).
What Is a Good NPS Score?
The higher you score, the more likely you are to grow organically through customer recommendations. A good NPS score is considered anything that’s over 0. An excellent NPS is over 50. A bad NPS is below 0.
Theory is nice, data is better.
Don't just read about A/B testing, try it. Omniconvert Explore offers free A/B tests for 50,000 website visitors giving you a risk-free way to experiment with real traffic.


