Financial Performance Dashboard for eCommerce: 7 Benefits

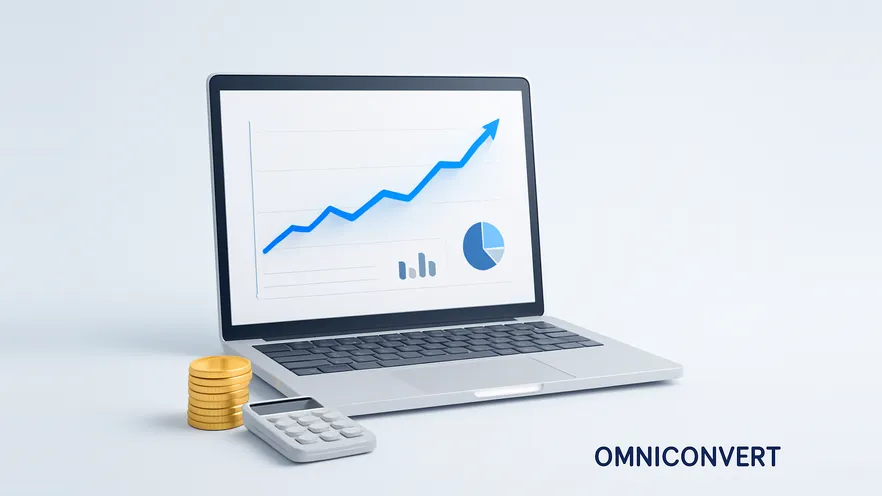
- A financial performance dashboard puts the core eCommerce KPIs from every data source on one screen, so decisions no longer start with a scavenger hunt through separate tools.
- The seven benefits are a full view of the KPIs, time saved, visible sales, better profitability control, a motivated team, less report building, and faster decisions.
- Track profit for the company as a whole and for individual product lines or SKUs, and review the dashboard at least weekly.
- The three common mistakes are building the dashboard by hand in spreadsheets, cramming in every chart before setting goals, and putting design before data.
- A dashboard that reports by product shows what sold; customer-level metrics such as RFM segments and customer lifetime value show who is profitable to keep.
If you are like many eCommerce entrepreneurs, your business's financial data is spread across a number of places, from Shopify and Amazon Seller Central to your cloud accounting software and various spreadsheets.
This means that every time you want to consult the data before making a decision, you are going on a scavenger hunt. This is not only time-consuming, it is also a recipe for not having confidence in your numbers.
A better solution is to use a financial performance dashboard: one screen that pulls the numbers from every source and shows the KPIs that drive your bottom line. It has seven benefits, from a bird's eye view of your business to faster decisions. In this post, we examine all seven, the metrics worth putting on the dashboard, and the three most common dashboard mistakes.
What is a financial performance dashboard?
A financial eCommerce dashboard gives you deeper insight and clarity around the core KPIs in your business. You and your team can see how different initiatives contribute after a few minutes of looking at the dashboard, instead of spending hours building custom reports in Excel Hell.
Let's use average order value as an example. As the owner, you might want to know that you are not leaving money on the table with each order. Your marketing team will want to know if the new bundle deal they launched is leading to larger checkout orders. And your CFO or controller might want to see how this new bundle deal affects not only average order value but gross margin.
Three people, three questions, one dashboard. That is the whole idea.
What are the top 7 benefits of using a financial dashboard?
1. Get a bird's eye view of all key performance indicators
This is the biggest advantage of using dashboards over spreadsheets and custom reports. All of your most important metrics sit at the top of your dashboard, front and center. You see how the business is doing as a whole before you drill into any one number.
Why it matters: a single metric viewed alone can mislead. Revenue up and margin down is a very different week from revenue up and margin up, and only a view of both at once shows the difference.
2. Save time
One of the biggest time sucks is having to go to multiple sources, be it Shopify, Amazon Seller Central, Google Analytics or Xero, just to get the individual pieces of data you need to make a decision.
For example, if you want to know if sales increased in Q2, you might need to pull revenue numbers from Shopify, Amazon, wholesale orders and so on.
Instead, you can sync all of your data feeds directly to your eCommerce dashboard. It pulls the information in automatically, so all of the important data is in one place and up to date.
3. Monitor sales numbers
Another advantage is that you never have to guess what your sales numbers are. Many eCommerce business owners make a habit of checking their sales dashboard to start each work day.
This allows them to work "on" the business instead of "in" it, while still staying close to the numbers.
You don't necessarily have to check your financial dashboard daily, but it is a great idea to check it at least weekly.
4. Increase profitability
In addition to sales numbers, we recommend tracking profit in a dashboard, both for your company as a whole and for individual product lines or SKUs.
When you look at it on a regular basis, you can see if you are on track. You can make adjustments faster if you see that you are veering away from your target profitability range. A best-selling SKU with a thin margin, or a promotion that lifts revenue while it erodes gross profit, shows up in weeks rather than at the end of the financial year.
5. Keep your team motivated and accountable
We recommend making at least one of your financial performance dashboards accessible to your team.
You can decide how much you want to share, but there are many advantages to sharing at least some of it:
- When they see the dashboard, they can see how the work they are doing directly contributes to the bottom line.
- They will feel more motivated to do great work and may even feel a sense of ownership in the company.
- They will be more likely to suggest new ideas that could further improve the bottom line.
- They always have an idea of where they stand. They can see if they are crushing it, or if their manager might soon reach out to have a talk about their performance.
6. Reduce the time spent putting together detailed reports
Do you know what's worse than reading a 30-page financial report? Having to spend the time creating the 30-page report instead of, you know, focusing on growing the business.
Dashboards solve this problem. You spend the time mapping out your dashboard and deciding which metrics you want to track upfront, and then you don't have to do it again unless you change a metric.
7. Eliminate analysis paralysis
As a founder, you make a lot of decisions every day. Decision fatigue is real, and anything you can do to eliminate or simplify a decision goes a long way. A dashboard helps you make faster decisions because you have all of the important eCommerce KPIs in one place, and they are up to date.
Why it matters: when the numbers are already on the screen, the discussion moves from "what are the numbers?" to "what do we do about them?", which is the only discussion that grows the business.
Which metrics belong on an ecommerce financial dashboard?
The right list depends on your business model, but most eCommerce stores start from the same core. The table shows what each metric tells you and how to read it.
| Metric | What it tells you | How to read it |
|---|---|---|
| Revenue by channel | Where sales come from: your store, Amazon, wholesale | Watch the mix, not only the total. A growing channel with lower margins can hide a shrinking profitable one |
| Gross margin | How much of each sale is left after the cost of goods | Track it for the company and per product line or SKU; a falling margin during a promotion is the early warning |
| Average order value | How much a customer spends per order | Read it next to gross margin. A bigger basket built on discounts is not always a better one |
| Customer acquisition cost | What it costs to win a new customer | Compare it with gross profit per order and with customer lifetime value, not with revenue |
| Repeat purchase rate | How many customers come back to buy again | A rising rate lowers the pressure on acquisition spend; a falling one explains rising marketing costs |
| Cash position | How much cash is available after inventory and payables | Profitable on paper and short of cash is common in eCommerce, because inventory is paid for before it sells |
Two of these are simple formulas worth showing on the dashboard itself, so nobody argues about the definition:
- Average order value = revenue ÷ number of orders. A store with $50,000 in monthly revenue from 1,000 orders has an average order value of $50.
- Gross margin = (revenue − cost of goods sold) ÷ revenue × 100. If that same $50,000 in revenue cost $30,000 in goods, gross margin is ($50,000 − $30,000) ÷ $50,000 × 100 = 40%.
For a deeper look at acquisition cost, see our guide on how to optimize customer acquisition cost.
What are 3 common financial dashboard mistakes to avoid?
Now that you are sold on creating an eCommerce financial dashboard, here are the three most common mistakes we see businesses make, and how to avoid each one.
Mistake 1: Building it by hand instead of using dashboard software
Many people try to DIY their first dashboard or two. They grab all of the data and build it in Excel or Google Sheets. That's all fine and good until you have to import the data each week, or something in your custom dashboard breaks. The dashboard that is supposed to save you time on reporting is now creating even more work for you.
This is totally unnecessary, considering how many great free and paid dashboard software options are available. Save yourself the headaches and build your first dashboard using software that connects directly to your store, your marketplaces and your accounting software.
Mistake 2: Building before you know your goals
Another common mistake is getting so excited to build the dashboard that you literally throw the kitchen sink in it. The result is a cluttered mess, with dozens of charts, graphs and tables crammed on the screen.
The dashboard becomes so overwhelming that you need a magnifying glass and a shot of whiskey before you dive in.
Instead, we recommend spending the time upfront to choose the top metrics you care about:
-
Write down the decisions the dashboard must supportFor example: how much to spend on ads next month, which products to reorder, whether a promotion paid off.
-
Pick the few metrics that answer those decisionsUsually five or six from the list above. If a metric does not change a decision, it does not go at the top.
-
Put those metrics front and center, above the foldAnything else you include is a "nice-to-have" and goes below them.
-
Connect the data sourcesStore, marketplaces, accounting software and ad platforms, synced automatically rather than imported by hand.
-
Review it on a fixed rhythmAt least weekly. Remove any metric nobody has looked at for a month.
Mistake 3: Obsessing over style instead of substance
It is great to spend time on the dashboard design. However, the design should be secondary to the actual data and metrics you are tracking. Any design element you include should make it easier to see what's happening on your dashboard, not distract from it.
How do you move from product profit to customer profit?
Once your financial dashboard is in place, a new question usually follows: which customers are behind the profit? Two stores with the same revenue and the same margin can be in very different positions if one earns most of its profit from loyal repeat buyers and the other from one-off discount shoppers.
That is a customer question, not a product question. RFM segmentation groups customers by how recently they bought, how often and how much they spend, and customer lifetime value shows what each group is worth over time. Omniconvert Commander (formerly Nexus) builds both from your order data, and pushes the segments directly to Meta Ads, Google Ads and Klaviyo, so the spend in your dashboard goes to the customers most worth keeping.
Financial performance dashboard FAQ
It is a single screen that pulls the financial numbers of an online store from every source, such as Shopify, Amazon Seller Central, your accounting software and your ad platforms, and shows the core KPIs that drive the bottom line. Instead of building a custom report each time you need an answer, you and your team read the answer off the dashboard in a few minutes.
There are seven: a bird's eye view of all key performance indicators, time saved on collecting data, constant visibility of sales, better control of profitability, a more motivated and accountable team, far less time spent building detailed reports, and faster decisions with less analysis paralysis.
Start with the few metrics that move profit: revenue by channel, gross margin, average order value, customer acquisition cost, repeat purchase rate and cash position. Put those at the top of the dashboard. Anything else is a nice-to-have and belongs below them.
At least weekly. Many eCommerce owners open their sales dashboard at the start of each work day, which keeps them close to the numbers while they work on the business rather than in it. Daily checks are optional; a weekly review is the minimum that lets you catch a problem before it becomes expensive.
Only as a very first draft. A spreadsheet dashboard needs manual data imports every week and breaks when a formula or a data source changes, so the tool meant to save you time starts to cost you time. Dashboard software that syncs directly with your store, marketplaces and accounting software removes that work, and there are both free and paid options.
We recommend sharing at least one dashboard. You decide how much to show, but when people can see how their work affects the bottom line they tend to feel more ownership, suggest more ideas that improve profit, and always know where they stand.
Three come up again and again: building the dashboard by hand in spreadsheets instead of using dashboard software, adding every chart you can find before deciding what your goals are, and spending more effort on the design than on the data and metrics the dashboard tracks.
Most financial dashboards report by channel, product or SKU, which tells you what sold but not who is profitable to serve. To see revenue, margin and lifetime value by customer segment, connect your order data to a customer analytics platform such as Omniconvert Commander, which groups customers with RFM segmentation and tracks customer lifetime value.
In sum, there are many benefits of setting up a financial dashboard. It goes a long way to help you know your numbers without spending hours and hours on custom reports and spreadsheets. Pick your top metrics first, connect your data sources with dashboard software rather than by hand, keep the design in service of the numbers, and share at least one view with your team. Then make the dashboard part of your week, so that every decision starts from numbers you trust.
See which customers make your profit
Your financial dashboard shows what the store earns. Omniconvert Commander shows who earns it: RFM segmentation, customer lifetime value and churn prediction built on your order data, with segments you can push directly to Meta Ads, Google Ads and Klaviyo.