Cost of Goods Sold (COGS) Formula: 2026 Guide

- The COGS formula is Beginning Inventory + Purchases - Ending Inventory. The extended version adds freight in and subtracts purchase discounts and returns.
- COGS includes direct costs (materials, direct labor, inbound freight) and excludes indirect costs (marketing, rent, admin salaries), which are operating expenses.
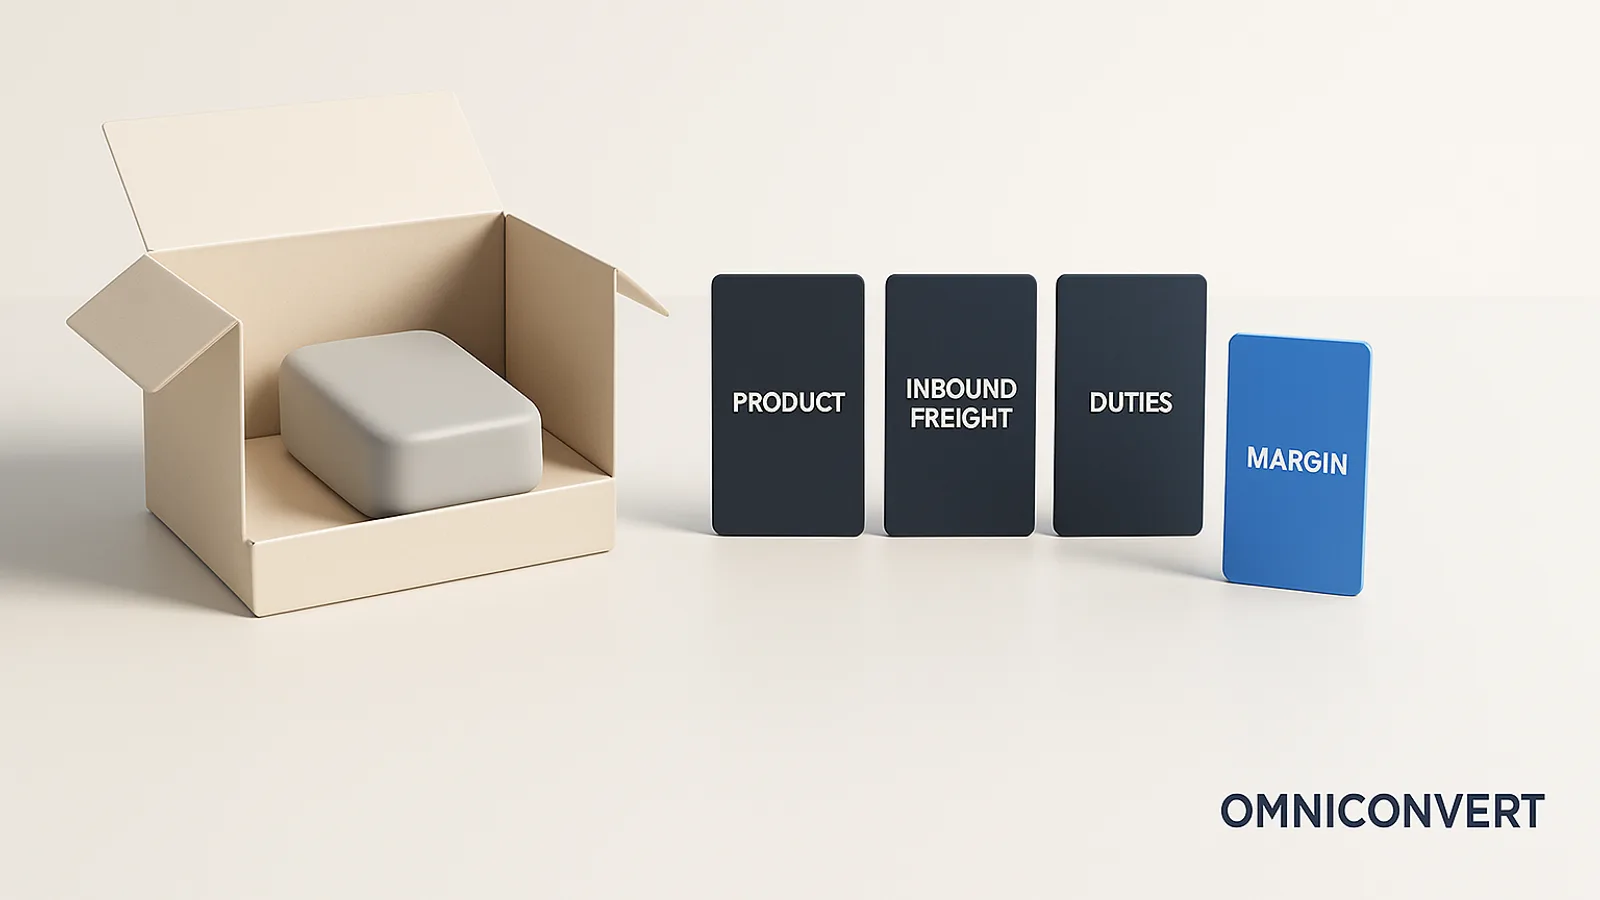
- For eCommerce, use landed cost (unit cost plus inbound freight and duties). Leaving freight and duties out understates COGS and overstates margin.
- Your inventory method (FIFO, LIFO, or average cost) changes the COGS figure and the profit you report. Pick one and apply it consistently.
- COGS only gets you to gross margin. True Profit needs CAC and returns too. Nexus by Omniconvert tracks True Profit per order and per cohort.
Cost of goods sold (COGS) is the direct cost of the products a business actually sold during a period, the materials, direct labor, and inbound freight that went into the units that left the shelf. It is the first thing subtracted from revenue on the income statement, and it sets your gross margin. Omniconvert has analyzed margin and profitability across the CROBenchmark dataset of 7,000+ websites in 15+ industries, drawing on 13 years in eCommerce conversion rate optimization and work with 2,200+ brands including Decathlon and Heineken [CROBenchmark Report 2026, Omniconvert].
Nexus by Omniconvert is the AI eCommerce growth engine that turns profit data, including COGS, landed cost, CAC, and returns, into ranked actions. This guide gives you the COGS formula and worked examples, what to include and exclude, the inventory methods, and the part most generic guides miss: how COGS works specifically for eCommerce, and why gross margin is only the start of the real profit picture.
What is the cost of goods sold (COGS)?
COGS answers a deceptively simple question: what did it actually cost to make or buy the things you sold? It counts only the goods that sold in the period, not everything you bought or produced. Unsold inventory stays on the balance sheet as an asset until it sells, at which point its cost moves into COGS.
Because COGS sits directly below revenue, it is the first lever on profitability. A business with strong revenue and bloated COGS can be less profitable than a smaller competitor with disciplined costs. Getting COGS right is what makes gross margin, pricing, and product decisions trustworthy.
The cost of goods sold formula
Two versions of the formula cover almost every business:
The logic is the same either way. You start with the inventory you had, add what you bought, then remove what is still on the shelf at the end. What is left is what you sold, valued at cost.
How to calculate COGS step by step
-
Value your beginning inventoryTake the cost value of all inventory on hand at the start of the period. This equals the ending inventory from the previous period.
-
Add purchases and inbound freightInclude everything bought to resell or produce goods during the period, plus the inbound freight to receive it. Subtract supplier discounts and returns.
-
Subtract ending inventoryCount and value what is still unsold at the end of the period. Removing it leaves only the cost of what actually sold.
-
Read the result as cost, not profitThe figure is COGS. Subtract it from revenue to get gross profit, then divide gross profit by revenue for gross margin.
A worked example: a store starts the quarter with 20,000 dollars of inventory, buys 9,000 dollars more, and ends with 5,000 dollars unsold.
Want COGS, CAC, and returns rolled into one True Profit number per order and per cohort?
Learn more about Nexus by Omniconvert →What is included and excluded in COGS
| Included in COGS (direct) | Excluded from COGS (operating expense) |
|---|---|
| Raw materials and components | Marketing and advertising |
| Direct production labor | Sales commissions |
| Manufacturing overhead tied to production | Rent and administrative salaries |
| Inbound freight (freight in) | Office supplies and software |
| Import duties and supplier fees | Outbound shipping and most distribution |
Inventory valuation methods (FIFO, LIFO, average cost)
| Method | Assumption | Effect on COGS when prices rise |
|---|---|---|
| FIFO (first in, first out) | Oldest inventory sells first | Lower COGS, higher reported profit |
| LIFO (last in, first out) | Newest inventory sells first | Higher COGS, lower reported profit |
| Average cost | All units valued at the average cost | Smooths price fluctuations |
The method is not just an accounting technicality. In a period of rising supplier prices, FIFO flatters margin while LIFO protects it on paper, and the choice affects taxable profit. Pick one, document it, and keep it consistent so trends are real and not an artifact of the method.
eCommerce COGS and how it differs
This is where most generic COGS guides fall short. For an eCommerce business, the supplier invoice is only part of the real cost of a unit. The accurate figure is landed cost:
Leave freight and duties out and your gross margin looks several points better than it is. The table below shows typical COGS as a share of revenue across common eCommerce categories. Treat it as a directional benchmark and confirm against your own books, because product mix and sourcing move these numbers significantly.
| eCommerce category | Typical COGS (% of revenue) | Typical gross margin |
|---|---|---|
| Health and supplements | 15% to 30% | 70% to 85% |
| Beauty and cosmetics | 20% to 35% | 65% to 80% |
| Apparel and fashion | 30% to 45% | 55% to 70% |
| Food and beverage | 30% to 50% | 50% to 70% |
| Furniture and home | 40% to 55% | 45% to 60% |
| Electronics and gadgets | 60% to 80% | 20% to 40% |
| Digital products | 5% to 20% | 80% to 95% |
The deeper point for eCommerce: COGS gets you to gross margin, but it ignores the two costs that decide whether a sale is actually profitable, customer acquisition cost and returns. A product with a healthy 60 percent gross margin can lose money once a 40 dollar CAC and a 20 percent return rate are counted. That gap between gross margin and the margin you keep is exactly what Customer Lifetime Value and True Profit are built to close.
COGS metrics and ratios
A rising COGS ratio means cost is eating a larger share of every sale, a warning sign for pricing or sourcing. A high inventory turnover means stock sells quickly, freeing cash and reducing the risk of markdowns. Read alongside gross merchandise value, these ratios show whether top-line growth is translating into margin.
COGS vs operating expenses
The distinction is not academic. Because COGS scales with volume and operating expenses are largely fixed, the two behave very differently as you grow. Confusing them hides where the real cost pressure is: a margin problem in COGS calls for sourcing or pricing changes, while a margin problem in operating expenses calls for efficiency. Mixing them together makes both invisible.
Why COGS matters for profit
Getting COGS right pays off in four ways: it sets defensible prices, it keeps tax filings accurate, it surfaces which products to scale or cut, and it is the base layer of every profitability metric above it. But COGS has a clear limit. It tells you the cost of making the sale, not the cost of getting the customer or keeping them.
This is where COGS work should lead. Nexus by Omniconvert combines COGS and landed cost with customer acquisition cost, returns, and Customer Lifetime Value into True Profit, the net margin a business actually keeps. Instead of stopping at gross margin, it shows which products and customer cohorts are genuinely profitable and ranks the actions that protect the most margin, so cost analysis turns into a prioritized plan rather than a spreadsheet.
Frequently Asked Questions
The cost of goods sold formula is Beginning Inventory plus Purchases minus Ending Inventory. The extended version adds freight in and subtracts purchase discounts and returns: COGS = Beginning Inventory + Purchases + Freight In - Ending Inventory - Discounts - Returns. COGS captures the direct cost of the products a business actually sold in a period, which is what you subtract from revenue to get gross profit.
To calculate COGS, take your beginning inventory value, add all inventory purchases and inbound freight during the period, then subtract the ending inventory value. For example, 20,000 dollars beginning inventory plus 9,000 dollars purchases minus 5,000 dollars ending inventory equals 24,000 dollars COGS. Use one inventory valuation method (FIFO, LIFO, or average cost) consistently so the figure stays comparable period over period.
COGS includes the direct costs of producing or buying the goods a business sold: raw materials, direct labor, manufacturing overhead tied to production, and inbound freight to get inventory in. For eCommerce, it means landed cost, the product cost plus inbound shipping and import duties. COGS does not include the cost of unsold inventory, which stays on the balance sheet until it sells.
COGS excludes indirect costs that are not tied to producing a specific unit: marketing and advertising, sales commissions, rent, administrative salaries, office supplies, and most distribution and overhead. These are operating expenses, reported separately on the income statement. Keeping them out of COGS matters because mixing them in distorts gross margin and makes products look less profitable than they are.
A good COGS percentage depends heavily on industry. As a rough guide, many eCommerce categories run a COGS ratio of 30 to 50 percent of revenue, leaving a 50 to 70 percent gross margin, while electronics often run 60 to 80 percent and digital products under 20 percent. The COGS ratio is COGS divided by net sales times 100. Track it as a trend against your own history, not only against an industry average.
COGS is the direct cost of the goods a business actually sold in a period (materials, direct labor, inbound freight). Operating expenses are the indirect costs of running the business (marketing, rent, salaries, software). On the income statement, revenue minus COGS gives gross profit, then operating expenses are subtracted to reach operating profit. The split matters because only COGS scales directly with units sold.
For eCommerce, COGS should reflect the full landed cost of each product, the unit cost plus inbound freight, import duties, and supplier fees, not just the supplier invoice. Many stores understate COGS by leaving out inbound shipping and duties, which overstates gross margin. eCommerce also has to weigh returns and reshipping, which erode realized margin even though they sit outside the textbook COGS formula.
Nexus by Omniconvert is the AI eCommerce growth engine that turns profit data into ranked actions. It unifies COGS, landed cost, customer acquisition cost, returns, and Customer Lifetime Value into True Profit, the net margin a business actually keeps per order and per cohort. Instead of stopping at gross margin, Nexus shows which products and segments are genuinely profitable and ranks the actions that protect the most margin.
Recalculate your COGS using landed cost, the unit cost plus inbound freight and duties, not just the supplier invoice. Most eCommerce stores that do this discover their real gross margin is several points lower than they thought. Then go one step further: subtract customer acquisition cost and returns to see True Profit per product and per customer cohort. That is the number that tells you which products and which customers are actually worth scaling. Gross margin is where COGS analysis starts, not where profit decisions should end.

See True Profit, not just gross margin, with Nexus
Nexus by Omniconvert unifies COGS, landed cost, customer acquisition cost, returns, and Customer Lifetime Value into True Profit, the margin you actually keep per order and per cohort. It then ranks the actions that protect the most margin. Stop optimizing for revenue that does not convert to profit.