Customer Lifetime Value Analysis: Reveal Vs. Excel Example Vs. Analytics
Article last updated:
Article first published:
REVEAL’s customer lifetime value analysis, NPS, RFM and cohort analysis enables you to perform deep dives easily, without wasting hours on aggregating data.
The main difference between using Reveal, Excel examples, and analytics for customer lifetime value analysis lies in the tools' complexity and depth of insights. Reveal provides a comprehensive, AI-driven approach to CLV prediction, Excel allows for customizable but manual calculations, and analytics platforms offer a balance with automated insights based on historical data. Understanding these tools' capabilities can guide businesses in selecting the most appropriate method for their specific CLV analysis needs.
Key Takeaways
- Automates CLV Analysis: Reveal automates customer lifetime value analysis with AI, reducing manual efforts.
- Identifies High-Value Segments: Helps pinpoint high-value customer groups like "Soulmates" for targeted strategies.
- Simplifies Data Processing: Streamlines tasks like cohort analysis, RFM segmentation, and buying pattern recognition.
- Enhances Campaign Opportunities: Insights enable personalized campaigns to convert lower-value segments.
- Integrates Seamlessly: Works effortlessly with Shopify, delivering instant customer insights.
Before we started building REVEAL, our customer lifetime value analysis and optimization tool, we were performing CRO and retention audits for our e-commerce clients using Excel sheets, Google Analytics reports and CRM data.
The analysis of customer segments was overwhelming, as the data sets varied a lot from one e-commerce platform to another. Moreover, we lacked the flexibility to easily extract insights when new attributes were added to the data sets.
We were wasting a lot of hours with tasks such as:
- Segmenting the customer base,
- Constructing models to identify the most profitable cohorts,
- Calculating the retention rate and customer lifetime value.
These tedious tasks made us kick off the development of a customer intelligence platform that does all the work on autopilot. Reveal incorporates RFM segmentation, lifetime value, customer acquisition cost, NPS analysis, cohort analysis and buying patterns.
Below we’ll give you an overview of how REVEAL’s LTV analysis works. Then, we’ll look at an Excel formula, to see how much easier is it to analyse the data with our tool.
Finally, we’ll look at the options available in Google Analytics for customer lifetime value calculation.
Customer Lifetime Value Analysis In Reveal: How To Spot Growth Opportunities
The customer lifetime value report is generated automatically once you integrate REVEAL into your webshop. You can find it under the Lifetime Value tab.
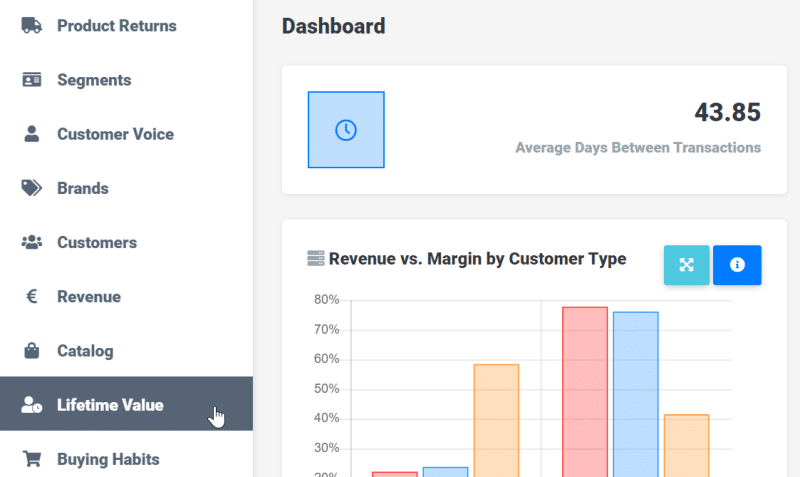
The Ltv Takes Into Account Multiple Factors, Such As:
- The Average Customer Lifespan,
- The Customer Retention Rate,
- The Profit Margin Per Customer,
- The Rate Of Discount,
- The Average Customer Value Per Selected Interval.
CLV is a predictive measure, so the aggregated data represents the most recent 12 months from your selected reporting interval.
Now let’s dive into the analysis and see how you can easily extract customer lifetime value insights from REVEAL’s dashboard.
For this particular webshop, the average lifetime of a customer is 1.5 years, and the average LTV is around 850 euro.
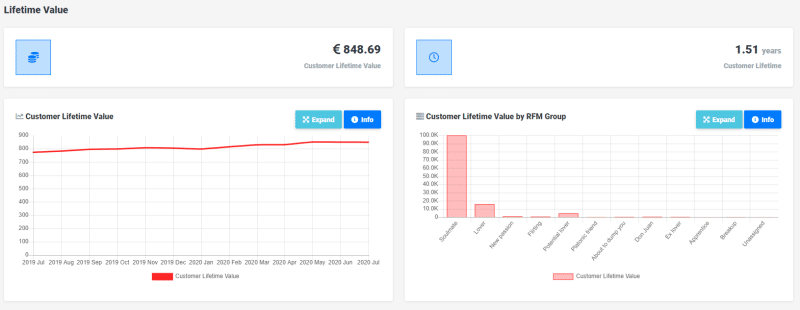
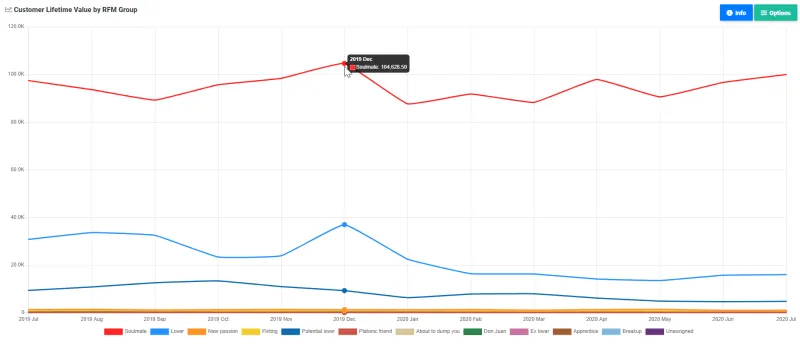
In the second graph, we notice that the most valuable customer segment, the Soulmates, has a much higher LTV than the next segment, the Lovers. The remaining segments are almost neglectable.
The report shows a spike in December 2019, when our customer ran themed campaigns.
While these numbers are useful, they don’t give us the full picture yet. Let’s switch to the Customer Segments tab, to see what we can learn about these two groups.
Customer Segments Overview: What Stands Out?
We’ll look for some insights that can help us figure out why the difference in CLV is so big between these two segments. Why is the lifetime value of Soulmates so much higher than that of other clients?
If we analyze the order and customer count, we notice that although Soulmates are less numerous than Lovers, they’re placing more orders.
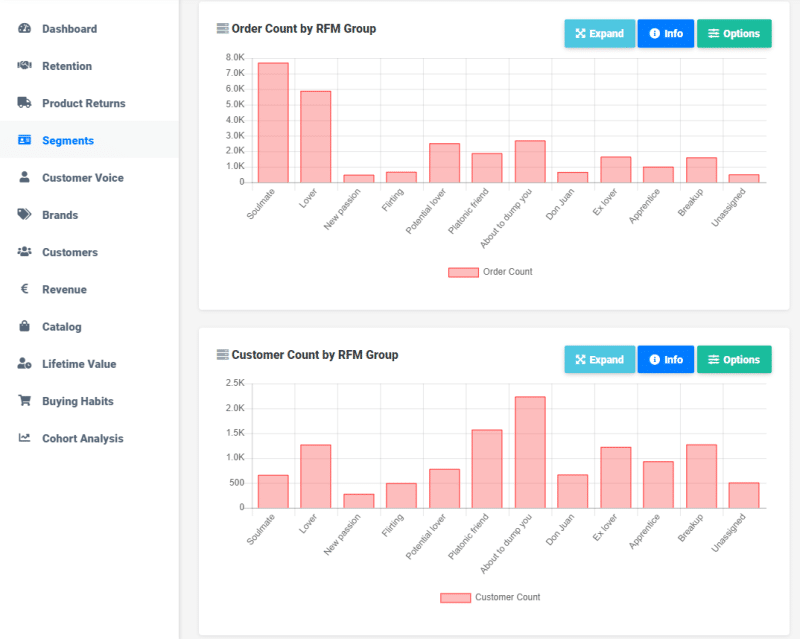
The revenue and margin are the highest for this segment, so this already gives us an indication that Soulmates are probably ordering more products, and of higher value. Their AOV is probably higher than that of Lovers.
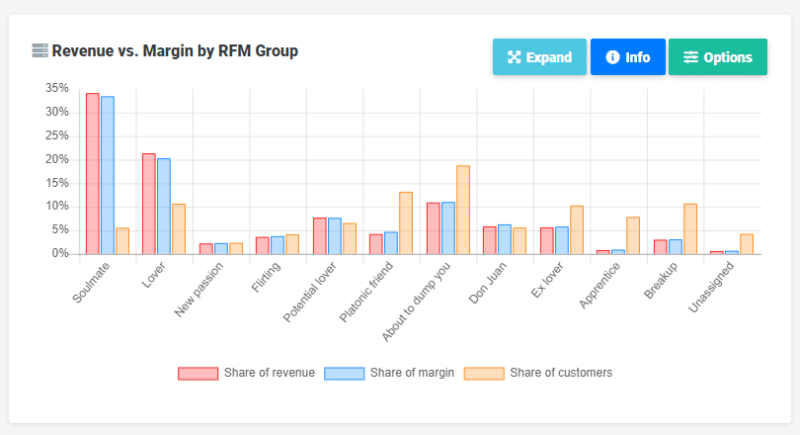
Knowing this, let’s look at the segment more in-depth, to see what exactly they’re buying! Perhaps if we can figure out the profile of our Soulmates and the brands and products they buy, we can replicate these patterns to turn the Lovers into Soulmates as well.
Analysis Of Buying Habits Per Segment: Do We Spot Patterns?
First we’ll analyze the buying habits. We’re looking only at these two segments, and only at products ordered 10 or more times.
We immediately notice two SKUs that are interesting: the Soulmates are buying significantly higher amounts of these products. Yet, Lovers are also buying them. So maybe we can use this insight to run a campaign promoting these SKUs and brands to Lovers!
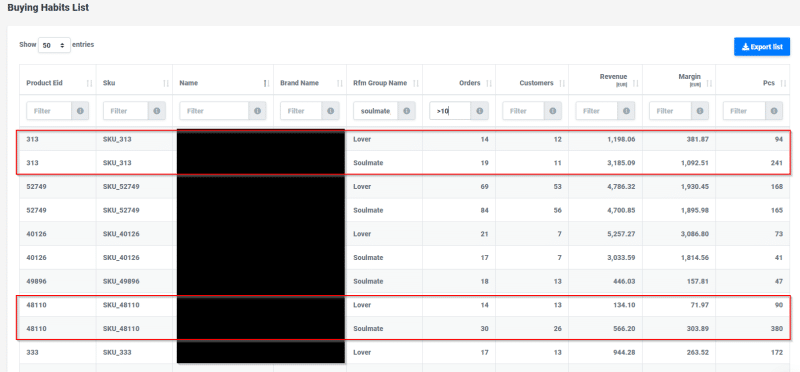
Next, we’ll look at the customer list, to see what insights we can extract that can help us increase the customer lifetime value by converting more Lovers into Soulmates!
We notice that in our top 10 customers we have 2 Lovers. They’ve placed fewer orders, but the revenue and margin are really good, so we know these two have high potential of becoming Soulmates.
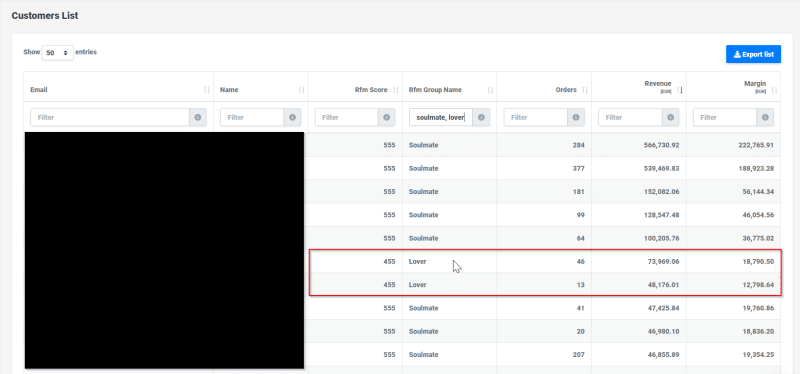
We want to encourage them to buy more often. Thus, we should dive deeper into their order history, look at their preferred brands and create personalized e-mail campaigns to stimulate them to buy again. Or even better, we could target them with loyalty offers!
Gaps And Opportunities Analysis: Are There Quick Wins?
What do we know about these customers? Let’s look at one of them.
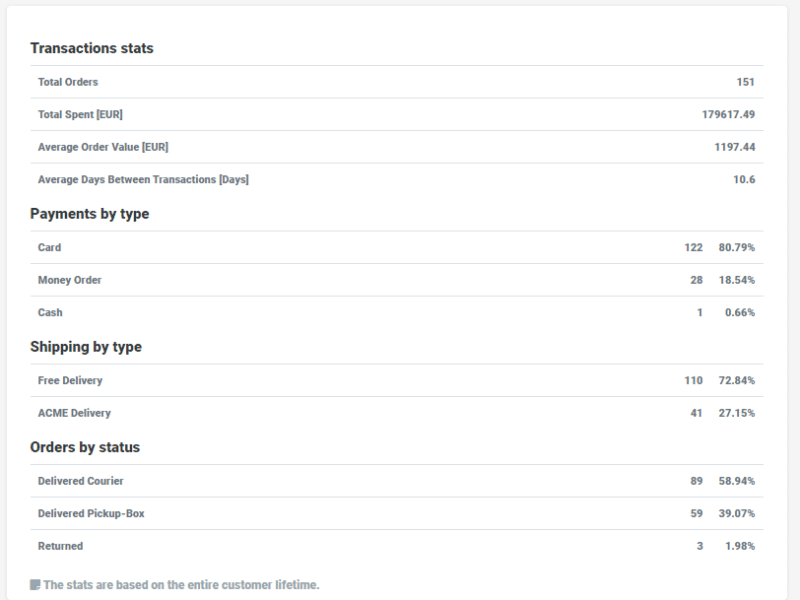
We notice that this customer places an order every 10 days or so. For comparison, one of the Soulmates has an ADBT (average days between transactions) of 1.99 days. Can we figure out what makes the Soulmate buy more often?

By comparing these two customers, we spot a gap that might be an interesting growth opportunity for this webshop.
The Soulmate is choosing Personal Pickup as delivery method very often. Maybe we can launch a focused campaign targeting only the Lovers, to inform them about this available feature!
REVEAL integrates with Klavyio, so it’s very easy to use the insights from our tool when creating personalized e-mail campaigns.
In this CLV analysis we’ve looked at clients one by one. However, you can also analyze cohorts to see their stickiness from acquisition to month one or two. Here’s how this looks in Reveal

What sticks out immediately is the cohort acquired in October 2019, which generated 67.3K in the second month. The one from November has a similar behavior
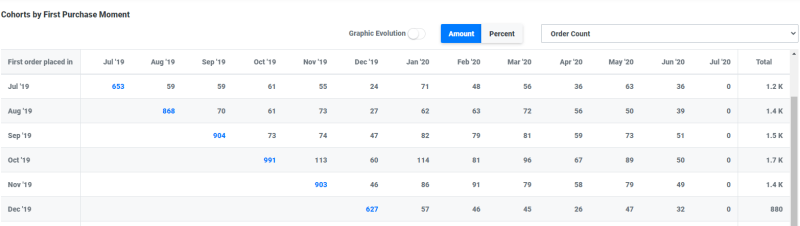
As we’re not able to see a clear pattern, we will try to analyze the second month stickiness with another report.

We know that the cohorts from October and November 2019 performed the best in their first month, so immediately after acquisition.
However, in their second month, the customers acquired in October returned more products that those acquired in November.
With this insight, our client can dig deeper into their marketing campaigns to see how exactly these cohorts were acquired, and what the onboarding looked like for them.
Perhaps one channel acquired less sticky clients, or perhaps in October there was some discount offered to new customers.
Seeing The Full Picture With Reveal
As you can see, this type of customer lifetime value analysis requires more than looking at one dashboard. To see the full picture, you need to look at the broader context and to analyze the entire journey of your customers.
REVEAL’s LTV, NPS, RFM and cohort analysis enables you to perform deep dives easily, without wasting hours on manually aggregating data.
If you have custom attributes in your CRM, such as industry data or different segmentation criteria, you can export the reports to further refine them. While we think that this analysis is easier to perform in our tool, you an compile all the data in your preferred business analytics software.
For Shopify stores, REVEAL enables you to immediately dive into your CLV reports. Our tool integrates smoothly with Shopify and it takes less than 5 minutes to see all your customer insights!
How To Calculate Your Clv In Excel: Formula And Template
You’ve seen how easy it is to extract all these insights with REVEAL! If you prefer to analyze your customer lifetime value in Excel, we’ve put together a template that you can duplicate and use.
The formula we've used in this example is:
CLV = Avg. monthly transactions * AOV * Avg. gross margin * Avg. customer lifespan
Total transactions
120
Total customers
50
Avg. monthly transactions/customer
2.4
Total revenue
20000
Number of orders placed
130
Avg. order value (AOV)
153.85
Avg. gross margin
21%
Avg. customer lifespan (months)
8
CLV
620.31
Example of CLV calculation
You can find the template here.
How to use the LTV report from Google Analytics
REVEAL is the best option for webshops with more than 10K orders. However, for smaller shops, you might want to to start with a look at the LTV reports available in Google Analytics.
Here’s a quick tour of what you can see in GA and how to interpret the CLV and cohort analysis reports.
Cohort analysis in GA
The cohorts are aggregated based on acquisition date, but the analysis only covers the most recent 3 months. REVEAL shows you the data for a full year.
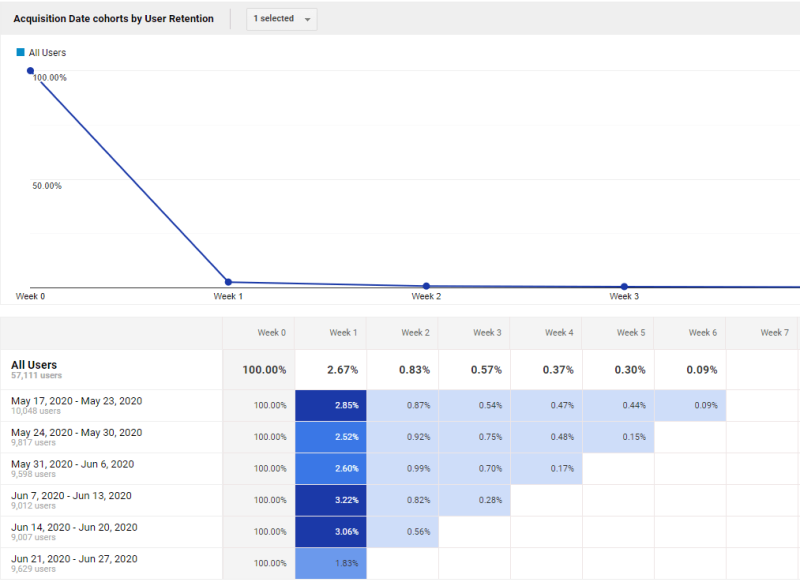
Another difference is that our tool shows you how your paying clients are behaving, while in Analytics your data includes visitors as well.
In this dashboard we can see that in Week 1, only 2-3% of customers came back, so the retention per cohort is poor.
This could mean issues with the onboarding process or that the customers weren’t happy with the goods. Or that they were acquired with discount campaigns and weren’t interested in paying more afterwards.
If you want to drill down on a specific cohort to analyze the reasons behind this performance, you can save the cohort as an individual segment by clicking on the square in the graphic.

For this new segment, you can then analyze other reports, such as demographics, or acquisition channels, or e-commerce/conversion goals.
CLV report in Google Analytics
The lifetime value report from GA is relatively brief. Still, you can see the LTV based on the acquisition channel, medium or source.
For example, for this client, one of the acquisition channels has brought in only 341 customers. However, the revenue per customer is much higher than the revenue of the other channels.

Now you have an idea of how these three options work for customer lifetime value analysis. We encourage you to opt for the automated, time-efficient solutions: REVEAL for customer data, plus Analytics for visitor data.
You can install Reveal in your Shopify store here.


If you liked this article, make it shine on your page :)