Don't Let Your Customer Slip Away: Trips & Tricks for Identifying and Retaining At-Risk Customers
Article last updated:
Article first published:
In today’s blog post, we’ll explore the world of at-risk customers and what you can do to win them back and reduce customer churn in the long run.
Do you ever zone out in a stream of melancholy, thinking about "the one that got away?"
You know, that special someone with whom you had a strong connection but who ultimately did not work out for one reason or another?
In eCommerce, "the one that got away" is a special customer, someone who used to buy from you all the time, spend a lot of money, and even bring in new customers through his recommendations.
In love and business alike, losing this special someone would leave you with a sense of missed opportunity and a desire to re-engage or reconnect with the lost individual.
While we can't comment on your love life, in eCommerce, we have a few tricks up our sleeves to help prevent our clients from losing their most valuable customers.
This blog post will explore the world of at-risk customers and what you can do to win them back and reduce customer churn in the long run.
Let's get to it!
What Are At-Risk Customers?
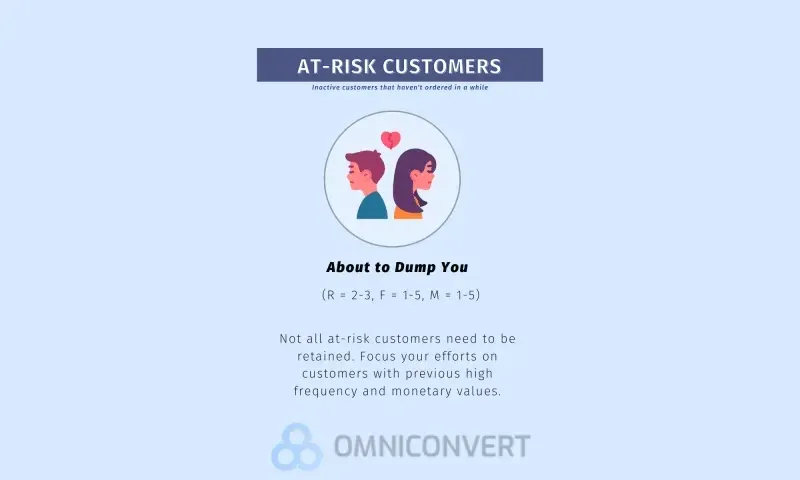
At-Risk customers represent inactive customers that haven't ordered in a while, the "About to dump you" segment in RFM analysis.
In RFM analysis, the values attributed to this customer segment vary as follows;
- Recency: 2 or 3
- Frequency: anywhere from 1 to 5
- Monetary: anywhere from 1 to 5
Before we move on, it's essential to understand that not all at-risk customers need to be retained. To some level, customer churn is natural and also beneficial to your brand. Usually, churn occurs with bargain hunters or low-value customers that only purchased one or two times and never returned.
To preserve your resources and focus on revenue-centric reactivation campaigns, you must first identify at-risk customers with a high frequency and monetary value and focus your efforts on these customers exclusively.
Otherwise, you may be wasting time and money on projects that aren't worth the effort while neglecting customers who present a real opportunity in your business.
Identifying At-Risk Customers
There's a reason why leading retail companies such as Amazon are almost religious about their customer retention strategies and focus so much on preventing churn.
Unfortunately, this reason has yet to click for that many brands. Only some businesses understand that keeping customers is more profitable than acquiring new customers or that there's a stringent need for strategies meant to reduce customer churn.
If you're the type of professional, who wants to fix the core problem causing churn instead of throwing money on acquisition to replace customers who left, here's the strategy behind finding & retaining at-risk customers.
- Monitoring Customer Behaviour.
Did you ever feel that something was off in your relationship, and you got the impression that he was planning to leave you?
It's the same in business. You'll notice signs of churning if you look at customer behavior metrics such as purchase frequency and recency, website visits, or interactions with customer support.
Sudden drops or changes in these metrics usually indicate that a customer isn't as engaged anymore and may soon churn.
- Paying attention to Customer Feedback.
It may sound obvious, but it's an important step.
Look for patterns in customer feedback, including complaints, support tickets, and surveys.
When customers express dissatisfaction or return the products, there's a problem somewhere. Suppose these complaints come from power customers and still need to be solved. In that case, a more significant issue might need to be addressed inside the customer journey.
- Segmenting your customers.
Work with your RFM Segmentation to group customers based on behavioral data, then analyze each segment to identify common trends and potentially at-risk groups.
For example, Customers who last made a purchase a long time ago are at a higher risk of churning. At the same time, those who spend less money than they used to might have stopped finding value in your products.
These customers should be approached with retention campaigns (we'll discuss the flows soon enough) to encourage them to continue doing business with you.

Like what you're reading?
Join the informed eCommerce crowd!
Stay connected to what’s hot in eCommerce. We will never bug you with irrelevant info.
By clicking the Button, you confirm that you agree with our Terms and Conditions.- Using Predictive Analytics.
Do you know that saying "those who don't know history are doomed to repeat it"?
Well, predictive analytics is the embodiment of this saying. This process uses Data, Algorithms, and Machine Learning to determine the likelihood of future outcomes based on historical data.
It's a way of looking at the past and using statistical predictive analytics to determine the future.
In eCommerce, predictive analytics helps identify at-risk customers based on their past behavior and characteristics.
When you know who these people are, you can then proactively target them with retention strategies.
- Social Media Monitoring
Keep an eye on social media channels for negative sentiments or complaints about your brand or products. At the same time, you can look at how customers interact with your content.
Be humble and allow your customers to genuinely speak their minds about their experience with you. When you find objections and issues, acknowledge and fix them - don't try and silence them with discounts.
Once you go through all these steps and have a clear understanding of who might be planning on leaving you, it's time to put your creativity to work and try to save those relationships.
Understand At-Risk Customers
An essential part of problem-solving and decision-making should be uncovering the "why" behind a situation.
You can uncover inefficiencies, bottlenecks, and other friction points in your customer relationships by questioning why your customers drop into the at-risk segment.
While it's not a pleasant process, it will lead to better decisions and products or services in the long term. Ultimately, you'll healthily reduce churn by implementing visible upgrades inside your business.
Uncovering the "why" is the next natural step after identifying at-risk customers. To do so, you must research customer behavior and get their answers to these crucial questions:
- What goods have these customers already purchased?
- What did they buy on their most recent order, exactly?
- What product categories do they prefer?
- What were the Net Promoter Score responses for their previous shopping processes?
- What recurring issues did they complain about?
The answers can help you narrow down why these customers stopped purchasing. It can be about issues they repeatedly encountered, a disappointment in product quality, or a frustrating experience with your service teams.
There are plenty of reasons that might cause the risk of churning - but you will only pinpoint them by monitoring customer behavior.
Strategy to Save At-Risk Customers
A common mistake when preventing churn in the eComm & Retail space is blasting general discounts without taking the proper time to research customer behavior & purchase history. This type of "strategy" won't lower your churn rate. In fact, it may increase it.
A better, more tactical approach to preventing at-risk customers from leaving you involves curating product discounts and recommendations. At the same time, you should identify the issues that caused the rift in the first place and fix them - to generate more customer loyalty from your high-value customers.
An email flow targeting at-risk customers must fulfill at least one of the following three primary purposes:
- Re-engage
With re-engagement, you're sending targeted messages or offers to encourage customers to return to your brand. These messages can include discount campaigns or extra perks.
- Provide curated content.
Based on customers' individual purchase histories, you can send updates on new products and services that you think they might be interested in.
The secret here is personalization. Don't try one-size-fits-all blasts; take the time to understand at-risk customers and identify products they might find relevant and valuable.
- Gathering customer feedback.
You can only repair your relationship with these people if you understand their perspective and uncover why they stopped buying.
Some will be reasons you can't control - what we call the natural churn (for example, a mother will stop buying baby clothes once her toddler becomes a child).
Other reasons are in your complete control, and you can act on them and remedy the situation (a confusing shopping process, low-quality products, inconvenient shipping options).
Ask if there is anything that you can do to improve the brand experience, listen, and act on customers' feedback.
That's it from a tactical point of view. Now, let's look at how Email Experts from Omniconvert handle prevention email flows for at-risk customers.
Flow 1 - Checking in
This is about reconnecting with your at-risk customers and showing them that you care about and value their patronage.
As for the content, this is purely an "I miss you" email with a highly personal and casual tone of voice.
You can also include a special gift as an incentive to make them engage with you again (for example digital scratch cards with guaranteed prizes).
Flow 2 - An incentive to buy
Moving on from the pure conversation checking-in message, this flow heavily relies on FOMO to encourage the customer to place an order.
Based on their purchase history, show customers the hottest products or other products they might love and offer a heavy discount + extra perks to return to you.
If the product is relevant enough (and the discount is substantial, you might mitigate the risk of churning and remind customers why they loved you so much in the first place.
Hint - you can use Omniconvert Reveal to segment customers based on their average order values and adapt the discount range accordingly. At the same time, you can avoid sending discounts and losing money on low-value customers who can be easily let go.
Flow 3 - UGC Flows
UGC stands for User Generated Content - a way of leveraging existing customers still in the power segments and providing social proof by showing real people who enjoy your products.
Social proof builds trust within your customers by showing genuine and candid positive reviews of your products.
How to Reduce At-Risk Customers
When customers are disappointed, they stop being your customers.
It's that simple (and brutal).
Obviously, you'll want to prevent customer churn altogether in the long term, not just constantly reacting to emergencies. A customer success strategy should be based on providing value, not on putting out fires.
Just as prevention is better than cure, reducing the number of customers at risk of churning is critical for the long-term success of any business.
Here are some ideas to help reduce the number of customers at risk of churning*:
*remember to pick your battles and be mindful of the type of customers you're focusing your customer retention efforts on. We're encouraging you to focus these strategies on high-valued customers with high RFM scores instead of wasting resources trying to catch 'em all.
Understand why customers churn.
The first stage in problem-solving is getting to its roots. In our case, to reduce the number of at-risk customers, you might first identify the risk factors.
Interview and survey your customers, monitor your Social Media accounts, and talk to your customer service teams. Find patterns and the most common issues reported by your power customers.
Once you've mapped your customers' complaint sources, you can take steps to address these issues.
Offer more Value through your products.
More often than not, customers will leave because they don't find value in your brand anymore.
Suppose customers leave because they are unsatisfied with your product or service. In that case, you need to focus on improving it. Gather customer feedback and use it to improve your product or service.
You can improve the products' quality, add features, provide better support, or bundle your products, to increase the perceived value of your products and build customer loyalty over time.
Focus on Excellent customer service.
While this step feels obvious, it's important to note that the main reason for client churn is lousy customer service.
Even if you can't instantly fix an issue, you can still ensure the service teams are
empathetic, responsive, helpful, and friendly.
Invest in training your teams, hiring more people (so your employees won't get overwhelmed), and prioritizing tickets from high-value customers.
Sometimes customers only want to feel as if they're being listened to. They have to know their opinion matters. So, turn the customer service team into a profit center by aligning them to the objective of offering a stellar customer experience that keeps people happy.
Offer Incentives.
More often than not, people won't churn because you lack offering a trendy discount, so this should be something other than your go-to strategy.
However, in some cases, offering incentives to customers at risk of churning can effectively keep them on board.
When offering incentives, ensure customers understand what you are offering and why. Tell them that you value their business and are committed to addressing any concerns they may have.
Ensure you're researching beforehand, so the discounts, loyalty rewards, and other incentives are relevant to your customers.
Keep in touch with your Customers.
A big part of proving to your customers that you really care about them is how you talk to them.
For example, when they're sending emails, have a real person answer them, instead of sending out an automated email written by AI.
You can also send out different pieces of content, from guides on fully taking advantage of your products to regular news updates, such as sales, limited-time discounts, or upcoming updates.
Provide personalized experiences
When offering unique experiences, you're making it more difficult for customers to switch to a competitor.
No one can make them feel like you can.
At the same time, you're more persuasive, as you're speaking directly to the customers' unique needs and wants, guiding them through the customer journey in a natural way.
Use your customer data to personalize your marketing messages and offers and create more enjoyable and rewarding customer experiences.
Wrap-up
Losing a good customer can feel a lot like losing a loved one. It hurts, it's personal, and it's definitely not something you want to happen.
Yet, as you read in this article, with the right strategies in place, you can prevent it from happening.
By identifying at-risk customers early, offering personalized experiences, and providing incentives to keep them engaged, you can build stronger relationships and reduce the likelihood of losing them. So, don't let at-risk customers become "the ones that got away."
Take action, show them you care, and keep them returning for more.
Remember, prevention is always better than cure in the game of love and business!
Frequently Asked Questions about At-Risk Customers
How do you handle a customer at-risk? To handle a customer at-risk, you first need to identify the root cause of the dissatisfaction. Then, focus on addressing the cause, communicating with customers regularly, and taking proactive steps to address their concerns and needs.
To handle a customer at-risk, you first need to identify the root cause of the dissatisfaction. Then, focus on addressing the cause, communicating with customers regularly, and taking proactive steps to address their concerns and needs.
How do you identify a high risk customer? High risk customers can be identified through various metrics. Look at behaviour variables (such as the purchase frequency, recency and monetary value), including their engagement levels. Consequently, you should also monitor customer feedback, find patterns in customer complaints, an analyse the tickets they're opening with your service teams.
High risk customers can be identified through various metrics. Look at behaviour variables (such as the purchase frequency, recency and monetary value), including their engagement levels. Consequently, you should also monitor customer feedback, find patterns in customer complaints, an analyse the tickets they're opening with your service teams.
What is the risk of customer churn? The risk of customer churn represents the risk of customers leaving your business. The risk of churn varies by industry, but it can have significant impacts on a business's revenue, reputation, and future growth. Retaining customers is crucial for long-term success.
The risk of customer churn represents the risk of customers leaving your business. The risk of churn varies by industry, but it can have significant impacts on a business's revenue, reputation, and future growth. Retaining customers is crucial for long-term success.
What is the best way you identify customers at-risk of churn for your business? The best way to identify customers at-risk of churn is to analyze their behavior and engagement with your business. Look for warning signs such as reduced purchase frequency or negative feedback, and take steps to address their concerns before it's too late. Additionally, sending customer feedback surveys regularly can help identify potential issues before they lead to churn.
The best way to identify customers at-risk of churn is to analyze their behavior and engagement with your business. Look for warning signs such as reduced purchase frequency or negative feedback, and take steps to address their concerns before it's too late. Additionally, sending customer feedback surveys regularly can help identify potential issues before they lead to churn.


Sign up to our bi-monthly newsletter!
Actionable eCommerce insights only.

Master what matters most in eCommerce
✅ Get more loyal customers
✅ Improve Customer Lifetime Value
✅ Maximize profits
Discover all features30-day free trial, no credit card necessary.
If you liked this article, make it shine on your page :)