Qualitative Research Methods: Examples, Limitations & Analysis
Article last updated:
Article first published:
CRO Guide > Chapter 3.1
Qualitative research is a method focused on understanding human behavior and experiences through non-numerical data. Qualitative research methods include:
- One-on-one interviews,
- Focus groups, Ethnographic research,
- Case studies,
- Record keeping,
- Qualitative observations
In this article, we’ll provide tips and tricks on how to use qualitative research to better understand your audience through real world examples and improve your ROI. We’ll also learn the difference between qualitative and quantitative data.

Table of Contents
Marketers often seek to understand their customers deeply. Qualitative research methods such as face-to-face interviews, focus groups, and qualitative observations can provide valuable insights into your products, your market, and your customers’ opinions and motivations. Understanding these nuances can significantly enhance marketing strategies and overall customer satisfaction.
What is Qualitative Research
Qualitative research is a market research method that focuses on obtaining data through open-ended and conversational communication. This method focuses on the “why” rather than the “what” people think about you. Thus, qualitative research seeks to uncover the underlying motivations, attitudes, and beliefs that drive people's actions.
Let’s say you have an online shop catering to a general audience. You do a demographic analysis and you find out that most of your customers are male. Naturally, you will want to find out why women are not buying from you. And that’s what qualitative research will help you find out.
In the case of your online shop, qualitative research would involve reaching out to female non-customers through methods such as in-depth interviews or focus groups. These interactions provide a platform for women to express their thoughts, feelings, and concerns regarding your products or brand. Through qualitative analysis, you can uncover valuable insights into factors such as product preferences, user experience, brand perception, and barriers to purchase.
Types of Qualitative Research Methods
Qualitative research methods are designed in a manner that helps reveal the behavior and perception of a target audience regarding a particular topic.
The most frequently used qualitative analysis methods are one-on-one interviews, focus groups, ethnographic research, case study research, record keeping, and qualitative observation.
1. One-on-one interviews
Conducting one-on-one interviews is one of the most common qualitative research methods. One of the advantages of this method is that it provides a great opportunity to gather precise data about what people think and their motivations.
Spending time talking to customers not only helps marketers understand who their clients are, but also helps with customer care: clients love hearing from brands. This strengthens the relationship between a brand and its clients and paves the way for customer testimonials.
Examples:
- A company might conduct interviews to understand why a product failed to meet sales expectations.
- A researcher might use interviews to gather personal stories about experiences with healthcare.
These interviews can be performed face-to-face or on the phone and usually last between half an hour to over two hours.
When a one-on-one interview is conducted face-to-face, it also gives the marketer the opportunity to read the body language of the respondent and match the responses.
2. Focus groups
Focus groups gather a small number of people to discuss and provide feedback on a particular subject. The ideal size of a focus group is usually between five and eight participants. The size of focus groups should reflect the participants' familiarity with the topic. For less important topics or when participants have little experience, a group of 10 can be effective. For more critical topics or when participants are more knowledgeable, a smaller group of five to six is preferable for deeper discussions.
The main goal of a focus group is to find answers to the “why”, “what”, and “how” questions. This method is highly effective in exploring people's feelings and ideas in a social setting, where group dynamics can bring out insights that might not emerge in one-on-one situations.
Examples:
- A focus group could be used to test reactions to a new product concept.
- Marketers might use focus groups to see how different demographic groups react to an advertising campaign.
One advantage that focus groups have is that the marketer doesn't necessarily have to interact with the group in person. Nowadays focus groups can be sent as online qualitative surveys on various devices.
Focus groups are an expensive option compared to the other qualitative research methods, which is why they are typically used to explain complex processes.
3. Ethnographic research
Ethnographic research is the most in-depth observational method that studies individuals in their naturally occurring environment.
This method aims at understanding the cultures, challenges, motivations, and settings that occur.
Examples:
- A study of workplace culture within a tech startup.
- Observational research in a remote village to understand local traditions.
Ethnographic research requires the marketer to adapt to the target audiences' environments (a different organization, a different city, or even a remote location), which is why geographical constraints can be an issue while collecting data.
This type of research can last from a few days to a few years. It's challenging and time-consuming and solely depends on the expertise of the marketer to be able to analyze, observe, and infer the data.
4. Case study research
The case study method has grown into a valuable qualitative research method. This type of research method is usually used in education or social sciences. It involves a comprehensive examination of a single instance or event, providing detailed insights into complex issues in real-life contexts.
Examples:
- Analyzing a single school's innovative teaching method.
- A detailed study of a patient's medical treatment over several years.
Case study research may seem difficult to operate, but it's actually one of the simplest ways of conducting research as it involves a deep dive and thorough understanding of the data collection methods and inferring the data.
5. Record keeping
Record keeping is similar to going to the library: you go over books or any other reference material to collect relevant data. This method uses already existing reliable documents and similar sources of information as a data source.
Examples:
- Historical research using old newspapers and letters.
- A study on policy changes over the years by examining government records.
This method is useful for constructing a historical context around a research topic or verifying other findings with documented evidence.
6. Qualitative observation
Qualitative observation is a method that uses subjective methodologies to gather systematic information or data. This method deals with the five major sensory organs and their functioning, sight, smell, touch, taste, and hearing.
Examples:
- Sight: Observing the way customers visually interact with product displays in a store to understand their browsing behaviors and preferences.
- Smell: Noting reactions of consumers to different scents in a fragrance shop to study the impact of olfactory elements on product preference.
- Touch: Watching how individuals interact with different materials in a clothing store to assess the importance of texture in fabric selection.
- Taste: Evaluating reactions of participants in a taste test to identify flavor profiles that appeal to different demographic groups.
- Hearing: Documenting responses to changes in background music within a retail environment to determine its effect on shopping behavior and mood.
MethodParticipantsInteractionDurationData CollectionExamplesOne-on-One Interviews Individual Direct (In-person or remote) 30 minutes to 2+ hours Direct questions and answers Product feedback, customer experience Focus Groups 5-10 (can vary) Group discussion Typically 1-2 hours Group interaction and feedback Product testing, ad campaign feedback Ethnographic Research Community/Individuals Immersive observation Days to years Observational and participatory Workplace culture, local traditions Case Study Research Individual or small group In-depth analysis Can vary (often long-term) Comprehensive, detailed analysis Educational methods, patient treatment Record Keeping None (documents) None (document analysis) Varies with depth of study Analysis of existing documents Historical research, policy study Qualitative Observation Individuals or groups Non-intrusive observation Varies, often shorter-term Descriptive (non-quantitative) Consumer behavior, child development
Below we are also providing real-life examples of qualitative research that demonstrate practical applications across various contexts:
Qualitative Research Real World Examples
Let's explore some examples of how qualitative research can be applied in different contexts.
1. Online grocery shop with a predominantly male audience
Method Used: One-on-one Interviews
Let's go back to one of the previous examples. You have an online grocery shop. By nature, it addresses a general audience, but after you do a demographic analysis you find out that most of your customers are male.
One good method to determine why women are not buying from you is to hold one-on-one interviews with potential customers in the category.
Interviewing a sample of potential female customers should reveal why they don't find your store appealing. The reasons could range from not stocking enough products for women to perhaps the store's emphasis on heavy-duty tools and automotive products, for example. These insights can guide adjustments in inventory and marketing strategies.
2. Software company launching a new product
Method Used: Focus Groups
Focus groups are great for establishing product-market fit.
Let's assume you are a software company that wants to launch a new product and you hold a focus group with 12 people. Although getting their feedback regarding users' experience with the product is a good thing, this sample is too small to define how the entire market will react to your product.
So what you can do instead is holding multiple focus groups in 20 different geographic regions. Each region should be hosting a group of 12 for each market segment; you can even segment your audience based on age. This would be a better way to establish credibility in the feedback you receive.
3. Alan Pushkin's “God's Choice: The Total World of a Fundamentalist Christian School”
Method Used: Ethnographic Research
Moving from a fictional example to a real-life one, let's analyze Alan Peshkin's 1986 book “God's Choice: The Total World of a Fundamentalist Christian School”.
Peshkin studied the culture of Bethany Baptist Academy by interviewing the students, parents, teachers, and members of the community alike, and spending eighteen months observing them to provide a comprehensive and in-depth analysis of Christian schooling as an alternative to public education.
The study highlights the school's unified purpose, rigorous academic environment, and strong community support while also pointing out its lack of cultural diversity and openness to differing viewpoints. These insights are crucial for understanding how such educational settings operate and what they offer to students.
Even after discovering all this, Peshkin still presented the school in a positive light and stated that public schools have much to learn from such schools.
Peshkin's in-depth research represents a qualitative study that uses observations and unstructured interviews, without any assumptions or hypotheses. He utilizes descriptive or non-quantifiable data on Bethany Baptist Academy specifically, without attempting to generalize the findings to other Christian schools.
4. Understanding buyers' trends
Method Used: Record Keeping
Another way marketers can use quality research is to understand buyers' trends. To do this, marketers need to look at historical data for both their company and their industry and identify where buyers are purchasing items in higher volumes.
For example, electronics distributors know that the holiday season is a peak market for sales while life insurance agents find that spring and summer wedding months are good seasons for targeting new clients.
5. Determining products/services missing from the market
Method Used: Record Keeping
Conducting your own research isn't always necessary. If there are significant breakthroughs in your industry, you can use industry data and adapt it to your marketing needs.
The influx of hacking and hijacking of cloud-based information has made Internet security a topic of many industry reports lately. A software company could use these reports to better understand the problems its clients are facing.
As a result, the company can provide solutions prospects already know they need.
Qualitative Research Approaches
Once the marketer has decided that their research questions will provide data that is qualitative in nature, the next step is to choose the appropriate qualitative approach.
The approach chosen will take into account the purpose of the research, the role of the researcher, the data collected, the method of data analysis, and how the results will be presented. The most common approaches include:
- Narrative: This method focuses on individual life stories to understand personal experiences and journeys. It examines how people structure their stories and the themes within them to explore human existence. For example, a narrative study might look at cancer survivors to understand their resilience and coping strategies.
- Phenomenology: attempts to understand or explain life experiences or phenomena; It aims to reveal the depth of human consciousness and perception, such as by studying the daily lives of those with chronic illnesses.
- Grounded theory: investigates the process, action, or interaction with the goal of developing a theory “grounded” in observations and empirical data.
- Ethnography: describes and interprets an ethnic, cultural, or social group;
- Case study: examines episodic events in a definable framework, develops in-depth analyses of single or multiple cases, and generally explains “how”. An example might be studying a community health program to evaluate its success and impact.
How to Analyze Qualitative Data
Analyzing qualitative data involves interpreting non-numerical data to uncover patterns, themes, and deeper insights. This process is typically more subjective and requires a systematic approach to ensure reliability and validity.
1. Data Collection
Ensure that your data collection methods (e.g., interviews, focus groups, observations) are well-documented and comprehensive. This step is crucial because the quality and depth of the data collected will significantly influence the analysis.
2. Data Preparation
Once collected, the data needs to be organized. Transcribe audio and video recordings, and gather all notes and documents. Ensure that all data is anonymized to protect participant confidentiality where necessary.
3. Familiarization
Immerse yourself in the data by reading through the materials multiple times. This helps you get a general sense of the information and begin identifying patterns or recurring themes.
4. Coding
Develop a coding system to tag data with labels that summarize and account for each piece of information. Codes can be words, phrases, or acronyms that represent how these segments relate to your research questions.
- Descriptive Coding: Summarize the primary topic of the data.
- In Vivo Coding: Use language and terms used by the participants themselves.
- Process Coding: Use gerunds (“-ing” words) to label the processes at play.
- Emotion Coding: Identify and record the emotions conveyed or experienced.
5. Thematic Development
Group codes into themes that represent larger patterns in the data. These themes should relate directly to the research questions and form a coherent narrative about the findings.
6. Interpreting the Data
Interpret the data by constructing a logical narrative. This involves piecing together the themes to explain larger insights about the data. Link the results back to your research objectives and existing literature to bolster your interpretations.
7. Validation
Check the reliability and validity of your findings by reviewing if the interpretations are supported by the data. This may involve revisiting the data multiple times or discussing the findings with colleagues or participants for validation.
8. Reporting
Finally, present the findings in a clear and organized manner. Use direct quotes and detailed descriptions to illustrate the themes and insights. The report should communicate the narrative you've built from your data, clearly linking your findings to your research questions.
Limitations of qualitative research
The disadvantages of qualitative research are quite unique. The techniques of the data collector and their own unique observations can alter the information in subtle ways. That being said, these are the qualitative research's limitations:
1. It's a time-consuming process
The main drawback of qualitative study is that the process is time-consuming. Another problem is that the interpretations are limited. Personal experience and knowledge influence observations and conclusions.
Thus, qualitative research might take several weeks or months. Also, since this process delves into personal interaction for data collection, discussions often tend to deviate from the main issue to be studied.
2. You can't verify the results of qualitative research
Because qualitative research is open-ended, participants have more control over the content of the data collected. So the marketer is not able to verify the results objectively against the scenarios stated by the respondents. For example, in a focus group discussing a new product, participants might express their feelings about the design and functionality. However, these opinions are influenced by individual tastes and experiences, making it difficult to ascertain a universally applicable conclusion from these discussions.
3. It's a labor-intensive approach
Qualitative research requires a labor-intensive analysis process such as categorization, recording, etc. Similarly, qualitative research requires well-experienced marketers to obtain the needed data from a group of respondents.
4. It's difficult to investigate causality
Qualitative research requires thoughtful planning to ensure the obtained results are accurate. There is no way to analyze qualitative data mathematically. This type of research is based more on opinion and judgment rather than results. Because all qualitative studies are unique they are difficult to replicate.
5. Qualitative research is not statistically representative
Because qualitative research is a perspective-based method of research, the responses given are not measured.
Comparisons can be made and this can lead toward duplication, but for the most part, quantitative data is required for circumstances that need statistical representation and that is not part of the qualitative research process.
While doing a qualitative study, it's important to cross-reference the data obtained with the quantitative data. By continuously surveying prospects and customers marketers can build a stronger database of useful information.
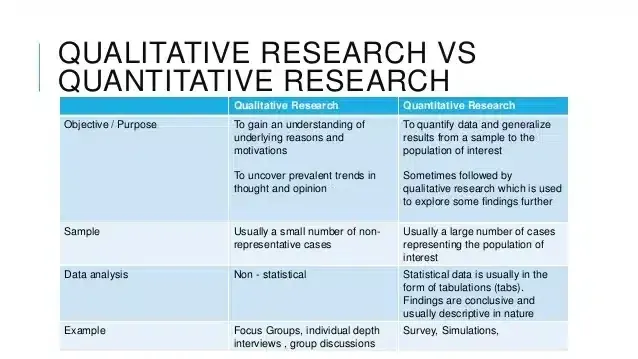
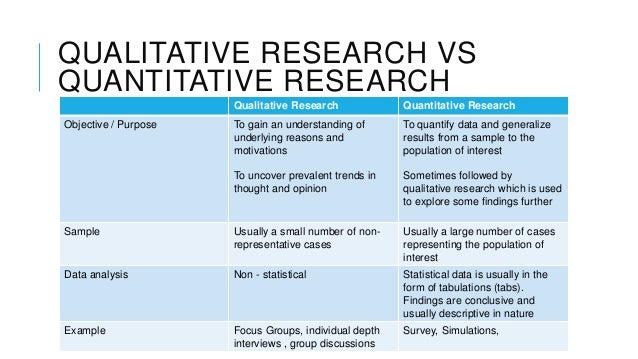
Quantitative vs. Qualitative Research
Quantitative and qualitative research are two distinct methodologies used in the field of market research, each offering unique insights and approaches to understanding consumer behavior and preferences.
As we already defined, qualitative analysis seeks to explore the deeper meanings, perceptions, and motivations behind human behavior through non-numerical data. On the other hand, quantitative research focuses on collecting and analyzing numerical data to identify patterns, trends, and statistical relationships.
Let's explore their key differences:
Nature of Data:
- Quantitative research: Involves numerical data that can be measured and analyzed statistically.
- Qualitative research: Focuses on non-numerical data, such as words, images, and observations, to capture subjective experiences and meanings.
Research Questions:
- Quantitative research: Typically addresses questions related to "how many," "how much," or "to what extent," aiming to quantify relationships and patterns.
- Qualitative research: Explores questions related to "why" and "how," aiming to understand the underlying motivations, beliefs, and perceptions of individuals.
Data Collection Methods:
- Quantitative research: Relies on structured surveys, experiments, or observations with predefined variables and measures.
- Qualitative research: Utilizes open-ended interviews, focus groups, participant observations, and textual analysis to gather rich, contextually nuanced data.
Analysis Techniques:
- Quantitative research: Involves statistical analysis to identify correlations, associations, or differences between variables.
- Qualitative research: Employs thematic analysis, coding, and interpretation to uncover patterns, themes, and insights within qualitative data.
AspectQuantitative ResearchQualitative ResearchFocus Measurement, numbers Understanding, words Goal Generate numerical data, uncover patterns Gain understanding of underlying reasons, opinions, motivations Data Collection Methods Surveys, interviews, longitudinal studies, observations Focus groups, individual interviews, participation/observation Use Quantify the problem, formulate facts Gain insights, develop ideas for further research Data Characteristics Measurable, statistical Rich, detailed Generalizability Broad, generalizable findings Rich understanding, reduced generalizability Sample Size Large sample sizes Small sample sizes Researcher Role Objective observer Subjective interpreter
If you haven't subscribed yet to our newsletter, now is your chance!

Like what you're reading?
Join the informed eCommerce crowd!
Stay connected to what’s hot in eCommerce. We will never bug you with irrelevant info.
By clicking the Button, you confirm that you agree with our Terms and Conditions.Continue your Conversion Rate Optimization Journey
Chapter 2: Your First Steps in CRO Chapter 3.2: Qualitative research


Sign up to our bi-monthly newsletter!
Actionable eCommerce insights only.

Master what matters most in eCommerce
✅ Get more loyal customers
✅ Improve Customer Lifetime Value
✅ Maximize profits
Discover all features30-day free trial, no credit card necessary.
If you liked this article, make it shine on your page :)