In-Store Experiments: How to Run and Analyze Retail Tests

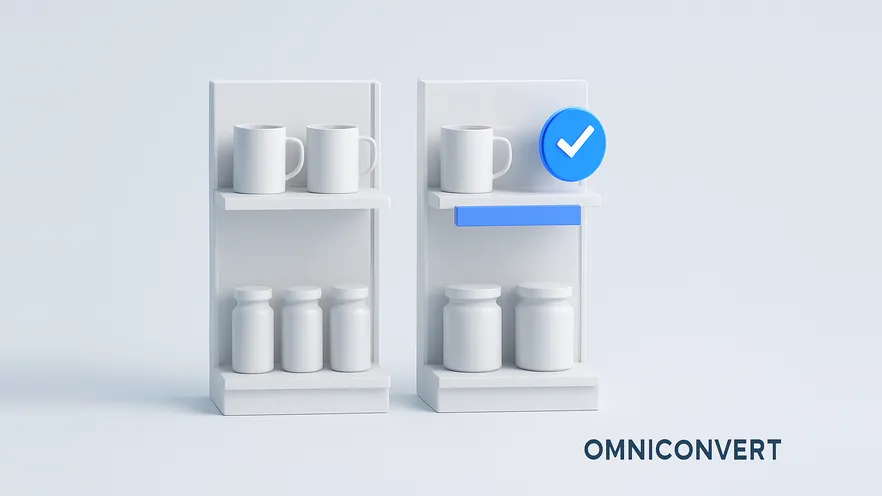
- An in-store experiment is a controlled test in a physical store: change one variable in test stores and compare the result with unchanged control stores.
- Good in-store hypotheses come from data, such as customer segments and anomalies by product, brand or store, and from ideas raised by store and category managers.
- The number of test stores and the minimum detectable effect decide how long a test must run; more stores reach a reliable result faster.
- In-store changes are applied by people, not software, so check that every test store applies the change consistently before you trust the data.
- A test that lifts revenue can still reduce loyalty, so measure customer lifetime value, NPS and CSAT alongside orders and revenue.
It's impossible to throw a stone in the online realm and not hit someone advocating for A/B testing and experimentation in eCommerce. In itself, that's great. Only an experimentation-focused mindset uncovers the specific combinations that bring your revenue up.
But what happens with traditional, offline retailers? How are they supposed to experiment?
The short answer: an in-store experiment is a controlled test in a physical store. You change one thing, such as a shelf layout, a price or a promotion, in a group of test stores, keep similar stores unchanged as a control, and compare the results. To that end, we've put together a methodology for running experiments to test retail marketing and UX strategies, in five steps plus a few points that apply to the whole process.
Ready? Let's go!
Step 1: how do you craft a research question and hypothesis for an in-store experiment?
Your research question should be specific and relevant. For example, you might want to find out how changing the layout of a product category affects customer attention, engagement and purchases.
Your hypothesis should be a statement you can test, predicting what you think will happen based on your assumptions and what you already know. For instance, you might think that putting the most profitable products at eye level will increase sales and make customers happier.
To do good research in traditional retail stores, you need good insights from data. As more traditional retailers learn about their customers, it's really valuable to look at how customers behave when they buy, so you can come up with hypotheses that are based on evidence. Here are some ways to do this:
- Segment your customers into groups using methods such as RFM or more advanced ways of segmenting.
- Hunt anomalies, like which products, brands or stores have more frequent purchases or bring in more money from customers over time.
- Get test ideas from store managers or category managers. They might notice things that the data or retail teams don't.
Step 2: how do you choose the experimental setup and variables?
The setup is all about isolating the effect of your marketing idea. There are different ways to set up experiments, and each has its pros and cons:
| Setup | How it works in a store | How to read it |
|---|---|---|
| Randomized trial | Stores (or aisles) are assigned to test or control at random. | The strongest protection against bias, but you need enough comparable stores for randomness to balance them out. |
| Split test | One version in the test stores, the current version in matched control stores, over the same period. | The simplest to run and explain. Match stores on size, location and sales so differences come from the change, not the store. |
| Factorial design | Two or more variables change in combination, for example lighting and a promotion. | Shows how variables interact, but every combination needs its own group of stores, so it needs a larger estate. |
You also need to decide what you'll change and what you'll measure. The variable you change is the hypothesis you're testing, such as the price or where you place a product. The variable you measure is what you see happening, like how many customers show up, how long they stay or how much they spend.
What variables could you test? Here are some ideas from our experience:
- Put Snickers bars near the checkout.
- Give less shelf space to toilet paper and more to makeup.
- Find and try out three new suppliers of exotic products.
- Adjust the lighting in the wine section.
- Try buy-one-get-one deals for makeup.
- Use signs in the store to promote Heineken.
- Run a taste test for a new vegan brand.
- Give discounts on cooked meals in the evening.
- Give out special discount codes at 8 PM.
- Put pictures of babies in the clothing area.
Step 3: how do you choose sample, stores and test duration?
Your sample group consists of the customers who will take part in your experiment, whether they know it or not. Think about how you'll pick and assign your sample to different conditions, which could involve random selection, grouping or letting people choose for themselves.
Your location is simply where you'll run your experiment, like a specific store, aisle or shelf. Pick a place that fits what you're testing and doesn't have too many distractions like noise, crowds or bad weather. If you have regular customers who make a big difference to your sales, you're in a good position to see how your experiment affects things.
To put it plainly: if you're hoping to boost sales by 15% by adding two new beer brands, how long should you wait if you're only trying them out in four of your stores? The more stores you try it in, the faster you'll get results, because you'll have more customers and orders.
Here are some things to decide before you start:
-
Test and control storesWhich stores run the experiment and which ones don't. Match them on size, location and past sales.
-
Products in scopeWhat kinds of products you're looking at, and which neighboring categories the change could affect.
-
Goal and expected upliftWhat you're hoping to achieve and how much you think sales will go up. The expected uplift is your minimum detectable effect.
-
Confidence levelHow sure you want to be that your results are reliable. Aim for over 95% confidence.
-
DurationHow long the experiment runs. It depends on the minimum detectable effect: the smaller the uplift you want to detect and the fewer the stores, the longer you wait. Cover full weekly cycles so weekday and weekend shoppers are both in the data.
Step 4: how do you run the in-store experiment and gather data?
This is where you put your experiment into action. Your plan should cover:
- when and where you'll make your changes,
- how you'll keep track of what's happening,
- and what you'll do if something unexpected comes up.
Use the right tools to collect data, whether that's surveys, observations, scanners, cameras or sensors. And of course, make sure your data collection is accurate, reliable and follows all the rules and guidelines for your industry.
Before you kick things off, ensure that the changes you're making are applied consistently in all the stores involved in the experiment. Unlike an online test, where software shows the variation the same way to everyone, an in-store test depends on people. Some store managers might not see the importance of the changes, so get everyone on board, and check the rollout in each store (photos of the shelf or display work well) before you trust the data.
Track both sides of the result: what customers buy and what they say about their experience, for example through NPS or CSAT surveys.
Step 5: how do you analyze in-store experiment results?
T-tests compare two conditions, ANOVA compares more than two, and regression helps control for other factors such as store size or season. Double-check the accuracy and consistency of your data and results, and look out for any possible biases, errors or factors that might affect your conclusions.
After that, interpret your results in light of your original research question and hypothesis, and explain what they mean for your retail marketing strategy. Point out any limitations, implications or suggestions that arise from your experiment, and propose further research or actions where needed.
We firmly believe in Customer Lifetime Value as a guiding metric in retail. Sometimes experiments seem beneficial in terms of revenue at first, but they have a slow, negative impact over time.
For example, you might create more space on your shelf by removing two beer brands. At first, customers who used to buy those brands may keep shopping at your store. Gradually, though, they might become dissatisfied if they were loyal to those brands and start buying from competitors that still carry them.
That's why it's important to measure more than immediate transactional metrics like orders, customers and revenue. Long-term metrics such as NPS (Net Promoter Score), CSAT (Customer Satisfaction Score) and CLV (Customer Lifetime Value) matter too, when you take a customer-centric approach. Nexus by Omniconvert calculates CLV and RFM segments from your customer data, so you can see whether a test changed the behavior of your most valuable customers.
What else should you consider when running in-store experiments?
Before signing off, here's a final rundown of crucial aspects of experimentation that don't fit into a specific step. They apply to the entire experiment, influencing both your results and your overall enjoyment of the process.
- Data privacy. Handle customer data with care and follow all the rules about privacy. Keep customers' information safe and secure, both legally and morally.
- Resources. Any experiment requires time, people and money. Make sure you've got enough of each to do it right.
- Feedback. Pay attention to what customers and store staff say during and after the experiment. Their insights are valuable in figuring out what's working and what's not.
- Time. The effects of your experiments might not show up right away. Keep an eye on how things change over time, like customer habits and what people think of your brand.
- Records. Keep good records of what you're doing and what you're learning. It helps you learn from your experience and share your insights with others.
How do in-store experiments connect to online A/B testing?
Online tests are easier to control: software splits visitors at random and shows each variation the same way to everyone. That makes the website a useful place to test the ideas behind a store pilot, such as a promotion mechanic, a cross-sell placement or a message, or to follow up on a store result with online customers.
If your stores and website work as one business, read these next: how to keep online and offline channels aligned, how click and collect and reserve and collect connect the two, and how to track customer interactions across all channels. For the online testing process itself, see how to build an A/B testing plan.
In-store experiments FAQs
An in-store experiment is a controlled test in a physical store. You change one thing, such as a shelf layout, a price, a promotion or a sign, in some stores or aisles, keep other stores unchanged as a control, and compare the results. It is the offline equivalent of an A/B test on a website.
Almost anything a customer sees or experiences: product placement, shelf space per category, lighting, signage, promotions such as buy-one-get-one deals, time-based discounts, tastings, new brands or suppliers, and imagery in a department. Test one variable at a time so you know what caused the change.
Online, software splits visitors randomly and applies the change the same way for everyone. In a store, you usually split by store, aisle or time period, people apply the change by hand, and many outside factors such as weather, local events and staffing affect results. In-store tests therefore need matched control stores, careful rollout checks and more time.
There is no fixed number. It depends on your traffic and orders per store, the minimum detectable effect you expect and the confidence level you want. The smaller the expected uplift and the fewer the stores, the longer the test must run. Adding more test stores gives you more customers and orders, so you reach a reliable result faster.
Long enough to reach your target confidence, usually 95% or more, for the minimum detectable effect you set before the test. Cover at least full weekly cycles so weekday and weekend behavior are both included, and keep watching long-term metrics after the test ends, because some effects show up only over months.
Common methods are t-tests to compare two conditions, ANOVA to compare more than two, and regression to control for other factors such as store size or season. Before you trust the result, check the data for errors, inconsistent rollout and biases that could explain the difference.
Because a change can lift revenue now and damage loyalty later. For example, removing two beer brands frees shelf space, but loyal buyers of those brands may slowly move to competitors. Tracking CLV, NPS and CSAT next to orders and revenue shows whether a winning test is still a win for the business over time.
No. Omniconvert Explore tests digital experiences: websites, landing pages and on-site surveys. It does not change shelves or signs in a physical store. Retailers use it for the online side of the same questions, for example testing a promotion or a product placement idea on the website, or collecting customer feedback with surveys, alongside their store pilots.
Offline retailers can experiment with the same discipline as online stores. Start from a data-based hypothesis, change one variable, compare test stores with similar control stores, make sure the change is applied the same way everywhere, and give the test enough stores and time to reach a reliable result. Then read the outcome against customer lifetime value and customer feedback, not only this month's revenue. Handle customer data with care, budget the time, people and money a test needs, listen to customers and staff, and keep good records so every experiment teaches the next one. Good luck!
Test the online side of your retail ideas
Omniconvert Explore lets you A/B test promotions, product placement and messaging on your website, and collect customer feedback with on-site surveys. Get evidence online while your store pilots run.