The KPI Pyramid: Maslow's Hierarchy for Marketing KPIs

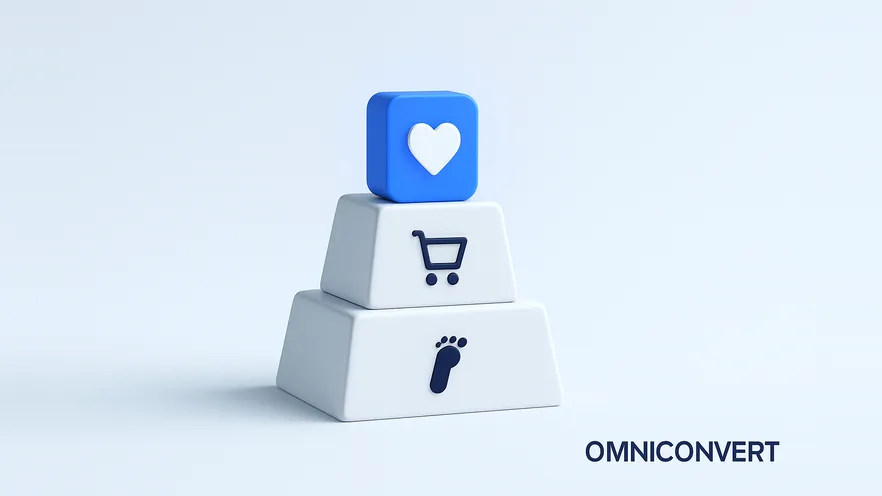
- Maslow's hierarchy of needs has five levels: physiological, safety, love and belonging, esteem, and self-actualization. Maslow introduced it in a 1943 paper.
- The KPI pyramid is an Omniconvert framework inspired by Maslow's logic that lower needs come first. It is not part of Maslow's theory.
- The base tier is traffic KPIs: total visits, page views, unique visitors, bounce rate, and traffic by source.
- The middle tier is advertising and sales KPIs: cost per acquisition, cost per conversion, orders, leads, conversion rate, average order value, and ROI.
- The top tier is loyalty and brand KPIs: visitor loyalty, My Account usage, branded traffic, branded external links, Customer Lifetime Value, and Net Promoter Score.
The Maslow pyramid for online marketing KPIs is a way to decide which metrics matter at each stage of an online business. It borrows one idea from Maslow's hierarchy of needs: basic needs come before higher ones. For an online business, traffic is the basic need. Advertising and sales performance come next. Loyalty and brand strength sit at the top.
As a business grows and its market changes, the KPIs it watches must change too. A new store that tracks Net Promoter Score before it has steady traffic is measuring the wrong thing. An established store that still reports only visits is missing where its growth comes from. This article explains the three tiers, the KPIs in each, and how to use the pyramid to set priorities. For the process of tracking KPIs once you have chosen them, see our guide to KPI tracking.
What is the Maslow pyramid for online marketing KPIs?
Businesses move through recognizable stages online, and each stage needs its own set of metrics to measure progress. The pyramid names three of them.
| Tier | Business stage | Example KPIs | The question it answers |
|---|---|---|---|
| Base: traffic | Foundation: establishing presence | Total visits, page views, unique visitors, bounce rate, traffic by source | Do people find us, and does the site hold their attention? |
| Middle: advertising and sales | Growth: expanding reach and engagement | PPC cost per acquisition, PPC cost per conversion, orders, leads, conversion rate, average order value, ROI | Does the traffic we pay for turn into profitable revenue? |
| Top: loyalty and brand | Optimization: fostering loyalty and advocacy | Visitor loyalty, My Account usage, branded traffic, branded external linking, CLV, NPS | Do customers come back, recommend us, and look for us by name? |
The framework is a prioritization tool, not a complete list of every metric you could track. For a wider catalog of conversion metrics grouped by category, see CRO metrics.
What is Maslow's hierarchy of needs?
Maslow set out the theory in his 1943 paper A Theory of Human Motivation and developed it in his 1954 book Motivation and Personality. It is usually drawn as a pyramid, from the bottom up:
-
Physiological needsFood, water, warmth, sleep. The requirements for survival.
-
Safety needsPersonal security, health, stability, and freedom from fear.
-
Love and belonging needsFriendship, family, intimacy, and being part of a group.
-
Esteem needsRespect, recognition, status, and a sense of accomplishment.
-
Self-actualizationReaching your full potential and pursuing personal growth.
Maslow did not treat the order as strict. He noted that most people have needs at several levels partly satisfied at the same time. The useful principle is the general direction: when a lower need is badly unmet, it takes over attention.
That principle is what the KPI pyramid borrows. Maslow wrote about people, not businesses, and he never proposed a set of marketing metrics. The three tiers below are our analogy. Traffic plays the role of a survival need: without visitors, nothing else happens. Advertising and sales play the role of stability: the business can pay for its own growth. Loyalty and brand play the role of the higher needs: belonging, recognition, and reputation.
The bottom of the pyramid: traffic KPIs
For eCommerce, and especially for new ventures, traffic KPIs matter most. Traffic is the foundation of an online presence. Without a steady flow of visitors, metrics like conversion rate, lead generation and even bounce rate lose meaning, because the numbers are too small to read.
The focus at this stage is visibility, attracting visitors, and making sure the site gives them a reasonable first experience.
- Total visits: how many sessions the site receives. The simplest signal that marketing reaches anyone.
- Page views: how many pages visitors load. Shows whether visitors explore beyond the landing page.
- Unique visitors: how many different people visit. Separates a growing audience from the same people returning.
- Bounce rate: the share of visits that leave after one page. A high rate on a key landing page points to a mismatch between the promise that brought the visitor and what the page shows. See bounce rate vs exit rate.
- Traffic by source: where visits come from: organic search, paid ads, email, social, referral, direct. Shows which channels work and how dependent you are on any single one.
A healthy base tier is not only a large number. It is traffic that is growing, comes from more than one source, and does not bounce straight off the pages that matter.
The middle of the pyramid: advertising and sales KPIs
As a business matures, its needs go beyond getting traffic. Online stores start to grow through advertising, and they need to know which channels are worth the money. Monitoring advertising KPIs becomes necessary for good decisions.
Advertising KPIs
Pay-per-click cost per acquisition and pay-per-click cost per conversion show how efficient each campaign is and what it returns. Compare them by channel, campaign and audience, not only as an account total, because a good average often hides one campaign that loses money.
Sales KPIs
Sales KPIs become important at the same stage, because they show the result of all the traffic and advertising work below them. They confirm what works and signal when a strategy needs to change.
- Number of orders and number of leads: the volume of results.
- Conversion rate: the share of visits that end in an order or a lead. It connects the traffic tier to revenue.
- Average order value: revenue divided by number of orders. See how to increase average order value.
- Return on investment: what the marketing spend returns compared with what it cost.
This is the tier where testing pays off most directly. A change to a product page, a checkout step or a landing page moves conversion rate and average order value, and a controlled A/B test tells you whether the change caused the movement.
The top of the pyramid: loyalty and brand KPIs
The top of the pyramid is for fully developed businesses. Once traffic, advertising and sales work, the focus shifts to building loyalty among customers and raising brand awareness. This is where a business stops depending only on the next paid visit.
Loyalty KPIs
- Visitor loyalty: how often visitors come back. A rising share of returning visits means the site gives people a reason to return.
- My Account usage: how many customers log in to their account. Customers who use their account are invested in the relationship.
- Customer Lifetime Value (CLV): the total value a customer brings over the whole relationship. It shows how much a customer is worth keeping, and how much you can afford to spend to acquire one.
- Net Promoter Score (NPS): how likely customers are to recommend you, on a 0 to 10 scale. A direct measure of advocacy.
Brand awareness KPIs
- Branded traffic: visits from searches that include your brand name. People who look for you by name already know you.
- Branded external linking: other sites that link to you by name. A sign that your brand is part of the conversation in your market.
Monitor loyalty KPIs to see whether branding work resonates, and to find the customers who can become advocates. CLV in particular changes decisions across the whole pyramid. When you know which customers are worth the most, you can judge acquisition cost against lifetime value instead of against the first order. For more metrics in this tier, see customer loyalty metrics.
Measuring this tier needs customer-level data, not only session data. Nexus by Omniconvert builds RFM segments and CLV estimates from your order history, shows which segments are loyal and which are drifting away, and pushes those segments to Meta Ads, Google Ads and Klaviyo.
How do you use the KPI pyramid to prioritize?
-
Check the base tier firstIs traffic growing, and does it come from more than one source? Is bounce rate reasonable on your key landing pages? If not, this is your priority.
-
Check the middle tierDo visitors convert? Does paid traffic cost less to acquire than it returns? If traffic is healthy but sales are not, focus here.
-
Check the top tierDo customers buy again, and what is their lifetime value? If sales are steady but most customers buy once, loyalty is where the growth is.
-
Choose three to five KPIs for your tierPick the KPIs that describe the problem you found, record a baseline, and set a target. Too many KPIs hide the signal.
-
Review, act, and move upReview the KPIs on a fixed schedule and use them to decide what to change. When the tier is stable, move your main focus up one level, but keep the lower tiers on your dashboard.
The pyramid works best as a tool for decisions, not for reporting. Its value is that it tells you which number to act on next, and which numbers can wait.
How do customer feedback and social media analytics support your KPIs?
The voice of the customer is now easy to hear. Understanding it, and acting on it, is part of building a strategy that works over the long term.
Customer feedback
Customer feedback gives direct insight into product satisfaction, user experience and brand perception. Collect it through surveys, reviews and direct conversations, then analyze it to improve your offer, fix pain points and build stronger relationships with customers. It also helps you understand consumer behavior behind the numbers. On-site surveys in Omniconvert Explore let you ask visitors at the moment they act, for example on an exit or after checkout.
Sentiment analysis
Sentiment analysis tools measure the overall feeling around your brand, products or campaigns across online platforms. Monitor sentiment trends, identify key themes, and find where sentiment is positive or negative. Then adapt your messages, content and customer interactions to match.
Social media analytics
Social media platforms hold a lot of information about customers and their behavior. Social media analytics shows audience demographics, engagement, content performance and trends. Use it to improve your social strategy, focus on the content that performs, and build real interaction with your followers.
From insight to decision
When you combine customer feedback and social media analytics with your KPIs, you understand your audience's preferences, needs and feelings. With that knowledge you can make informed decisions, write messages that match your market, and run campaigns that produce measurable results.
Frequently Asked Questions
Maslow's hierarchy says that basic needs must be met before higher needs start to drive behavior. The KPI pyramid borrows that logic for a business: traffic is the basic need, advertising and sales performance come next, and loyalty and brand strength sit at the top. You track and fix the lower tier first, because the KPIs above it have no meaning without it. The mapping is an Omniconvert framework inspired by Maslow, not part of Maslow's own theory.
From the bottom up, the five levels are physiological needs (food, water, sleep), safety needs (security, stability, health), love and belonging needs (relationships and community), esteem needs (respect, status, recognition), and self-actualization (reaching your full potential). Abraham Maslow introduced the theory in his 1943 paper A Theory of Human Motivation and developed it in his 1954 book Motivation and Personality.
Traffic KPIs belong at the bottom: total visits, page views, unique visitors, bounce rate, and traffic by source. They tell you whether people reach your site at all and where they come from. For a new online store they are the first KPIs to get right, because conversion and loyalty metrics are unreliable on very little traffic.
Advertising and sales KPIs belong in the middle. Advertising KPIs include cost per acquisition and cost per conversion for paid campaigns. Sales KPIs include number of orders, number of leads, conversion rate, average order value, and return on investment. Together they show whether the traffic you pay for turns into revenue.
Loyalty and brand KPIs belong at the top: visitor loyalty (returning visits), My Account usage, branded traffic, branded external linking, Customer Lifetime Value, and Net Promoter Score. They measure whether customers come back, recommend you, and search for you by name. They matter most for established businesses with enough customer history to measure them.
Not usefully. A store with little traffic cannot read its conversion rate with confidence, and a store that does not convert has no customers whose loyalty it can measure. You can track all tiers at once, but prioritize the lowest tier that is not yet healthy. Maslow himself described his order as flexible rather than rigid, and the same is true here: tiers overlap, but the foundation still comes first.
They explain the numbers in each tier. KPIs show what is happening, such as a falling conversion rate or fewer returning visitors, while surveys, reviews, sentiment analysis, and social media analytics show why. Feedback matters most in the top tier, where loyalty and advocacy depend on how customers feel about the brand.
User experience metrics influence every tier. Page load time and bounce rate affect whether traffic stays, click-through rate and form completion affect conversion, and user satisfaction scores affect whether customers return. Treat them as supporting metrics that explain movement in the main KPIs, and test UX changes with controlled A/B tests before rolling them out.
Find your tier before you pick your KPIs. If traffic is thin or comes from a single source, work on the base. If visitors arrive but do not buy, or paid campaigns cost more than they return, work on the middle. If you sell steadily but few customers come back, the top tier is where the growth is. Choose three to five KPIs for that tier, review them on a fixed schedule, and move up when they are stable. The goal is not to track more metrics. It is to track the metrics that match the stage your business is actually in.
Measure the top of your KPI pyramid
Nexus by Omniconvert turns your order history into RFM segments, CLV estimates, and retention views, then pushes those segments to Meta Ads, Google Ads, and Klaviyo. It draws on 248+ audit criteria and 13 years of eCommerce data across 7,000+ websites and 15+ industries.