Year-Over-Year (YoY) Growth: the Vital E-commerce Metric
Article last updated:
Article first published:
In e-commerce, Year-Over-Year (YoY) growth is a key performance metric that measures business progress by comparing performance data from the same period in the previous year. This metric provides a clear, long-term perspective on whether a business is growing, stagnating, or declining, making it essential for strategic decision-making. YoY growth can be applied to revenue, conversion rates, average order value (AOV), or customer lifetime value (CLV), allowing businesses to track trends, assess market position, and align strategies with long-term objectives. Particularly valuable for companies with at least two years of data, YoY analysis helps e-commerce brands evaluate seasonal trends, optimize marketing efforts, and sustain growth in a competitive landscape.
Key Takeaways
- Crucial Metric: YoY growth is vital for monitoring e-commerce performance, comparing current achievements to the same period in the previous year.
- Versatility: It measures various metrics like revenue and conversion rates, helping align strategies with long-term goals.
- Simple Calculation: The YoY growth formula, Revenue𝑡−1/Revenue𝑡 Revenue −1/Revenue t, is straightforward and can be computed using tools like Google Analytics.
- Industry Relevance: Useful across different sectors such as healthcare, manufacturing, and logistics for measuring efficiency and effectiveness.
- Alternative Measurements: Other metrics like MTD, QTD, and MoM provide additional insights into short-term trends and fluctuations.
- Strategic Decision-Making: Analyzing YoY growth helps identify improvement areas and refine business strategies.
Exploring the Dynamics of Year-Over-Year Growth
Year-over-year growth is an indispensable metric in the e-commerce industry, providing a clear lens through which to view your company’s performance over time. This metric is particularly relevant for businesses that have been operational for at least two years, as it requires historical data for comparison.
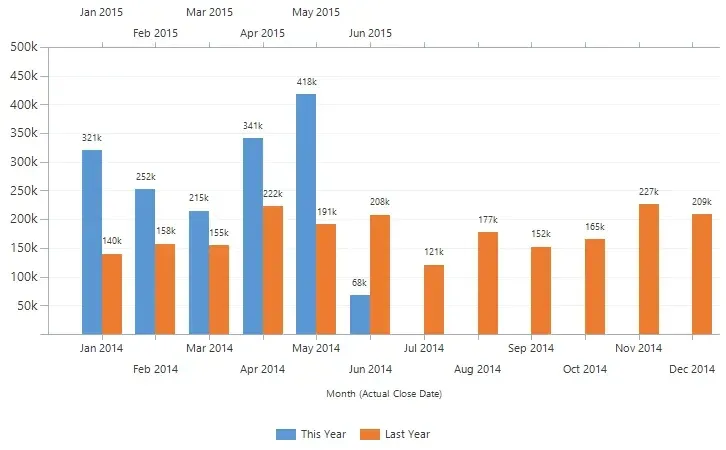
The accompanying chart illustrates this metric in action, showing monthly revenue comparisons between two consecutive years. Such visualizations highlight not only the peaks and troughs but also the overall momentum of business activities across comparable periods.
By measuring the performance of a given period against the same period in the prior year, year-over-year growth helps you determine whether your business is experiencing growth, facing a decline, or remaining stable.
This key performance indicator is incredibly versatile, supporting comparisons across various business metrics such as revenue, conversion rate, and average order value. By aligning this data with your company's annual goals, you can gain deep insights into your business's trajectory and make informed decisions.
For example, the chart clearly shows significant increases in March and June, suggesting seasonal peaks or successful marketing campaigns that might be replicated or further optimized.
To simplify understanding, consider the example of revenue: the year-over-year calculation will show how this crucial metric has evolved from one year to the next, revealing trends that are vital for strategic planning.
As depicted in the image, certain months show pronounced growth or decline, offering actionable insights into when and how to bolster marketing efforts or address potential sales bottlenecks.
Deciphering the Year-Over-Year (YoY) Growth Formula

The formula to calculate Year-over-Year (YoY) growth is straightforward yet powerful in its ability to unveil significant business insights. Represented as Revenue(t-1) / Revenue(t), where "t" stands for the current year and "t-1" represents the previous year, this formula effectively illustrates the percentage change in key business metrics over a year.
By applying this formula, you can analyze variations in
- Revenue: Tracks the increase or decrease in total sales.
- Conversion Rate: Indicates changes in the effectiveness of your sales and marketing strategies.
- Average Order Value: Helps understand shifts in consumer spending behavior.
- Customer Lifetime Value: Offers insights into the long-term value of customer relationships.
Each of these metrics can provide a different perspective on your business's health and trajectory, making the YoY growth formula an essential tool for any e-commerce business looking to measure its performance accurately over time.
How to calculate YoY?
YoY is very useful for a general overview of your company’s performance. It will not give you a detailed analysis of the specific things that positively or negatively impact your business. It can be easily calculated with Web Analytics tools by reporting the previous year's revenues or any other metrics that matter for the analysis (t-1) to the current values of the chosen metrics to analyze(t).
For example, you can use Google Analytics to compare the conversion rate on your website, from the same period, in a different year. In the following example, you will see how the newsletter subscription has changed year over year:
You can see that from November 1-2013 to March 1-2014 there was a lower number of newsletter subscriptions than the previous year. In November 2012 there were 600 new subscriptions, while in November 2013 there were fewer than 300.
Furthermore, Google Analytics gives you the exact numbers so you can see the difference. In this case, the result is upsetting: 241 subscriptions between Nov 1,2013-Mar 1, 2014 vs. 1319 subscriptions between Nov 1,2012-Mar 1,2013, with a downgrading difference of 81,73%.
Having the results on the table, you can start investigating why you have a negative score. Doing the research, investigating, and analyzing your situation can help you find out the problems and come up with the right solution.
Diverse Applications of YoY Growth Across Industries

While Year-over-Year (YoY) growth is a cornerstone metric in retail, its utility extends far beyond, serving as a critical measure in various other sectors. These examples illustrate the broad applicability and significance of YoY growth in different industries
- Healthcare: In healthcare, tracking YoY changes is essential for assessing the impact of new policies or practices. By comparing metrics such as the number of patients served or the cost per patient year-over-year, healthcare providers can gauge the effectiveness of new treatments or operational changes, ensuring they deliver improved patient care efficiently.
- Manufacturing: The manufacturing sector relies heavily on the efficiency of its production lines. Analyzing YoY growth in manufacturing rates helps in understanding the effectiveness of processes and machinery over time. This analysis is crucial for optimizing production workflows and aligning them with market demands, particularly in anticipating seasonal fluctuations and strategizing for long-term challenges and opportunities.
- Logistics: For logistics companies, where success is measured by delivery efficiency and the volume of items shipped, YoY growth metrics are indispensable. Tracking these metrics over time assesses whether a company maintains its efficiency and identifies performance declines. This ongoing analysis is vital for pinpointing potential areas for operational streamlining and enhancing overall service delivery.
Exploring Time-Series Measurements Beyond Year-Over-Year Growth
While Year-over-Year (YoY) growth provides valuable insights into your business's performance, other time-series metrics can also offer critical perspectives. Consider integrating the following measurements for a more comprehensive analysis:
- Month to Date (MTD): This metric tracks a Key Performance Indicator (KPI) from the start of the current month up to, but not including, today’s date. MTD is particularly useful for monitoring short-term trends or the immediate impact of marketing campaigns.
- Quarter to Date (QTD): Similar to MTD, QTD measures a KPI from the beginning of the current quarter to the present day, excluding today. This metric helps in understanding performance in a slightly longer frame, providing insight into quarterly trends and strategic adjustments.
- Month over Month (MoM): MoM compares this month's total metrics, such as sales or user engagement, with the previous month’s figures. This measurement is essential for identifying monthly growth patterns and fluctuations, which can be pivotal for seasonal businesses or those experiencing rapid changes.
Frequently Asked Questions
What are the limitations of using YoY growth as a metric?
While YoY growth offers valuable insights into long-term trends, it may not capture short-term fluctuations or seasonal variations effectively. This metric can also be influenced by one-off events, such as a significant sale or a market anomaly, which might skew the understanding of underlying trends.
Can YoY growth be negative, and what does that indicate?
Yes, YoY growth can be negative, which indicates that the metric being measured, such as revenue or customer engagement, has declined over the past year. This could signal issues that need addressing, such as decreased market demand, increased competition, or internal operational inefficiencies.
How do external factors influence YoY growth calculations?
External factors such as economic downturns, changes in consumer behavior, regulatory changes, and market disruptions can significantly affect YoY growth. It's crucial to consider these factors when analyzing YoY figures to ensure a comprehensive understanding of the business landscape.
Is YoY growth applicable to all types of businesses?
While YoY growth is a versatile and widely used metric, its applicability can vary depending on the business type and industry. For new businesses with less than two years of data, or for industries with rapid innovation cycles, other metrics like Month-over-Month (MoM) might be more appropriate to track progress and performance.
How can businesses improve their YoY growth?
Improving YoY growth involves enhancing the underlying business processes that contribute to the measured metrics. This could include optimizing marketing strategies, improving customer service, innovating product offerings, streamlining operations, or expanding into new markets. Regularly reviewing and adjusting business strategies based on detailed analytics and market feedback is essential for sustained improvement in YoY growth.


If you liked this article, make it shine on your page :)