Taplytics alternative (2026): Feature flags vs Shopify CRO
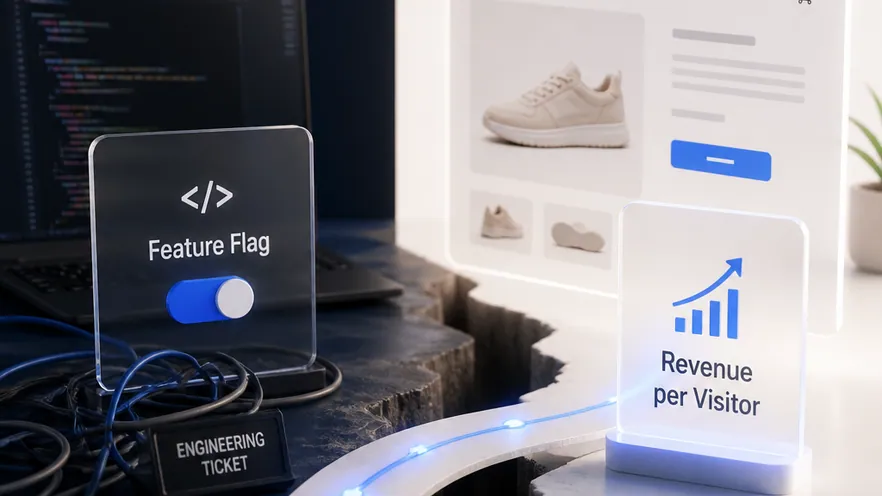
Taplytics is a product experimentation platform pairing A/B testing with feature flags across web and mobile, built for product and engineering teams. Omniconvert Explore is a Shopify-native CRO platform for product, cart, and checkout tests, measured in revenue per visitor and order rate. Different jobs; teams occasionally run both, rarely against the same surface.
- Taplytics is a product experimentation platform combining A/B testing, feature flags, and product analytics for web and mobile, rated 4.4 out of 5 on G2 across 15 reviews. [G2, 2026]
- Taplytics pairs client-side and server-side experiments with a visual editor, so engineers ship feature flags while non-technical teammates build web variants.
- Taplytics has a thin review base, no native Shopify integration, no multivariate testing, and no revenue-per-visitor or order-value reporting.
- Omniconvert Explore runs experiments on Shopify product, cart, and checkout pages without an engineering ticket for every test, and measures results in revenue per visitor.
- The two rarely compete: many brands run Taplytics on the app and feature-flag layer, and Explore on the Shopify storefront in parallel.
Teams comparing Taplytics vs Omniconvert Explore are usually asking two different questions dressed as one. Taplytics is an A/B testing and feature flag platform for product and engineering teams shipping features across web and mobile. Omniconvert Explore is a Shopify-native CRO platform that runs experiments on product, cart, and checkout and measures the outcome in revenue per visitor. This page explains where each fits, and where they never really compete.
What is Taplytics, and what does it actually do?
Taplytics is an experimentation platform combining A/B testing, feature flags, and product analytics for web and mobile. It supports client-side and server-side experiments, and lets non-technical teammates build web tests through a visual editor while engineers ship the same experiment as a feature flag. [Taplytics, 2026]
Taplytics is rated 4.4 out of 5 on G2 across 15 reviews. [G2, 2026] That is a thin review base next to the incumbent A/B testing platforms, but reviewers consistently rate its customer service and roadmap direction above the larger competitors they migrated from.
The category Taplytics sits in is product experimentation and feature management. Experiments are defined against feature flags, exposures fire from web and mobile SDKs, and the platform lets a product team ship a flag, run a test on the same flag, and hold the winning variant behind that toggle without maintaining two systems.
The question this page answers is narrower: is feature-flag experimentation for product teams the same job as running conversion experiments on a Shopify store? And if not, where is the gap?
Feature-flag experimentation means every experiment is a toggle in code: engineers wrap a new feature behind a flag, the platform splits traffic on that flag, and the winning variant stays behind the same toggle for release. It is powerful for product and engineering teams shipping features across web and mobile. It is a separate concern from whether a marketer can launch a Shopify product page test through a visual editor and measure the result in store revenue.
Where Taplytics is genuinely strong
- Client-side and server-side in one platform: the same experiment can run through the visual editor on a web page or through the server-side SDK on a mobile app or API surface, with shared assignment logic.
- Visual editor for non-technical teammates: marketers and product managers can build web variants without waiting on an engineering ticket, while engineers own the SDK layer.
- Feature flags and A/B testing on one control surface: a product team can ship a flag, run a test on the same flag, and gate the release on the winning variant without a second tool.
- Customer service reviewers rate at 9.7: a common thread in G2 write-ups is that support and roadmap responsiveness are the reason teams chose Taplytics over larger, better-known platforms.
Where Taplytics hits its ceiling for an eCommerce store
- Thin evidence base: 15 G2 reviews is a fraction of the case-study weight behind the enterprise A/B testing platforms, so a Shopify buyer has less independent signal to lean on. [G2, 2026]
- Built mobile-first for product teams: the product's centre of gravity is a feature-flag SDK, not a Shopify storefront, so experiments are framed around feature engagement rather than store revenue.
- No native Shopify integration: product page, cart, and checkout tests require custom SDK integration against the Shopify catalog and checkout flow, not a native app.
- No multivariate testing: classic A/B is supported, but full MVT designs across multiple variables in parallel are not.
- No revenue-per-visitor or order-value reporting: outcomes are framed as feature engagement and flag exposures, not revenue per visitor, order rate, or checkout progression.
- Quote-based pricing shaped for product orgs: contact sales, no listed price for a store, sized against feature-flag seats rather than store sessions.
None of this makes Taplytics a weak product. It makes it a product-team tool. The friction shows up specifically when the site under test is a Shopify store and the team running experiments cares about revenue per visitor, checkout progression, and native storefront integration rather than feature-flag mechanics.
What Taplytics cannot do for an eCommerce store
Taplytics experiments on product features rather than store revenue. It has no concept of revenue per visitor, order value, or checkout funnel, so an eCommerce team can run a valid test and still not see whether the win made the store money. That is the gap an eCommerce-first platform closes.
Omniconvert Explore is built for the layer Taplytics leaves open. Taplytics can flag any feature and run a clean A/B on its exposure, but a store does not need every experiment framed as a feature toggle; it needs the product page, the cart, and the checkout tested, and the result expressed in revenue per visitor and order rate. Those are not the same task.
Most feature-flag experimentation tools are built around a generic app screen and a generic exposure event. They optimise the mechanics of a release. They are not built around the surfaces where eCommerce revenue is actually won or lost, or around the metric that matters to a store: revenue per visitor, not feature engagement.
eCommerce CRO is the practice of running controlled experiments on the revenue surfaces of an online store, product pages, cart, and checkout, and measuring the result in revenue per visitor and order rate rather than generic conversion rate. Omniconvert Explore is defined as an eCommerce conversion rate optimization platform for product, cart, and checkout experiments, native to Shopify and priced for store traffic.
What Taplytics cannot tell an eCommerce team
- Did the win move revenue. Whether a winning variant actually raised revenue per visitor and order rate, not just a feature-flag exposure event.
- Which surface to test first. Which pages in the Shopify funnel (product, cart, checkout) carry the highest revenue impact if tested next.
- How it behaves in checkout. How an experiment interacts with the Shopify catalog, variants, and checkout flow natively, without SDK plumbing on every page.
- Whether it holds for valuable customers. Whether the result holds for repeat, high-value customers, the Customer Value Optimization question, not just first-session traffic.
Across the 7,000+ eCommerce websites in Omniconvert's CROBenchmark Report 2026, stores that route storefront experiments through a feature-flag SDK ship materially fewer tests per quarter than peers running native storefront tools, because every product page or checkout hypothesis waits on an engineering ticket to wrap the change in a flag. [CROBenchmark Report 2026, Omniconvert]
Explore runs the experiment on the store's real revenue surfaces and reports the outcome in revenue per visitor. AliveCor used Explore to run a structured A/B testing program and achieved +21% conversion rate, +5% revenue per visitor, and 94% statistical relevance across their experiments. [Omniconvert, AliveCor case study]
Taplytics vs Explore: the capability comparison
Side by side, Taplytics and Explore aim at different jobs. Taplytics pairs A/B testing with feature flags across web and mobile through a visual editor and server-side SDK, built for product teams. Explore runs Shopify-native experiments on product, cart, and checkout, adds surveys and overlays, and reports outcomes in revenue per visitor.
| Capability | Taplytics | Omniconvert Explore |
|---|---|---|
| Primary function | A/B testing and feature-flag experimentation for product teams across web and mobile | eCommerce CRO on product, cart, and checkout pages |
| A/B testing | Yes client-side and server-side via SDK and visual editor | Yes visual editor plus code editor |
| Multivariate testing | No | Yes |
| Server-side testing | Yes | Yes |
| Visual editor | Yes for web variants; mobile still requires SDK work | Yes no developer required for storefront tests |
| On-site surveys and overlays | No not part of the product | Yes surveys and overlays built in |
| Shopify integration | Low no native app; engineering integration required | Yes native |
| eCommerce focus | Low built for product and engineering teams, not stores | High built for store revenue workflows |
| Pricing model | Quote-based, contact sales, free trial available | Session-based, built for store traffic, free trial |
| Best for | Product and engineering teams running experiments across mobile apps and web with feature flags | Shopify and eCommerce teams optimizing product, cart, and checkout for revenue |
| User rating | 4.4 out of 5 (G2, 15 reviews, as of 2026) | 4.6 out of 5 (G2, 191 reviews, as of 2026) |
Competitor pricing and plan details reflect publicly listed figures as of 2026 and can change. Explore uses session-based pricing; see the Omniconvert pricing page for current plans.
Get the full CROBenchmark data behind these stats: 7,000+ websites, 15+ industries, 248+ audit criteria, 100+ CRO experts. See exactly where eCommerce growth teams are losing margin in 2026.
Get the CROBenchmark ReportFrequently Asked Questions
Should you choose Explore over Taplytics?
If your experiments run on a Shopify storefront and you need marketers to launch product page, cart, and checkout tests without SDK work, choose Explore: visual editor, native Shopify integration, and revenue per visitor as the outcome metric. If your product team wants A/B testing and feature flags on one platform across web and mobile apps, Taplytics is a fit. The two rarely overlap; many brands run Taplytics on the app and Explore on the store.
Taplytics earns its place with product and engineering teams. Its feature-flag plus A/B combo, server-side support, and the customer-service reputation reviewers keep flagging are exactly what a team shipping features across web and mobile wants from an experimentation platform.
The question for a store is narrower: are the experiments that move revenue running natively on the product, cart, and checkout pages, without an engineering ticket to wrap every change in a flag, and are they measured in revenue per visitor. That is the surface Explore is built for.
Stop guessing.
Start testing what moves revenue.
Explore runs A/B, multivariate, and personalization experiments on your product pages, cart, and checkout, then measures the outcome in revenue per visitor, not just clicks.
4.6 out of 5 across 191 reviews, G2 , as of 2026