Icon.com vs Motion vs Nexus by Omniconvert (2026): Generation vs analytics vs strategy.
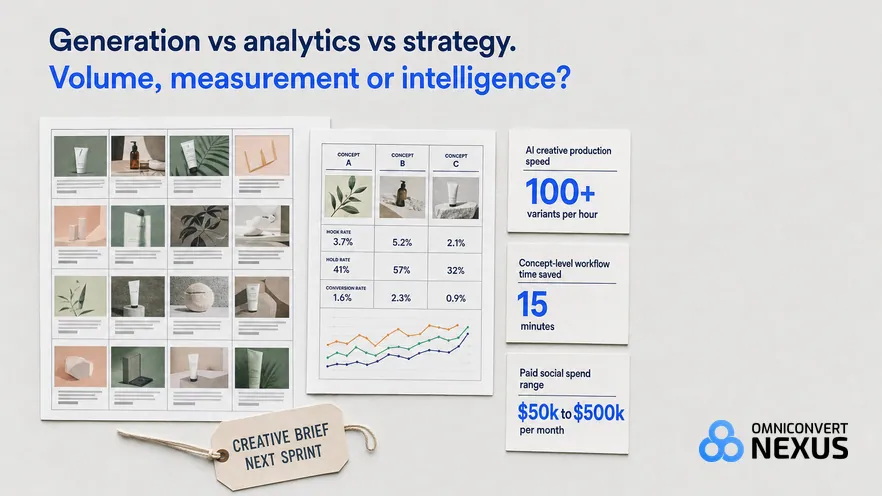
Icon.com generates AI ad creative. Motion analyses which concepts win across Meta and TikTok. Both handle execution. Neither tells you which customer segment is worth acquiring, or whether a campaign improved True Profit or just moved ROAS. Nexus by Omniconvert builds that intelligence layer above both. [Omniconvert, 2026]
- Icon.com generates AI ad creative variants for performance teams whose bottleneck is production, not decisioning.
- Motion breaks down creative performance at concept level across Meta and TikTok, so strategists see which hooks are winning without an analyst.
- Both tools share the same blind spot: neither knows which customer segment is worth acquiring, and neither tracks True Profit.
- Nexus by Omniconvert is the intelligence layer above both, ranking segments and briefing creative from CLV, NPS and review data.
- The decision framework: Icon for volume, Motion for insight, Nexus for who to speak to and whether the whole loop grew margin.
Icon.com vs Motion is the comparison performance marketers run when they're stuck between two problems: making enough ads and knowing which ones actually work. Icon.com generates AI ad creative at volume. Motion breaks down which creative concepts are winning across Meta and TikTok. Neither of them knows which customer segments to target, or whether a good-looking ROAS is actually growing the business, which is where Nexus by Omniconvert enters the picture.
What is Icon.com, and what is it actually good at?
Icon.com sits in the AI ad creative generation category. It exists to turn a small amount of input from a performance marketer into a stream of static and video ad variants ready for testing across paid channels. As a newer entrant, less third-party review data is available than for the more established analytics vendors it competes alongside.
Icon.com's category proposition is straightforward: reduce the time from creative brief to ad ready to launch. The tool takes brand inputs, product context and a hook direction, then produces multiple creative variants intended for paid social. Performance marketers reach for it when the bottleneck is volume, not decisioning.
Behind that pitch sits the standard AI creative platform stack: a generator, a set of pre-built templates or angles, and an export path that lands assets in Meta and TikTok manageable formats. The vendor's own product pages remain the authoritative source for the exact scope of the pipeline; if you are close to a purchase decision, treat icon.com as the primary reference over any third-party summary of it.
Where Icon.com is genuinely strong
- Speed from brief to variant. An AI generator that starts from a hook direction removes hours of manual production per week from the creative sprint.
- Ad-native output. The tool ships assets in the aspect ratios and formats Meta and TikTok expect, so there is less last-mile work before launch.
Where Icon.com hits its ceiling
- No CLV or customer intelligence layer. The generator does not know which of your customer segments are worth acquiring more of, so the brief it works from is only as targeted as the human writing it.
- No decision layer. Icon produces creative. It does not tell you which of your current campaigns is at risk, which segment is 60 days from churn, or whether last month's ROAS lift held up at margin level.
Icon.com does not carry a public G2 profile with an aggregate rating at time of writing. Rely on the vendor's own case studies and direct trial rather than third-party review counts for evaluation.
What is Motion, and what is it actually good at?
Motion is a creative analytics platform for paid social. It connects to Meta and TikTok ad accounts and reports which concepts, hooks and angles are producing the strongest performance, cutting the data at concept level rather than at individual-ad level.
The bet Motion makes is that most performance teams have plenty of numbers already, but the numbers are pitched too low. A table of individual ads, each with its own ROAS and hook rate, tells you nothing about what an entire creative angle is doing. Motion aggregates ads back up to the concept they came from, then shows how each concept is trending week over week across channels.
The workflow this enables is specific. A creative strategist opens Motion on Monday, sees which three concepts held their hook rate above the account benchmark last week, and briefs new variants on those angles for the next sprint. That decision used to take a spreadsheet, a query, and half a day; in Motion it takes fifteen minutes.
Where Motion is genuinely strong
- Concept-level performance breakdown. Hook rate, hold rate and conversion tracked at the level a strategist thinks about creative, not at the individual-ad level.
- Direct Meta and TikTok connections. Data lands without an intermediate ETL layer, so what you see reflects the ad account rather than a stale export.
- Usable by non-analysts. Dashboards designed for creative strategists to read on their own, without an analyst standing beside them.
Where Motion hits its ceiling
- Analytics only, no action layer. Motion shows what happened. It does not decide what to do next, and it does not produce a brief or a variant.
- No creative generation. The tool identifies the winning concept; the team still writes the brief and produces the variant in a separate tool.
- No CLV or customer data layer. Optimises for ad-performance metrics, not for lifetime value or margin at cohort level.
Icon.com vs Motion vs Nexus: the capability comparison
Icon.com generates the creative. Motion tells you which creative worked. The third tool on this page handles the layer above both: which customer segment is worth acquiring, which angle their own reviews suggest, and whether the campaign moved True Profit or just moved ROAS.
| Capability | Icon.com | Motion | Nexus by Omniconvert |
|---|---|---|---|
| Unified commerce data | No | Partial tracks creative performance across channels, not the full commerce stack | Yes single source of truth across CLV, NPS, reviews, ads |
| AI-prioritised experiment queue | No | No | Yes ranks next best action by predicted margin lift |
| Creative generation | Yes AI ad creative variants | No | Yes 100+ variants per hour, briefed from customer data |
| True Profit tracking | No | Partial ROAS and hook rate, no margin or CLV layer | Yes net margin after CAC, COGS, returns |
| CLV and segment intelligence | No | No | Yes RFM, cohorts, churn prediction |
| Autonomous action layer | No | No | Yes removes the human middleware step |
| AI creative briefing from customer data | No | Partial surfaces winning concepts, briefs still human-written | Yes briefs written from CLV, NPS, reviews |
| Pricing model | Vendor-quoted, see icon.com | Seat-based SaaS | Revenue-based, scaled to ARR |
| Best for | Performance teams where creative volume is the bottleneck | DTC brands spending $50k to $500k per month on paid social | eCommerce brands $1M+ ARR, margin-focused |
| Integrations | Meta · TikTok (vendor-listed, verify at icon.com) | Meta · TikTok · YouTube | Shopify · Klaviyo · Meta · Google · TikTok · GA4 · Triple Whale |
Full = capability shipped and documented. Partial = related but narrower in scope, with the limit noted in the cell. No = capability not offered by the tool.
What Icon.com and Motion cannot do
The shared blind spot: both tools assume you already know which customer to acquire and which message to test. Icon.com generates variants against that assumption. Motion measures the results of it. Neither questions whether the target itself is the right one.
Icon.com produces the creative. It does not decide who the creative should speak to. The gap is not the quality of the generation, it is the absence of a customer-intelligence layer above the brief, so the volume of variants is only as targeted as the human input that seeded them.
Motion shows you what performed. Nexus by Omniconvert decides what to do next, then executes it. The gap is not analytics depth; Motion is excellent at that. The gap is the absence of a customer intelligence layer: Motion optimises for ad performance metrics, not for which segment is worth acquiring at the highest lifetime margin.
Both Icon.com and Motion are built around a shared assumption: that you already know which customers to target and which message to use. They optimise the execution of that assumption. Neither questions it.
What neither tool can tell you:
- Which of your customers are worth acquiring more of. Based on 12-month CLV, not last-click ROAS.
- Which segments are 60 days from churn. And which message will hold them today.
- Whether the last campaign improved True Profit. Or whether it moved ROAS while margin stayed flat.
- What your highest-value customers actually respond to. Read from their own reviews, NPS scores and support tickets, not guessed at in a strategy meeting.
Nexus is built for that layer. It synthesises CLV data, NPS signals, review intelligence and competitor creative into a ranked action queue, before a brief is written or a variant produced. The optimisation target is True Profit, not ROAS.
True Profit is defined as the net margin remaining after subtracting CAC, COGS, return rates and the cost of customer acquisition from each cohort, not gross revenue or ROAS. It is what the business actually keeps. Nexus tracks this as the primary optimisation metric across all experiments.
AliveCor used Omniconvert to run a structured A/B testing programme and achieved +21% conversion rate, +5% revenue per visitor, and 94% statistical relevance across their experiments. [Omniconvert, AliveCor case study]
Which tool is right for you?
Choose Icon.com when the bottleneck is creative volume. Choose Motion when the bottleneck is knowing which creative worked. Add Nexus when the bottleneck is knowing which customer segments the creative should target in the first place, and whether the whole loop grew margin, not just ROAS.
Choose Icon.com if
- Creative production is the bottleneck. Your team ships fewer variants than the paid team wants to test, and hiring more designers is not on the table.
- A generator is enough for now. You already have a working view of which segments and angles to brief; you need the machine to produce the assets faster.
Choose Motion if
- You are spending $50k or more per month on paid social. The concept-level breakdown starts to pay for itself once the volume of tests is high enough to see patterns.
- Your team needs concept-level breakdowns, not ad-level data. Creative strategists want to see what a hook is doing across every variant, not click through each ad.
- You want a tool your creative strategists can use without an analyst. The dashboards are built for a marketer to open on Monday morning and know what to brief.
Add Nexus if
- Your team spends two or more hours a day assembling data from separate tools before making a decision. The human-middleware step is the tax you are paying for the current stack.
- You optimise paid spend without a reliable view of margin by segment. ROAS is on the dashboard; net contribution by cohort is in a spreadsheet nobody trusts.
- You want to know which experiments are worth running before dev sprints are assigned. Not after.
- ROAS looks fine but net margin is not moving quarter over quarter. That gap is the reason the intelligence layer exists.
What each tool cannot do, honestly
Every tool in this comparison has a real ceiling, and pretending otherwise is how brands end up with three subscriptions that solve two problems. Here is where each tool stops, so you can plan the stack around actual limits rather than around a pitch.
What Icon.com cannot do
- Tell you which customer to speak to. The generator works from the brief you give it; if the brief targets the wrong segment, the volume of variants makes the wrong bet louder.
- Measure whether the creative worked at margin level. Icon produces the asset; it does not tie its performance back to True Profit or lifetime value.
What Motion cannot do
- Generate the creative. Motion tells you which concept is winning; the team still writes the brief and produces the next variant in a separate tool.
- Reweight the KPI to margin. The dashboards optimise for ROAS and hook rate, not for the segment-level contribution the CFO actually cares about.
What Nexus cannot do
- Tag creative at element level, or produce concept-level analytics dashboards. That is Motion's specific strength, and Motion does it better than any generator does.
- Render AI avatars, clone voices, or shoot live footage. Nexus composes creative from the brand's existing product imagery and customer data; it does not replace an AI video studio when that studio is the specific asset you need.
- Manage bids, buy media, or traffic ads to networks. Nexus decides what to run and generates the variants; the ad platform still runs the auction.
See where your store stands against real competitors in your category and country. Ecommerce Benchmark scores six areas free: Creative & Ads, Reviews & UGC, AI Visibility, Agentic Commerce, Competitor Synthesis, and CRO.
Benchmark Your Store FreeFrequently Asked Questions
The verdict
Today, if you're spending real money on paid social, add Motion to see which concepts are winning across Meta and TikTok in the same week you launch them. Consider Icon.com when creative volume is the bottleneck, not the analytics gap. Then layer Nexus above both. It ranks which customer segments are worth acquiring at current CAC, so the creative you generate and the analytics you run point at the right buyer. [Omniconvert, 2026]
Icon.com and Motion are both capable tools in their categories. If your primary need is more creative variants ready for testing, Icon.com is the specialist. If it is knowing which concepts your existing spend is producing wins from, Motion is the tool.
The harder question is whether your team has a reliable way to know who to target, what to say to them, and whether the whole loop moved margin, not just ROAS. That is a different question, and it is what the third column on this page (Nexus) is built to answer.
Stop assembling data.
Start supervising growth.
Nexus unifies your entire eCommerce data layer, detects revenue anomalies in under 15 minutes, and generates a prioritized action queue, so your team stops being human middleware and starts running the P&L.
5.0 out of 5 across 60 reviews, Shopify App Store , as of September 2026