Conversion Funnel Analysis: How to Find and Fix Drop-Offs

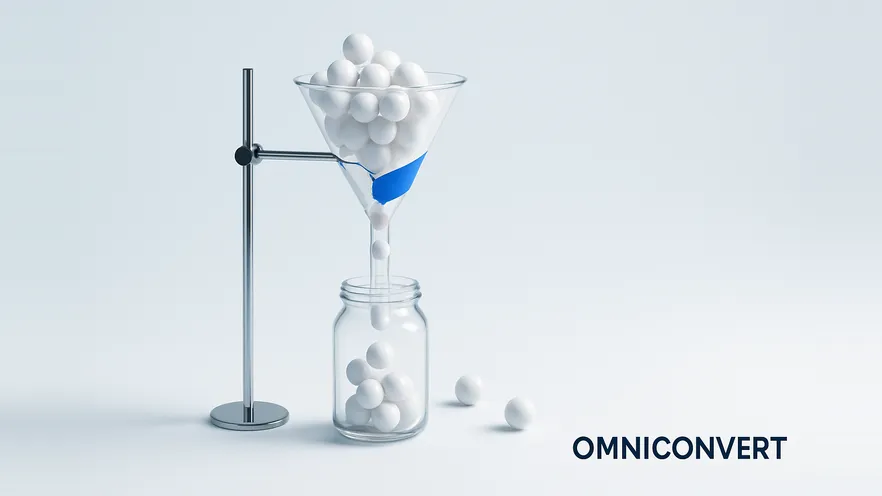
- A conversion funnel follows four stages: awareness, interest, desire and action. Funnel analysis puts a conversion rate on each move between them.
- Overall funnel conversion rate equals final-step users divided by users who entered, times 100, and it equals the product of all step conversion rates.
- The step with the highest drop-off is the first place to investigate, because small gains there have the largest effect on final conversions.
- Universal Analytics stopped processing data in 2023. In Google Analytics 4, use funnel exploration (up to 10 steps, open or closed) and path exploration.
- Funnel numbers show where users leave, not why. Heatmaps, recordings and on-site surveys explain the drop-off, and A/B tests confirm the fix.
Conversion funnel analysis is the practice of measuring how many users move from one step of a journey to the next (for example, landing page, product page, cart, checkout, purchase) and finding the step where the most people drop off. It tells you which part of the journey to fix first, so you stop trying to fix everything at once.
Picture a busy grocery store on a Saturday afternoon. You are hungry, you wander into the bread aisle, a fresh artisan loaf catches your eye, you pick it up, you imagine the toast, and you head to the checkout. You join the queue, you wait, you buy. That is a complete conversion funnel, from the first ping of hunger to the checkout lane. Online, the same journey happens in clicks, and every step loses some people.
What is conversion funnel analysis?
The funnel maps each phase of your potential customer's mindset as you try to engage and persuade them. At every stage the audience becomes smaller and more focused as it approaches conversion. The analysis puts a number on each narrowing, and the numbers tell you where to look.
Why conversion funnel analysis matters
Funnel analysis does three jobs:
- It shows where people leave. Funnel reports show which steps and channels bring a lot of visitors but also lose a lot of them without action. Finding where users leave is like patching leaks in a funnel: you keep more traffic flowing through.
- It shows where your best visitors come from. Funnels do not only find problems. Broken down by source, they reveal which channels send the traffic that completes the journey, so you can put more effort into those channels.
- It helps your team and stakeholders decide. A funnel report is a simple way to show where the online business is thriving and where it could improve. A big drop-off highlighted in red is a powerful motivator for action.
What are the stages of a conversion funnel?
To make the stages concrete, suppose you are launching a new line of organic skincare products.
Awareness stage
This is where you introduce people to your brand and capture their attention. Getting the word out about your products, website and company is the first step in building a lasting relationship with customers. For the skincare brand, that could mean social media advertising, influencer partnerships or content marketing, such as beauty creators on Instagram or Facebook showing the benefits of natural ingredients.
Interest stage
Once potential customers are on your site, you need to spark their interest. Relevant content, appealing visuals and special offers draw them in. The skincare brand could publish articles about the ingredients to avoid and the benefits of organic alternatives, show clear product images, and offer an introductory discount.
Desire stage
Here you build trust and create the desire to purchase. A personalized journey moves visitors closer to buying: recommend products based on the visitor's skin concerns, offer free samples, and show testimonials and reviews from people who have already used the products. Social proof builds credibility and confidence in the brand.
Action stage
The visitor is ready to buy. Do not lose them after all the work in the earlier stages: streamline the checkout, offer secure payment options, and give incentives such as free shipping or a satisfaction guarantee. For the checkout step itself, see our guide to shopping cart optimization.
How B2B and B2C conversion funnels differ
In B2B you sell to companies, and companies are made of people who decide together. A B2B funnel has to convince a team, address the concerns of multiple stakeholders, and survive layers of approvals, evaluations and negotiations. The sales cycle often takes weeks or months, so the analysis focuses on how leads are nurtured until the deal closes.
B2C is more straightforward. The decision is often more impulsive or emotional: consumers see the product, like it, and click "buy". The analysis focuses on making the buying process smooth, appealing to emotion, and standing out from the competition.
What does a conversion funnel look like in different businesses?
| Business type | Typical funnel steps | What to look for |
|---|---|---|
| B2B SaaS (free-to-paid) | Visit → free sign-up → first key action → regular use → paid subscription | Whether free users reach the feature that shows the product's value before they are asked to pay |
| Consumer app (e.g. a coffee order-ahead app) | Open app → browse menu → view item details → add to order → complete order | The drop between viewing menu details and completing the order |
| eCommerce | Landing page → product page → add to cart → checkout → purchase | The steps that lose the most users, split by attribution channel (social, search ads, email) |
In the coffee app example, a large drop between viewing menu details and completing orders gives the team a clear hypothesis: promote the most popular items at the top of the menu and test whether more orders get completed.
How do you calculate funnel conversion rates?
Worked example
The skincare store tracks 10,000 users who land on the site in a month (illustrative numbers):
| Step | Users | Step conversion rate | Drop-off |
|---|---|---|---|
| 1. Landing page | 10,000 | — | — |
| 2. Product page | 4,000 | 40% | 60% |
| 3. Add to cart | 800 | 20% | 80% |
| 4. Begin checkout | 400 | 50% | 50% |
| 5. Purchase | 240 | 60% | 40% |
Overall funnel conversion rate: 240 ÷ 10,000 × 100 = 2.4%. The step rates multiply to the same result: 40% × 20% × 50% × 60% = 2.4%.
The biggest leak here is product page to cart, where 80% of users drop off. That is where the analysis should dig first. A small improvement there has a large effect: if 25% of product-page visitors added to cart instead of 20%, the same funnel would produce 300 purchases instead of 240.
For the click-level view of the same journey, see how to use click-through rate to measure funnel conversion.
Which metrics should you track at each funnel stage?
| Stage | Metric | What it tells you |
|---|---|---|
| Awareness | Click-through rate (CTR), engagement rate | Whether your marketing messages capture attention and get people to move from observing to engaging |
| Interest | Bounce rate, exit rate | A high bounce rate signals a gap between what people expected and what they found; exit rates show on which page they leave |
| Desire | Add-to-cart rate, average order value (AOV) | Which products and offers create purchase intent, and where promotions or bundles can raise revenue |
| Action | Conversion rate, checkout abandonment | How effective your conversion tactics are at getting users to complete the desired action |
| After the purchase | Customer lifetime value (CLV), repeat purchase rate | Whether the funnel brings customers who come back, which guides long-term retention strategy |
Note that Google Analytics 4 reports bounce rate as the inverse of engagement rate: a session counts as engaged if it lasts longer than 10 seconds, has a key event, or has two or more page or screen views. For formulas and the full list, see our guide to CRO metrics.
How do you run a conversion funnel analysis?
-
Define the customer journey and map its touchpointsCreate a customer journey map that shows how customers move through the funnel stages, which touchpoints they meet, and how often they reach the "aha" moment. It tells you which steps to track and which ones are likely to need work. Our guide to user flows shows how to diagram the paths inside your site.
-
Set up conversion eventsTrack the macro conversion (purchase, subscription) and the micro conversions that lead to it (product view, add to cart, sign-up). Different funnel stages may need different events, based on your audience and how engaged they are at that point.
-
Build the funnel in your analytics toolIn Google Analytics 4, go to Explore and create a funnel exploration with one step per event. Choose a closed funnel if users must start at step one, or an open funnel if they can enter at any step. Use a path exploration to see the routes users actually take, forward from a starting point or backward from a purchase.
-
Segment users by source, device and conversion pointA blended funnel hides the problem. Break it down by channel, device and customer type, and group customers by the conversion points they reached (trial sign-up, first purchase, subscription). Look closely at the funnel of your best customers: what worked for them is a model to improve the funnel for everyone else.
-
Investigate the biggest drop-offThe numbers show where users leave, not why. Use heatmaps, session recordings and on-site surveys on the leaking step to find the friction points: what users expected, what confused them, and what they needed to continue.
-
Turn the friction into a hypothesis and test itWrite a hypothesis for the leak ("Showing delivery costs on the product page will increase add-to-cart rate"), run an A/B test, and measure the result on both the step rate and revenue. Then move to the next-biggest leak.
A note on Google Analytics
Older funnel guides refer to Universal Analytics goal funnels. Universal Analytics stopped processing data on July 1, 2023 (July 1, 2024 for Analytics 360 properties). In GA4, use funnel exploration, which supports up to 10 steps, open and closed funnels, standard or trended views, elapsed time between steps, and a "next action" breakdown, and path exploration for the routes between steps.
Which tools do you need for conversion funnel analysis?
-
Web analyticsGoogle Analytics 4
Tracks acquisition, engagement and key events, and builds funnel and path explorations. Probably the most common starting point for funnel analysis.
-
Behavior analyticsHeatmap tools (e.g. Hotjar, Crazy Egg)
Heatmaps, click maps and scroll maps show where users engage on a page and where friction sits, so you can improve layouts, CTAs and content placement.
-
A/B testing
Test variations of headlines, CTAs and page layouts on the leaking step, personalize by segment, and run on-site surveys to ask users what stopped them.
-
CRMCRM software (e.g. Salesforce, HubSpot, Zoho CRM)
Centralizes customer data, tracks interactions, segments audiences and nurtures leads at every stage, giving a more complete view of customer behavior. Essential for long B2B funnels.
-
Product analyticsAdvanced analytics platforms (e.g. Mixpanel, Amplitude)
Event-based tracking with cohort analysis, funnel visualization and predictive features for deeper analysis of user behavior, especially in apps and SaaS products.
How do you optimize a leaking conversion funnel?
Suppose you have run the analysis and the numbers are not what you expected. These are the practices that fix the most common leaks:
- Keep the process simple. Reduce the number of steps to buy and the effort each step takes.
- Align the landing page with the promise. If your ads promise free tomatoes, do not sell expensive ketchup on the landing page.
- Reduce cart abandonment. Be transparent about prices and delivery costs, keep the checkout simple and intuitive, and consider an exit-intent popup with a relevant incentive.
- Optimize for mobile. Make sure every step works, and is accessible, on every device.
- Personalize. Use zero- and first-party data for dynamic content and segment-specific experiences that match individual preferences.
- Re-engage users who left. Retargeting ads and email campaigns bring users back into the funnel with personalized touchpoints.
Not sure where and why prospects leave your website? Our strategists can run the analysis and the experiments for you. For CLX Gaming, a mobile homepage redesign delivered +28.57% in conversion rate and +46.21% in revenue per user (read the case study).
See Omniconvert Explore →What are the challenges in conversion funnel analysis?
Data silos and integration issues
When data is scattered across platforms, combining it into one dataset is difficult, and without a unified view of customer interactions accurate insight is hard to get. Invest in data integration tools that move data between systems. That is how you break down silos and centralize the data behind your funnel decisions.
Keeping up with changing consumer behavior
Consumer behavior changes with technology, culture and the market. Factors such as sustainability, eco-friendly delivery and fair pay now play a part in consumer choices; a 2023 study in Sustainability (Šostar and Ristanović) assesses the factors that influence consumer behavior. Stay agile: monitor behavior continuously, use analytics to track emerging trends, and adapt your marketing as they change.
Privacy and data protection regulations
You always need a balance between data-driven insight and user privacy. Comply with regulations such as GDPR and CCPA: collect data transparently, get explicit consent, secure the data, and anonymize sensitive information. Transparent privacy practices also build consumer trust.
How are AI and predictive analytics changing funnel analysis?
Machine learning models analyze historical data to anticipate customer actions, from purchase intent to churn risk, and AI-powered tools apply that to lead scoring and dynamic content, so you can adapt your strategy before users leave.
The same technologies are changing the experience inside the funnel. Conversational AI, voice search and augmented reality give brands new ways to engage people at each stage. Sephora's Virtual Artist, for example, scans the shopper's face and lets them try on makeup virtually. Add omnichannel marketing and integrated data, and you get a more complete story of customer interactions across touchpoints.
Remember the bread from the beginning? Nothing stops you from creating the same desire in your own audience. Use conversion funnel analysis to find where that desire gets lost, fix it, and build an experience that brings people back again and again.
Frequently Asked Questions
Conversion funnel analysis is the practice of measuring how many users move from one step of a journey to the next, such as landing page, product page, cart, checkout and purchase, and identifying the step where the most people drop off. It shows which part of the funnel needs attention first.
Most conversion funnels have four stages: awareness, when people discover your brand; interest, when they engage with your content and products; desire, when they build trust and want to buy; and action, when they complete the purchase or other goal. After the purchase, retention and customer lifetime value extend the funnel.
Divide the number of users who complete the final step by the number who entered the funnel, then multiply by 100. For example, 240 purchases from 10,000 users who landed on the site is a 2.4% overall funnel conversion rate. The step conversion rate uses the same formula for two consecutive steps, and the drop-off rate is 100% minus the step rate.
In GA4, open Explore and create a funnel exploration. Add one step for each event in the journey (up to 10 steps), choose an open or closed funnel, and add breakdowns such as device category or segments to compare groups. Use a path exploration to see the routes users take before or after a step. Universal Analytics goal funnels no longer exist; Universal Analytics stopped processing data in 2023.
In a closed funnel, users count only if they enter at the first step. In an open funnel, users can enter at any step. Use a closed funnel when the journey has a fixed start, such as a checkout flow, and an open funnel when users can arrive in the middle, for example on a product page from a search ad.
Match metrics to stages: click-through rate and engagement at awareness, bounce and exit rates at interest, add-to-cart rate and average order value at desire, conversion rate and checkout abandonment at action, and customer lifetime value after the purchase.
A B2B funnel sells to a group of decision makers, so it has a longer sales cycle with approvals, evaluations and negotiations, and the analysis focuses on nurturing leads over weeks or months. A B2C funnel sells to individuals whose decisions are often faster and more emotional, so the analysis focuses on a smooth buying process.
A typical stack is a web analytics platform such as Google Analytics 4 to build the funnel, a heatmap tool to see behavior on the leaking page, an A/B testing platform such as Omniconvert Explore to test fixes, a CRM to connect funnel data to customer records, and a product analytics platform such as Mixpanel or Amplitude for apps and SaaS.
Build one funnel for your main conversion goal this week, in GA4 or your analytics platform, with no more than five or six steps. Find the step with the biggest drop-off and segment it by device and channel to see whether the leak is everywhere or in one group. Watch recordings or run a short on-site survey on that step, write one hypothesis, and test it. When the fix wins, move to the next leak. A funnel you analyze and improve every month beats a perfect funnel report nobody acts on.
Fix your biggest funnel leak with Omniconvert Explore
Omniconvert Explore lets you A/B test the funnel step that loses the most users, personalize it by segment, and run on-site surveys to ask visitors what stopped them. Built on 70,000+ experiments across 7,000+ websites, with a 23.2% average uplift. Free A/B testing for up to 50,000 visitors.