23 Best Analytics Tools of 2026, by Use Case (Free and Paid)

- The best analytics tool depends on the use case: web analytics, BI, product analytics, CRO, or data science each need a different tool.
- For web analytics use Google Analytics or Adobe; for BI use Power BI, Tableau, or Looker; for product analytics use Amplitude or Mixpanel.
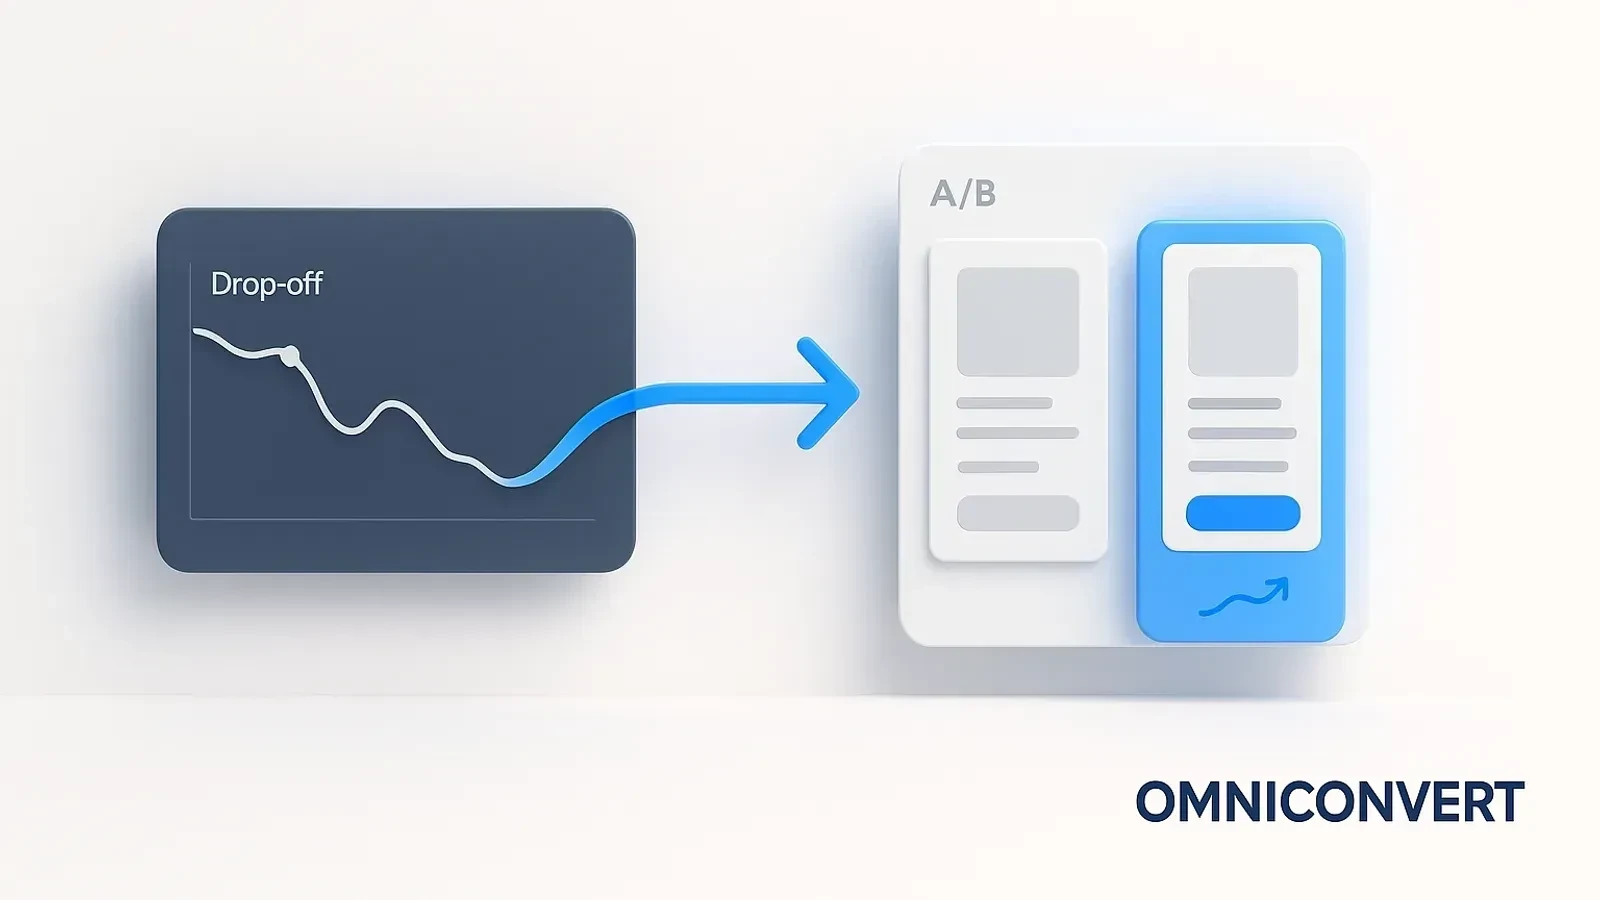
- Analytics tools diagnose what is happening. CRO platforms like Omniconvert Explore change it through A/B testing, segmentation, and surveys.
- Many strong analytics tools are free: Google Analytics, Looker Studio, Python, R, plus free A/B testing in Omniconvert Explore for up to 50,000 visitors.
- The highest-leverage setup connects analytics to experimentation: use data to find the problem, then Explore to test the fix.
Analytics tools are the software that collects, processes, and visualizes data so teams can understand what is happening in their business and why. The best one depends entirely on the job: web analytics, business intelligence, product analytics, conversion optimization, and data science each call for a different tool. Omniconvert has spent 13 years turning analytics into conversion growth across the CROBenchmark dataset of 7,000+ websites in 15+ industries [CROBenchmark Report 2026, Omniconvert].
Omniconvert Explore is the conversion rate optimization platform that turns analytics into experiments, combining A/B testing, advanced segmentation, on-site surveys, and behavioral data in one tool. This guide lists the 23 best analytics tools of 2026, but organized the way you should actually choose one: by the use case you need it for, not by a ranking that ignores what you are trying to do.
What are analytics tools?
Every analytics tool exists to shorten the distance between raw data and a decision. Where they differ is the kind of decision they serve. A web analyst, a BI team, a product manager, a CRO specialist, and a data scientist all need analytics, but they need very different tools, and forcing one tool to do every job is how stacks become expensive and underused.
How do you choose an analytics tool by use case?
The fastest way to pick is to name the question first, then the category. This table maps the five main use cases to the tools that lead them.
| Analytics category | Primary use case | Leading tools |
|---|---|---|
| Web and marketing analytics | Traffic, acquisition, attribution | Google Analytics, Adobe Experience Cloud |
| Business intelligence and visualization | Dashboards and reporting | Power BI, Tableau, Looker, Qlik |
| Product and behavioral analytics | Funnels, retention, user paths | Amplitude, Mixpanel, Hotjar |
| CRO and experimentation | Turning analytics into tested conversion lift | Omniconvert Explore |
| Statistical and data science | Modeling, machine learning, custom analysis | Python, R, SAS |
What are the 23 best analytics tools by category?
Web and digital analytics
- Google Analytics: The default for web and app analytics, covering traffic, acquisition, and behavior with GA4's event model.
- Adobe Experience Cloud: Enterprise analytics and marketing suite for large organizations with complex journeys.
- HubSpot: Marketing, CRM, and campaign analytics in one platform for inbound teams.
- Baidu Tongji: The leading web analytics tool for tracking audiences in the Chinese market.
Business intelligence and visualization
- Power BI: Microsoft's BI platform, strong for dashboards and tight Office integration.
- Tableau: Best-in-class data visualization for exploring and presenting large datasets.
- Looker: Enterprise BI with a governed modeling layer, now part of Google Cloud.
- Qlik: Associative analytics engine for flexible, self-service exploration.
- Domo: Cloud BI that combines data integration, dashboards, and apps.
- Sisense: Embedded analytics for putting dashboards inside your own products.
- Looker Studio: Google's free dashboarding tool, formerly Data Studio.
Product and behavioral analytics
- Amplitude: Deep product analytics for funnels, retention, and user-path analysis.
- Mixpanel: Event-based product analytics focused on conversion and engagement.
- Hotjar: Behavioral analytics with heatmaps and session recordings to show how users interact.
- Nexus by Omniconvert: Customer intelligence for eCommerce, unifying behavioral and purchase data into RFM segments, retention, and Customer Lifetime Value rather than session-level events.
Product analytics tools like Amplitude and Mixpanel answer "what did users do in the app," but eCommerce teams also need "which customers are worth keeping and what to do next." That is a customer-data question, not a session-event one. Nexus by Omniconvert is the AI eCommerce growth engine that turns behavioral and purchase data into ranked actions, unifying RFM segments, retention, NPS, and Customer Lifetime Value so the analysis becomes a prioritized queue of work, not another dashboard.
CRO and experimentation analytics
- Omniconvert Explore: The conversion rate optimization platform that turns analytics into experiments, with A/B and multivariate testing, advanced segmentation, on-site surveys, and personalization in one place.
Statistical computing and data science
- Python: The most popular language for data analysis, machine learning, and automation.
- R: A statistical computing language built for analysis and visualization.
- SAS: Enterprise advanced analytics and predictive modeling with long-standing industry trust.
- Project Jupyter: Interactive notebooks for exploratory analysis and reproducible code.
- KNIME: Visual data-science workflows without heavy coding.
- RapidMiner: A machine-learning and data-science platform for predictive modeling.
- Apache Spark: Big-data processing engine for analytics at massive scale.
- Excel: Still the most widely used tool for quick analysis, modeling, and reporting.
Social media analytics
- Sprout Social: Social media analytics and management for tracking performance across channels.
Have the analytics but not the lift? Turn insights into tested conversion gains with Omniconvert Explore.
See Omniconvert Explore →What is the best analytics tool for CRO?
Most analytics tools share one limit for conversion work: they tell you where visitors leave but cannot run the experiment that recovers them. That is the line between analytics and CRO. Conversion rate analysis finds the leak; an experimentation platform fixes it and proves the fix with data.
| Capability | What it does for CRO |
|---|---|
| A/B and multivariate testing | Test page, copy, and checkout changes and measure conversion impact |
| Advanced segmentation | Target experiments and experiences by behavior, source, and value |
| On-site surveys | Capture the why behind the behavior the analytics shows |
| Personalization | Serve the winning experience to the right segment automatically |
| Overlays and interactions | Recover abandoning sessions with targeted prompts |
For the qualitative side of CRO analytics, pair Explore with heatmap tools and session replay tools to see exactly how visitors interact before you design the test.
Which are the best free analytics tools?
You can build a capable analytics stack without spending anything at the start:
- Google Analytics: Free web and app analytics for almost any site.
- Looker Studio: Free dashboards and reporting on top of your data sources.
- Python and R: Free, open-source languages for any custom analysis or model.
- Omniconvert Explore: Free A/B testing for up to 50,000 visitors per month, so conversion testing is not gated behind a big budget.
For a wider list of no-cost options, see our guide to free CRO tools.
What is the difference between analytics tools and CRO tools?
The distinction is the most useful idea in this whole guide. Analytics tools are descriptive: they are excellent at telling you that conversion fell on mobile checkout last week. CRO tools are interventional: they let you test a shorter checkout against the original and measure which one wins. A reporting dashboard cannot run that experiment, and an experimentation platform is wasted without the analysis that points it at the right problem. You need both, connected.
FAQ: analytics tools
The best analytics tools in 2026 depend on the use case. For web analytics, Google Analytics and Adobe Experience Cloud lead. For business intelligence, Power BI, Tableau, and Looker. For product analytics, Amplitude and Mixpanel. For conversion rate optimization, Omniconvert Explore. For data science, Python, R, and SAS. There is no single best tool, only the best tool for the question you are trying to answer.
The best free analytics tool for most websites is Google Analytics, which covers traffic, acquisition, and behavior at no cost. For free conversion analytics, Omniconvert Explore offers A/B testing on up to 50,000 visitors per month for free. Looker Studio is free for dashboards, and Python and R are free for custom analysis. The right free tool depends on whether you need reporting, testing, or modeling.
Analytics tools tell you what is happening: traffic, behavior, funnels, and trends. CRO tools help you change what happens by running experiments, segmentation, surveys, and personalization to lift conversion. Analytics is the diagnosis; CRO is the treatment. The strongest setups connect the two, using analytics to find the problem and a CRO platform like Omniconvert Explore to test and fix it.
CRO relies on a mix of analytics tools: web analytics like Google Analytics to find where visitors drop off, behavioral analytics and heatmaps like Hotjar to see how they interact, and product analytics like Amplitude or Mixpanel for funnels. The analysis then feeds an experimentation platform such as Omniconvert Explore, which turns those insights into A/B tests, segmentation, and on-site surveys that move conversion rate.
The best analytics tool for CRO is one that connects analysis to action. Omniconvert Explore is built for this: it combines A/B and multivariate testing, advanced behavioral segmentation, on-site surveys, and personalization in one platform, so you can both measure conversion problems and run the experiments that fix them. General analytics tools show the data; Explore turns it into tested conversion gains across 70,000+ experiments.
For product analytics, Amplitude and Mixpanel are the leading choices. Both specialize in event-based tracking, funnels, retention curves, and user-path analysis, which is what product and growth teams need to understand feature adoption and drop-off. Google Analytics 4 also offers event-based product analytics for teams already in the Google ecosystem. The choice usually comes down to depth of behavioral analysis versus ease of setup.
It depends on the tool. Dashboard and web analytics tools like Google Analytics, Power BI, and Tableau are designed for business users and need little or no code. Data science tools like Python, R, and SAS require programming skills. Conversion tools like Omniconvert Explore sit in between, offering a visual editor for A/B tests so marketers can run experiments without engineering, while still exposing advanced configuration for power users.
Data analysis is the process of inspecting, cleaning, transforming, and modeling data to find useful patterns, draw conclusions, and support decisions. In eCommerce and marketing, it turns raw numbers like traffic, sales, and behavior into answers about what is working and what to change. Analytics tools automate the collection and visualization, but the value comes from asking the right questions and acting on what the analysis reveals.
Stop shopping for the single best analytics tool and start from the question you need answered. If it is where visitors come from, you likely already have Google Analytics. If it is why they do not convert, you need behavioral data and, more importantly, a way to test fixes. That is the gap most analytics stacks leave open: they describe the problem but cannot run the experiment. Connect your analytics to an experimentation platform like Omniconvert Explore, run one A/B test this week on your biggest drop-off point, and turn a dashboard insight into a measured conversion gain.
Turn analytics into tested conversion gains with Explore
Omniconvert Explore combines A/B and multivariate testing, advanced segmentation, on-site surveys, and personalization in one platform, so you can measure a conversion problem and run the experiment that fixes it. Free A/B testing for up to 50,000 visitors per month. Trusted across 70,000+ experiments.