How to Choose the Right Survey Scale (12 Types Compared)

- The scale defines what the answer can say. Pick the scale from the decision you need to make, not from what looks tidy on the page.
- An odd number of points gives a neutral midpoint; an even number forces a lean. Neither is more valid, but a midpoint also collects the indifferent, the uninformed and the unwilling, and you cannot tell them apart afterwards.
- Five to seven points fits most attitude questions. Below five loses detail, above seven asks for distinctions people cannot reliably make.
- NPS is a 0-to-10 scale, not 1 to 10. Fred Reichheld defined it that way in Harvard Business Review in 2003, and changing the range breaks the promoter, passive and detractor bands.
- Label every point on a Likert scale, but label only the endpoints on a semantic differential. Mixed or uneven labelling biases the answer before the respondent reads the question.
A survey scale is the ordered set of response options a respondent chooses from, and the right one is the one that matches the answer you need. Use a Likert scale for agreement with a statement, a semantic differential scale to place something between two opposite adjectives, a numeric or star scale for a quick rating, NPS (always 0 to 10) for likelihood to recommend, and a binary scale only when the answer genuinely is yes or no.
Nothing is more frustrating than caring about a subject and being offered only "yes" and "no". The reverse is just as bad: having a simple answer and being made to write thirty words. Both are scale problems, and both are decided before a single response arrives. This article covers the twelve scales worth knowing, how many points to give them, how to label them, and how to pick one.
What a survey scale is, and why the choice matters
The scale does two jobs at once. It makes answers comparable, so a thousand opinions become a distribution you can read, chart and re-measure next quarter, whether in Excel or in a statistics package such as SPSS. And it tells the respondent what kind of answer you are asking for. A five-point agreement scale signals "give me a considered position". A single star tap signals "one second is all I need".
The second job is the one people underestimate. Words that are obvious to the person writing the survey are not always obvious to the person answering it. Neuro-Linguistic Programming (NLP) describes this as every person having their own "mind map". "Satisfied" means one thing to a researcher and another to a customer whose parcel arrived two days late but intact. Most inaccurate surveys are not badly analyzed; they are answered by people who understood the question differently from the person who wrote it. A well-chosen, well-labelled scale narrows that gap. It is the cheapest accuracy you will ever buy.
It also constrains what you can do afterwards. A binary answer can be counted but not averaged. A ranking tells you order but not distance. A five-point Likert scale is ordinal, so the honest summary is the distribution and the median, not a mean to two decimal places. Decide what the analysis has to look like before the scale is set, because no amount of work afterwards recovers detail the scale never captured.
The 12 survey scale types, compared
| Scale | What it measures | Typical format | Use it when |
|---|---|---|---|
| Likert | Strength of agreement with one statement | 5 or 7 points, every point labelled | You want a considered position on a specific claim |
| Semantic differential | Position between two opposite adjectives | 5 to 7 points, endpoints labelled only | You are measuring perception of a brand, product or price |
| Linear numeric | Level or degree of one attribute | 1-5, 1-7 or 1-10, endpoints anchored | You want a fast rating you can track over time |
| NPS | Likelihood to recommend | 0-10, fixed; 9-10 promoters, 7-8 passives, 0-6 detractors | You need a comparable loyalty benchmark after a real experience |
| Star | Overall satisfaction, in a familiar shorthand | 1-5 stars | Attention is short and the rating will be shown publicly |
| Binary | Presence or absence of one thing | Yes/no, did/did not | The answer really is two-valued, or you need a routing question |
| Pictorial / graphic | Emotional reaction, without reading | Faces or icons, usually 3 to 5 | Respondents are passing by, or may not read the survey language well |
| Matrix | The same scale applied to several items at once | Grid of items x one shared scale | You are rating a set of related attributes and want them side by side |
| Forced ranking | Order of preference, no ties allowed | Drag or number up to about 10 items | You need to know what comes first, not how much each is liked |
| Paired comparison | Preference between exactly two options | Repeated A vs B choices | You have a short list already and need a clean winner |
| Constant sum | Relative weight of each item | Allocate 100 points or 100 dollars across items | You need the size of the gaps between priorities, not just the order |
| Adjective checklist | Which associations people hold | Pick all that apply from a mixed positive and negative list | You are mapping brand perception rather than measuring one attitude |
Rating scales: measuring one thing at a time
Likert scale
The Likert scale asks the respondent to agree or disagree with a single statement, one statement at a time. Rensis Likert introduced it in 1932 in A Technique for the Measurement of Attitudes, using five points from strongly approve to strongly disapprove. Five points is still the classic form; seven is common when you want more resolution, and every point carries a written label.
Because it says "do you agree", it reads as personal, and respondents tend to answer it more carefully than a bare number. Use it when you want a considered position on a specific claim: "The delivery options were clear before I paid." Write one idea per statement, or you will not know which half of it the answer refers to. Formplus collects Likert scale examples if you want to see the variants.
Semantic differential scale
A semantic differential scale puts two opposite adjectives at the ends of a line and asks the respondent to mark a point between them: cheap to expensive, complicated to simple, cold to friendly. Charles Osgood, George Suci and Percy Tannenbaum introduced the technique in The Measurement of Meaning in 1957 to measure the connotations people attach to a concept. Only the endpoints are labelled.
Use it for perception rather than agreement. It is the right instrument when you want to know how a brand, a product page or a price feels, and when the interesting answer is a position between two poles rather than a level of one attribute.
Linear numeric scale
A linear numeric scale offers a level of something — satisfaction, effort, interest, clarity — usually 1 to 5, 1 to 7 or 1 to 10, with the endpoints anchored in words ("not at all" to "extremely"). It is a type of semantic differential scale (QuestionPro explains the format in detail). It is the workhorse of quick feedback and the basis of the standard customer experience metrics. CSAT and CES are both linear numeric scales with fixed wording.
Use it when you want a number you can track wave over wave and you do not need to know why. Keep the direction consistent across every numeric question in the survey; flipping high and low mid-survey is one of the most common sources of dirty data.
NPS (0 to 10)
The Net Promoter Score scale is a fixed 0-to-10 range, eleven points, asking how likely the respondent is to recommend you. Fred Reichheld introduced it in the 2003 Harvard Business Review article The One Number You Need to Grow, phrased "on a zero-to-ten scale". Scores of 9 and 10 are promoters, 7 and 8 are passives, and 0 through 6 are detractors.
The range is not a design choice. Running NPS as 1 to 10, or as 0 to 5, shifts the bands and makes your score incomparable with everyone else's, which removes the only real reason to use NPS instead of a plain satisfaction rating. If you want to change the scale, you want a different metric.
Star rating
A star rating is a linear numeric scale wearing a familiar costume, almost always 1 to 5. Its advantage is that no one needs the instructions. Its limitation is the same one that applies to public review scores: ratings cluster at the top and at 1, so the average moves slowly and hides a lot. Use it where the rating will also be displayed, or where a single tap is genuinely all you will get.
Binary scale
Yes or no, did or did not. A binary scale is the correct instrument when the underlying fact is two-valued ("Did you find what you were looking for?") and the wrong one whenever the honest answer is "partly". It is also useful as a routing question that decides which scale a respondent sees next.
Pictorial and graphic scales
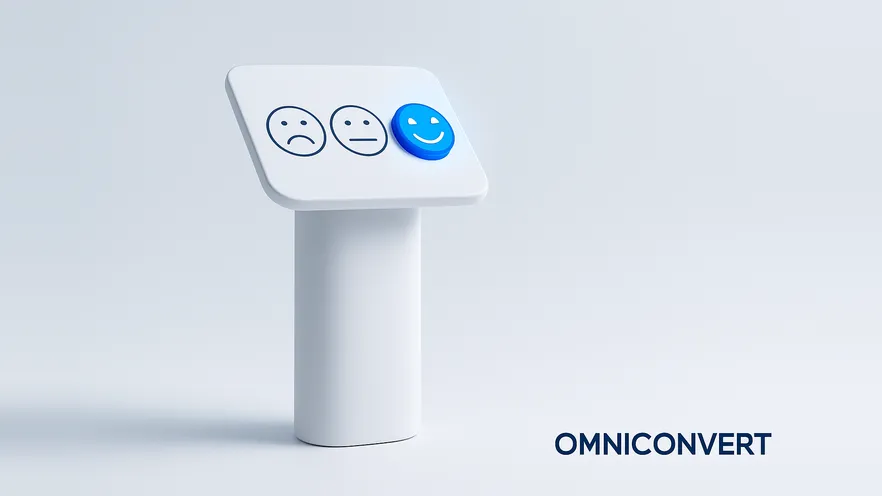
Faces, icons or colored expressions replace the words: a green smile at one end, a red frown at the other. These are the scales in airport corridors and hospital corridors, and they work for the same reason in both places. People answer them in passing, without reading, and they survive language barriers. Use them where response rate matters more than nuance, and accept that three to five levels is all they can carry.
Run NPS, CSAT, rating and open-ended surveys on-site and after purchase, targeted by segment.
See Surveys in Omniconvert Explore →Comparative and preference scales: measuring what comes first
Rating scales have a well-known failure mode: ask people to rate ten features and most of them rate eight as important. That is not a lie, it is what happens when nothing forces a trade-off. Comparative scales force one.
- Matrix scale. A grid of items sharing one scale, so several related attributes are rated side by side and stay comparable. Efficient and compact, but it turns tedious fast, so keep the row count low and never stack two matrices in a row.
- Forced ranking. Respondents order up to about ten items with no ties permitted. Stronger than individual ratings precisely because it removes the option of calling everything important. Randomize the starting order for each respondent, or the items shown first will drift to the top.
- Paired comparison. Two options at a time, repeated. Easier for the respondent than ranking a long list, and it produces a clean winner. Use it after a ranking round has already narrowed the field; used first, it can lock you into two options that were never the important ones.
- Constant sum. Respondents split 100 points, or 100 hypothetical dollars, across the items. It captures the size of the gaps that ranking flattens: first place with 60 points is a very different finding from first place with 22. Keep the list short, because the arithmetic is real work.
- Adjective checklist. A mixed list of positive and negative adjectives, from which respondents pick everything they associate with the brand or product. Not a scale in the strict sense, but it belongs here because the output is comparative. Include adjectives you would not choose yourself, randomize the order, and keep the positive and negative counts balanced.
Odd or even? How many points a scale should have
The odd-versus-even decision is about the midpoint, and it is a real trade-off rather than a best practice.
- An odd scale (3, 5, 7) has a neutral midpoint. That is honest for respondents who truly have no view, and it prevents a fabricated lean. The cost is that the midpoint becomes a catch-all: the indifferent, the uninformed and the unwilling all land on it, and afterwards you cannot tell those three groups apart.
- An even scale (4, 6) forces a side. Every respondent commits, and the results split cleanly. The cost is that people with a genuine neutral position are pushed off it, so a small artificial lean is baked into the data. Choose it when a decision needs a direction, not when you are measuring a true attitude.
If you go odd, label the midpoint honestly — "neither agree nor disagree" — and give a separate "don't know" or "not applicable" option outside the scale. That single addition is what stops the midpoint from becoming a shrug. If your survey tool cannot offer it, prefer an even scale over a midpoint that means four different things.
On length: five to seven points covers almost every attitude question. Three points is too coarse to show movement between waves. Beyond seven, respondents cannot reliably distinguish an 8 from a 9, so the extra points add noise rather than resolution and different people use different parts of the range. Fixed-format metrics are the exception and keep their defined length whatever you think of it: NPS stays at 0 to 10, star ratings stay at 1 to 5.
Labelling and wording the scale
Labels are not decoration. On a fully labelled scale the respondent is choosing a phrase, not a number, so uneven phrases skew the result. "Excellent, very good, good, fair, poor" looks balanced but is not: four of the five options sit at or above neutral. A balanced set has as many negative steps as positive ones, with steps that feel evenly spaced.
-
Match the label set to the question stemAgreement questions get agree/disagree labels. Satisfaction questions get satisfaction labels. Frequency questions get frequencies with real intervals ("weekly", not "often"). Mixing stems and labels is the most common reason answers look inconsistent.
-
Balance positive and negative optionsEqual counts on each side of the midpoint. If the negative half has fewer or milder options, the average moves up on its own and the survey flatters you.
-
Keep one direction for the whole surveyIf low is bad in question one, low is bad in question ten. Flipping polarity to "keep respondents attentive" mostly produces mistakes you cannot detect afterwards.
-
Anchor the endpoints in plain wordsOn a numeric scale, "1 = not at all likely, 10 = extremely likely" is doing the real work. A bare row of numbers means different things to different people.
-
Put "don't know" outside the scaleA no-opinion option belongs next to the scale, not inside it. Inside, it corrupts the midpoint and any average you calculate from it.
How to choose a survey scale, step by step
-
Name the decision the answer has to support"We will change the shipping copy if people find it unclear" is a decision. "We want to understand our customers" is not. A question that cannot change anything does not need a scale; it needs deleting.
-
Name the construct you are measuringAgreement, satisfaction, effort, likelihood, frequency, importance or preference. Each one has a scale family that fits it. Getting this wrong is why so many surveys measure agreement when they meant to measure priority.
-
Pick rating or comparativeIf the answer is about how much, use a rating scale. If it is about which comes first, use ranking, paired comparison or constant sum. Rating scales cannot settle a prioritization question, no matter how the results are analyzed afterwards.
-
Set the number of pointsFive to seven for attitudes. Odd if neutral is a real answer, even if you need a lean. Keep the fixed formats fixed: NPS 0 to 10, stars 1 to 5.
-
Write the labels and read them aloudBalanced, evenly spaced, one direction, endpoints anchored. If a label sounds awkward when spoken, it will be misread on screen.
-
Pilot it on a small sample before the full launchTwenty to fifty responses will show you the failure modes: everyone picking the midpoint, no one using the bottom half, a label people clearly read two ways. Fix them before the scale is locked in.
-
Freeze it for as long as you want to compareOnce responses start arriving, the scale is part of the measurement. If you must change it, close the wave and report the two periods separately rather than pooling them.
Scale mistakes that bias the answers
- Two questions in one. "The site was fast and easy to use" cannot be answered by anyone for whom only half is true. One idea per statement.
- Leading wording. "How much did you enjoy the new checkout?" has already decided that you enjoyed it. Ask neutrally and let the scale carry the direction.
- Metaphors, jargon and puns. Basic vocabulary answers faster and more accurately. A clever question is a slower question.
- Unbalanced labels. More positive options than negative ones raises the score without changing anything real.
- Too many points. An eleven-point agreement scale does not produce eleven meaningful levels. It produces five levels and some noise.
- A survey longer than it needs to be. Response quality falls as length rises, and the answers at the end are worse than the answers at the start. Cut every question that does not feed a decision.
- Asking at the wrong moment. An NPS question shown before delivery measures expectation, not experience. Timing is part of the scale design, not a separate concern.
If you want a starting point rather than a blank page, Jotform keeps a large gallery of survey templates.
Which scale to use where in the customer journey
The same question gets a different answer depending on where it is asked. Feedback at each key point of the journey is worth more than a single long survey at the end, because the respondent still remembers the specific moment you are asking about. Our guide to the four survey types for eCommerce covers the placement side in detail, and the survey questions guide covers the wording.
| Moment | Attention available | Scale that fits | What the answer is good for |
|---|---|---|---|
| On a product page | Seconds, mid-task | Binary or 1-5 numeric, one question | Finding the specific page objection to test next |
| Exit intent, before leaving | Seconds, low goodwill | Binary plus one optional open field | Naming the reason people leave without buying |
| Immediately after checkout | Short, goodwill high | CES or a 1-5 rating of the buying experience | Locating friction in the purchase flow while it is fresh |
| After delivery | Moderate, experience complete | NPS (0-10) or CSAT | Tracking loyalty and satisfaction wave over wave |
| Recruited research survey | Minutes, agreed in advance | Likert, matrix, semantic differential | Understanding attitudes and perception in depth |
| Roadmap or pricing research | Minutes, engaged respondents | Forced ranking, paired comparison, constant sum | Settling priority questions a rating scale cannot settle |
Surveys in Omniconvert Explore run these formats on-site and post-purchase, trigger them by behavior and segment, and connect the answers to the experiments that follow. That last part is the point: a scale earns its place when the answer changes something. Explore turns a survey finding into an A/B test against the same audience, so the opinion you collected gets checked against behavior.
Frequently Asked Questions
A survey scale is the ordered set of response options a respondent picks from to express how much of something they feel: agreement, satisfaction, frequency, importance or likelihood. The scale turns an opinion into a value you can count, compare across respondents and track over time. Choosing a scale is choosing what the answer can say, so the scale has to match the question.
Use an odd number of points when a genuinely neutral position is a real answer, because the midpoint gives respondents somewhere honest to sit. Use an even number, a forced-choice scale, when you want every respondent to lean one way and you accept that some will be pushed off a true neutral. Neither is more correct. The risk with an odd scale is that the midpoint collects people who are indifferent, uninformed or unwilling to answer, and you cannot tell those three apart afterwards.
Five to seven points fits most attitude questions. Fewer than five throws away detail and makes small changes invisible between waves. More than seven asks people to make distinctions they cannot reliably make, so the extra points add noise rather than precision. Fixed-format metrics are exceptions and keep their own defined length: NPS is always 0 to 10, and star ratings are almost always 1 to 5.
A Likert scale asks how strongly a respondent agrees or disagrees with a single statement, so every point carries a written label from strongly disagree to strongly agree. A semantic differential scale puts two opposite adjectives at the ends of the line, such as cheap and expensive, and only the endpoints are labelled. Likert measures the strength of a position on a statement. Semantic differential measures where a brand or product sits between two poles.
The Net Promoter Score scale is 0 to 10, giving 11 points. Fred Reichheld introduced it in the 2003 Harvard Business Review article The One Number You Need to Grow with the wording "on a zero-to-ten scale". Scores of 9 and 10 are promoters, 7 and 8 are passives, and 0 through 6 are detractors. Running it as 1 to 10 breaks the promoter, passive and detractor bands and makes the result impossible to compare with anyone else's NPS.
Label every point on a Likert scale, because the labels are what the respondent is answering. Label only the endpoints on a semantic differential or a long numeric scale, where the labels would crowd the line and the numbers already carry the order. Whichever you choose, keep the spacing of the wording even, keep the same number of positive and negative options, and never mix labelled and unlabelled points in the same question.
You can, but the responses collected before and after the change are not comparable and should not be pooled or averaged together. Changing the number of points, the wording of the labels, or the direction of the scale changes what the numbers mean. If a scale has to change, close the current wave, start a new one, and report the two separately with the change noted.
Use a short numeric or star scale on-site, where attention is scarce and a single tap is all you will get. Use NPS after delivery, once the customer has actually experienced the product. Use Likert or matrix scales in a longer post-purchase or research survey where the respondent has already agreed to spend a few minutes. Use ranking or constant-sum scales only for research questions about priorities, never as a passing on-site question.
Write down the decision the answer has to support before you choose a scale. If the decision is "which of these five features do we build first", a rating scale will not settle it and a ranking or constant-sum scale will. If the decision is "did the checkout change make people feel better about paying", a labelled five-point agreement scale will. Then keep the scale fixed for as long as you want to compare waves, label it evenly, and put it where the respondent has just had the experience you are asking about. A survey is only as accurate as the scale allows it to be, and no amount of analysis afterwards can recover detail the scale never captured.
Ask better questions on-site and after purchase
Surveys in Omniconvert Explore run NPS, rating, Likert and open questions on-site and post-purchase, target them by segment and behavior, and feed the answers straight into the A/B tests you run next. Explore has run 70,000+ experiments across 7,000+ websites and 15+ industries, with an average conversion uplift of 23.2%.