The Net Promoter Score Formula - the ultimate guide for the ultimate questions
Article last updated:
Article first published:
Take a deep dive into the math behind the magic of the NPS. Get your answers on the NPS formula, calculation methods, and NPS interpretation.
Best-selling authors Fred Reichheld and Rob Markey gave the Net Promoter Score (NPS) the title "The Ultimate Question."
In their now-famous book, the two authors argued that Net Promoter Companies Thrive in a Customer-Driven World.
Truth be told, after looking at the data from hundreds of companies spread worldwide, we're taking the same stand: the NPS is the MVP of customer satisfaction metrics, an excellent source of insights into customers' experiences, and even an indicator of employee happiness.
In this article, we dive deeply into the math behind the magic. We're not leaving any rock unturned:
- from the Net Promoter Score formula,
- to calculation methods,
- and even NPS interpretation.
What is the Net Promoter Score Formula, and How Does it Work?
Before diving into the specifics, let's quickly recap the concept of the Net Promoter Score.
The Net Promoter Score (NPS) is a metric most commonly used to measure customer satisfaction. With the NPS, you can predict the likelihood of your customers recommending you to other people.
Another usage of the NPS is measuring employee satisfaction. While not as spread as the first, this secondary employment can profoundly contribute to your employer branding and impact employee turnover.
You can survey critical points inside the customer journey to identify your Net Promoter Score. The answer to the NPS questions is your score.
> if you want to gain more knowledge about the NPS topic and how to use this metric to your advantage, check out our Ultimate Guide on NPS.
Now, the NPS formula represents the mathematical rule that helps you make sense of your NPS data.
The NPS Calculation formula means subtracting the % of detractors from the % of promoters who responded to your NPS survey.
NPS Formula = %Promoters - %Detractors
How to Calculate NPS
The way it works is no different than any other CX metric you'd like to calculate.
When measuring NPS, you need to send out a customer survey, asking your customers to answer a single question on a 1-10 scale: "how likely are you to recommend [brand]?"
After you tally all responses, apply the formula above. The result is your Net Promoter Score, calculated as a percentage.
It's good practice to measure the NPS in two critical moments in the customer journey:
- Pre-delivery
- Post-delivery
This is how you determine whether or not you stood by the principle of under-promising and over-delivering that delights customers (and keeps them loyal).
NPS calculation methods
You will find three standard methods for Net Promoter Score calculation in the customer service world:
- Using Excel (or any other spreadsheet)
An excel-type spreadsheet is easily accessible to anyone, therefore a good choice for calculating NPS.
At its core, NPS calculation with a spreadsheet means categorizing your raw NPS data (numbers between one and 10) into three types of customers: promoters, detractors, and passives.
To calculate NPS inside a spreadsheet, you need to:
- Add the Promoters (those who scored 9-10 in the survey)
- Add your Detractors (customers who scored 1-6)
- Find the % of both promoters and detractors
- Apply the NPS formula
It's a pretty straightforward process. However, it might get tedious over time, and it's more vulnerable to human error.
- Using an online NPS calculator
To cut down on manual labor, you can use an online NPS calculator and let it crunch the numbers for you. There are various options, so you can choose an NPS calculator template that best suits your needs.
Yet, NPS calculators might not be as accessible as your basic spreadsheet.
Depending on its level of sophistication, the calculator might cost you a significant amount. It's up to you to see if it's worth investing in such a tool.
On the other hand, even if you'd have to pay a subscription, NPS calculators will still save you money in labor costs. At the same time, they can free up your customer experience teams from time-consuming reporting tasks.
- Using a CRM platform with a score calculation feature
If you want more advanced options to calculate the Net Promoter Score, consider investing in an advanced CRM Platform that also calculates your NPS.
You can avoid repetitive work done through spreadsheets and documents while getting priceless customer insights.
For example, Omniconvert Reveal calculates your NPS score and allows you to analyze it from different angles:
- NPS by RFM groups
- NPS byproduct
- NPS by location
- And many more.
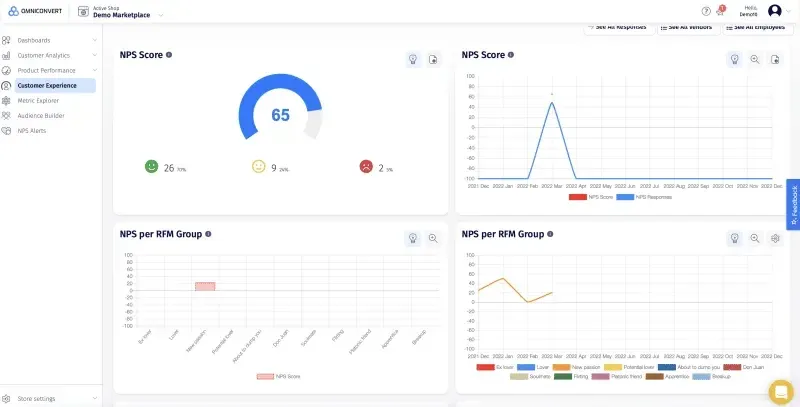
screenshot of the NPS feature inside Omniconvert's Reveal.
The main argument for using an advanced CRM platform is its sophistication. While spreadsheets and calculators shed light on your current scores, a platform helps you track changes and fluctuations in your NPS, revealing your progress in time.
At the same time, advanced software saves you time and human resources regarding data exporting or copy-pasting information.
Measuring NPS
Showing concern for customers' feelings and satisfaction takes you one step further to customer centricity.
However, even if your intentions are good, you can still get trapped on your way.
When calculating the NPS, one vital trap to avoid is the trap of average numbers. Average NPS results can prove to deceive and do more harm than good.
Keep in mind that different customer groups have various behaviors and come from diverse backgrounds. At the same time, they bought multiple products and had specific expectations for specific brand categories.
Looking at the average NPS for this mosaic might not provide the insights you were hoping for.
We suggest a more holistic approach and checking the responses up, down, and sideways.
In other words, to get the truth behind the scores and get granular feedback from your customers, look at your NPS results from multiple angles:
- Pre-delivery NPS versus post-delivery NPS
- RFM segment
- Location
- Brand
- Category
This approach allows you to target and analyze precise customer segments and tailor your strategies to their particular behavior.
There are certain advantages to granular NPS measuring:
- You can prioritize and allocate customer support resources according to the customer value: use your resources on valuable customers;
- Improve customer retention with loyalty programs and experiences tailored to the customers' voice;
- Take the necessary actions to improve Customer Lifetime Value where it makes a difference and avoid the churn of essential customers.

Like what you're reading?
Join the informed eCommerce crowd!
Stay connected to what’s hot in eCommerce. We will never bug you with irrelevant info.
Promoters in NPS calculation

The first step in finding your Net Promoter Score is asking your customers to score the likelihood of their recommendation on a 1-10 scale. According to their answers, customers will be segmented into three sub-groups.
The first sub-group consists of Promoters. In order to calculate Net Promoters' Score, you should tally up customers who scored 9 or 10 on the survey.
It's safe to assume these customers were delighted with your brand and will definitely recommend you to their communities.
While recommendations don't necessarily mean loyalty, satisfied customers will stick by your side and pick you over the competition.
With Promoters, it would be interesting to see precisely what delighted them to such an extent. You can include a follow-up, open-ended question in your NPS survey template to uncover your strong points. For example, it can look like this:
"What did you value most in your experience?"
Besides asking for more details about the experience, the main focus with Promoters is keeping the status quo and delivering stellar experiences.
An Invesp study states that "acquiring a new customer is 5x times more expensive than retaining an existing customer", which is why keeping these Promoters happy should be your main priority.

Use incentives such as vouchers, discounts, and exclusive offers to delight and reward your promoters.
At the same time, you can also nudge your customers towards leaving positive reviews on your website or your Social Media Channels.
Detractors in NPS Calculation

On the other side of the coin, you'll find your Detractors: customers who scored 1-6 on the survey.
Negative feedback or WoM from Detractors will sink your profits; whenever a customer feels mistreated, sales go down.
Instead of neglecting your customers' feelings (a cardinal sin in retail & eComm), you should:
- dig deeper
- uncover the reasons behind the scoring
- fix the issues asap.
For example, suppose your detractor belongs to the segment of your best customers. In this case, you can trigger an alert to customer service so you can find and treat the problem instantly.
The same approach should be applied to newly acquired customers with high potential: find the reasons, then solve those issues.
The silver lining with Detractors is that they can become die-hard fans once you win them over and solve their issues.
There's a thin line between love and hate, and it's not that difficult to bring detractors to the lovers' side.
It would be interesting to monitor your progress with the Detractors. Did you improve your net promoter score over time? Did they score higher on the survey?
Keep an eye on them and see how the relationship changes over time. Who knows where your next promoter might appear!
What are Passives in NPS Calculation?

Besides promoter and detractor, customers can also fall into the category of passives. Passives are customers who scored 7 or 8 on the NPS surveys.
They are neither disappointed nor excited about their experiences. These people are "meh" about your brand.
How are you going to treat them?
Evidently, it might be more important to leave them be and focus on Detractors to increase your company's NPS score.
Yet, passives should definitely appear on your radar if you have the resources and capacity.
If customers are meh about your products, they will unlikely churn. Considering the current acquisition costs, it's likely that you not only lose a customer but also spend the $ for nothing in the acquisition stage.
Passives have no issue leaving you for a competitor for a better price or more convenience. Unlike Detractors, who are passionate about your brand (even if that passion is negative), passives don't care enough to stay.
On the other hand, it's easier to bring a Passive to the Promoters' side than to change a Detractor's mind. Passives only need a little push to change their minds.
Invest your time to uncover what would have delighted them with that experience.
It could be about the price, the product assortment, or the friendliness of your staff.
If there is anything that can spark feelings from passives and it doesn't eat up your resources, do it. Indeed, it will impact the churn that your organization experiences.
Interpreting your NPS score
It's an essential business requirement to know and understand your NPS. Yet, the story doesn't end with the mere awareness of the NPS scale. It's what you do with the insights that matter.
Besides looking at the NPS benchmark inside your industry, the most basic manner of interpreting your NPS results is by looking at the positive/negative scale.
If your NPS is negative, you have more detractors than promoters. This means you have more unsatisfied customers than happy ones, and you should take measures to improve your situation.
In parallel, if your score is positive, it means people who are satisfied with your brand (promoters) outnumber those who don't.
You can also determine how many passives you have inside your customer base by subtracting the % of promoters and % of detractors from the percentage of total customer answers.
The most crucial aspect of understanding and interpreting your NPS results is understanding the why behind the answers.
To achieve this, you should follow your score-based question with an open-ended one, asking customers to explain why they gave their particular score.
- Detractors can be asked to illustrate their issues
- Promoters can be asked to highlight what delighted them
- And even Passives can give insights into what was missing from their experience
The answer to the open-ended question is called verbatim. You can categorize each answer into different groups: staff, product quality, delivery process, etc.
Each group has one code, and the verbatim answers are tagged with the codes. Depending on how many tags you'll find in a specific category, you can summarize the NPS and better understand your business.
For example, suppose most of your detractors gave answers that fall into the delivery process category.
Seeing this, you can infer the issues with your shipping partners and take the necessary measures to solve these issues and prevent further customer churn.
Wrap-up
There's a certain nostalgia in the eComm and Retail landscape. One can argue that it was better in the old days when retailers didn't struggle as much.
You compete with all other eComm & retail shops as an online retailer. Your customers can shop elsewhere unless you're not selling some DIY, unique product.
The best way of preventing that is to focus your efforts and resources on establishing strong customer relationships.
It starts with the NPS Formula. It continues with an NPS system.
It ends in Customer Loyalty.
Frequently Asked Questions about the Net Promoter Score Formula
How do you calculate the Net Promoter Score? To calculate the NPS, you must first have to send out surveys asking customers about the likelihood of them recommending your brand. Customers have to pick an answer from a 1-10 score. After you get the responses, you need to subtract the % of detractors from the % of promoters who responded to your NPS survey.
To calculate the NPS, you must first have to send out surveys asking customers about the likelihood of them recommending your brand. Customers have to pick an answer from a 1-10 score. After you get the responses, you need to subtract the % of detractors from the % of promoters who responded to your NPS survey.
What is NPS and how is it calculated? NPS stands for Net Promoter Score. This metric represents the likelihood of your customers recommending your brand. To calculate the NPS, you need to send out an NPS survey, asking customers to rate the likelihood of recommending your brand on a 1-10 scale. Then subtract the % of detractors (rates from 1-6) from the % of promoters (rates from 9-10 ) who responded to your NPS survey.
NPS stands for Net Promoter Score. This metric represents the likelihood of your customers recommending your brand. To calculate the NPS, you need to send out an NPS survey, asking customers to rate the likelihood of recommending your brand on a 1-10 scale. Then subtract the % of detractors (rates from 1-6) from the % of promoters (rates from 9-10 ) who responded to your NPS survey.
What is a good NPS score? According to the general consensus, an NPS between 0 and 30 is considered a good start. Scores between 30 and 70 are considered great and anything about 70 is considered excellent. However, these numbers are subjective and you should always look at your NPS inside the context of your location and industry.
According to the general consensus, an NPS between 0 and 30 is considered a good start. Scores between 30 and 70 are considered great and anything about 70 is considered excellent. However, these numbers are subjective and you should always look at your NPS inside the context of your location and industry.
How do you calculate NPS on 5 point scale? The 5 point scale follows the same methodology and formula as the 10 scale: percentage of promoters minus percentage of detractors. However, with fewer options, the NPS groups are updated as follows: 1-3 are detractors, 4 are passives and 5 are promoters.
The 5 point scale follows the same methodology and formula as the 10 scale: percentage of promoters minus percentage of detractors. However, with fewer options, the NPS groups are updated as follows: 1-3 are detractors, 4 are passives and 5 are promoters.


If you liked this article, make it shine on your page :)