Promoters, Passives & Detractors: NPS Explained (2026)

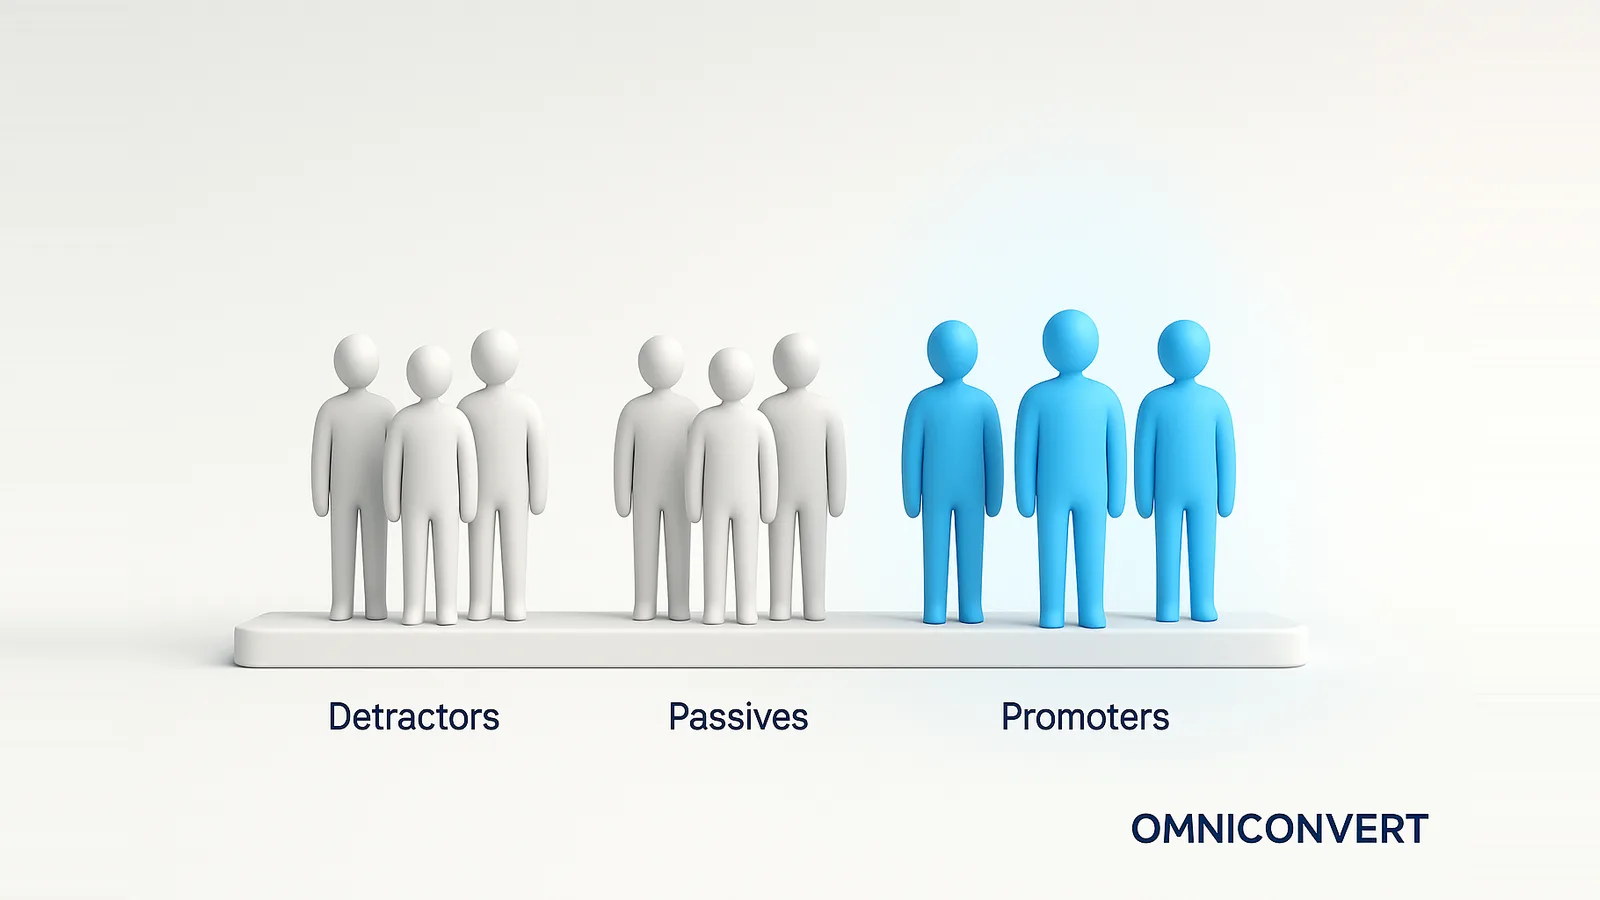
- Promoters (9-10) are loyal advocates, passives (7-8) are satisfied but unattached, and detractors (0-6) are unhappy customers and a churn risk.
- NPS equals the percentage of promoters minus the percentage of detractors, a single score from -100 to +100; passives are excluded from the math.
- A score above 0 is positive, above 50 strong, and above 70 world-class, but benchmarks vary widely by industry, so judge by your own trend.
- You raise NPS by closing the loop with detractors and converting passives into promoters; the listen, analyze, act loop, not the survey, moves the score.
- NPS is a leading indicator of growth. Nexus by Omniconvert unifies NPS with CLV and RFM segments to turn it into ranked actions.
Promoters, passives, and detractors are the three groups the Net Promoter Score (NPS) sorts customers into based on a single 0-to-10 recommendation question: promoters (9-10) are loyal advocates, passives (7-8) are satisfied but unattached, and detractors (0-6) are unhappy and a churn risk. Omniconvert has measured NPS and its link to retention and lifetime value across the CROBenchmark dataset of 7,000+ websites in 15+ industries, against 248+ audit criteria, drawing on 13 years in eCommerce conversion rate optimization [CROBenchmark Report 2026, Omniconvert].
Nexus by Omniconvert is the AI eCommerce growth engine that captures NPS and unifies it with customer and profit data, then turns it into ranked actions. This guide explains the three groups, what NPS is and how to calculate it, what counts as a good score, how benchmarks vary by industry, how to reduce detractors, and why NPS matters for growth. Every section answers the question directly, then goes deeper.
Promoters, passives, and detractors explained
The whole framework rests on one question: how likely are you to recommend us, on a scale of 0 to 10? The answer places each customer into one of three groups, and those groups are what the rest of NPS is built on.
- Promoters (9-10): Loyal, enthusiastic customers who buy again and actively recommend you. They are your cheapest growth channel, because referrals cost nothing to acquire.
- Passives (7-8): Satisfied but unenthusiastic. They are not unhappy, but they feel no loyalty and will switch for a better price or experience. They do not count toward the score.
- Detractors (0-6): Unhappy customers at risk of churning and likely to share negative experiences. They drag down the score and your reputation, which is why reducing them is the fastest way to improve NPS.
The strategic point is that the three groups call for three different actions: activate promoters for referrals and reviews, nudge passives toward promoter status, and prioritize detractors for recovery before they leave.
What is a Net Promoter Score (NPS)?
NPS became popular because it compressed customer loyalty into a single, comparable number. Fred Reichheld introduced it with Bain and Company and Satmetrix in a 2003 Harvard Business Review article titled "The One Number You Need to Grow," and the simplicity is the point: one question, one score, easy to track over time and against competitors.
That simplicity is also its limit. A single number tells you the state of loyalty but not the reason behind it, which is why NPS works best paired with a follow-up question and with other metrics. For how it compares to satisfaction and effort metrics, see NPS vs CSAT vs CES.
How to calculate NPS
The formula is deliberately simple:
| NPS = % Promoters − % Detractors |
In four steps: collect responses to the 0-to-10 question, classify each respondent into promoter, passive, or detractor, calculate promoters and detractors as a percentage of total responses, then subtract the detractor percentage from the promoter percentage. For example, if 60 percent are promoters, 30 percent passives, and 10 percent detractors, your NPS is 60 minus 10, or 50. The score ranges from -100 (every respondent a detractor) to +100 (every respondent a promoter), and it is expressed as a number, not a percentage, even though it is built from percentages.
What is a good NPS score?
As a rough universal guide:
- Below 0: More detractors than promoters. A clear signal that something is wrong and needs structured corrective action.
- 0 to 30: Positive, but with real room to improve.
- 30 to 50: Good. You have meaningfully more promoters than detractors.
- 50 to 70: Strong loyalty and a healthy referral base.
- 70+: World-class. Rare, and a powerful growth advantage.
Treat these as orientation, not targets. Because benchmarks differ so much by sector, the score that matters most is your own, measured consistently and moving in the right direction.
NPS benchmarks by industry
The table below shows what NPS tends to reflect in each major sector and the general direction of its benchmark. The tendencies are directional and based on Omniconvert's experience and published industry patterns; exact figures vary by provider and year, so confirm against a current benchmark report rather than treating these as fixed numbers.
| Industry | What NPS reflects in this sector | Benchmark tendency |
|---|---|---|
| Technology and SaaS | Onboarding quality, feature usability, support responsiveness | Higher |
| Retail and eCommerce | Buying journey, product availability, checkout and delivery | Higher to moderate |
| Automotive | Purchase experience, service center quality, brand trust | Moderate |
| Financial services | Trust, account management, transaction reliability | Lower to moderate |
| Telecommunications | Service reliability, billing clarity, support quality | Lower |
| Airlines | Booking ease, flight experience, punctuality, baggage | Lower |
The takeaway is to benchmark within your own sector, not across all of them. A score of 40 can be excellent in telecom and unremarkable in software, so a cross-industry average is, at best, loose context.
See which high-value customers are slipping toward detractor status, and which fix protects the most revenue.
Learn more about Customer Intelligence in Nexus →How to reduce detractors and improve NPS
Improving NPS is less about collecting more scores and more about acting on the ones you have:
-
Understand the root causesRead detractor comments and look for patterns. The follow-up question, why did you give that score, matters more than the number itself.
-
Close the loop with detractorsContact unhappy customers, resolve their issue, and follow up. A recovered detractor often becomes more loyal than a customer who never had a problem.
-
Fix the recurring issuesTurn the patterns in feedback into real changes to product, service, or experience, then tell customers what you changed because of them.
-
Convert passives into promotersPassives need a reason to commit. Remove friction and exceed expectations at the moments that matter, so a 7 or 8 becomes a 9 or 10.
-
Repeat the loopNPS is a trend, not a one-time reading. Run the listen, analyze, act cycle on a regular cadence so improvements compound.
This is where qualitative feedback earns its place: the score tells you whether loyalty is rising or falling, but the comments tell you what to fix. Pairing the two is what turns NPS from a report into a roadmap.
Why NPS matters for growth
The reason NPS earns its place on the growth dashboard is that loyalty precedes revenue. Promoters concentrate repeat purchases and referrals, while detractors concentrate cancellations and negative word of mouth, so the balance between them is a forward look at where revenue is heading. A score that is climbing tells you advocacy is strengthening; a score that is slipping warns of churn before it lands.
That value multiplies when NPS is connected to other customer data. On its own it is a number; tied to customer lifetime value and segments, it tells you which of your most valuable customers are turning into detractors, which is exactly the signal worth acting on first. Nexus by Omniconvert is the AI eCommerce growth engine that unifies NPS with RFM segments and CLV, then ranks the actions that protect the most revenue, so NPS becomes a trigger for action rather than a quarterly slide.
Frequently Asked Questions
Promoters, passives, and detractors are the three customer groups in Net Promoter Score, based on a 0-to-10 recommendation question. Promoters (9-10) are loyal customers who actively recommend you. Passives (7-8) are satisfied but unenthusiastic and open to competitors. Detractors (0-6) are unhappy customers who may discourage others through negative word of mouth. NPS is calculated from the percentage of promoters minus the percentage of detractors, with passives excluded from the score.
Net Promoter Score (NPS) is a customer loyalty metric that measures how likely customers are to recommend a company, product, or service on a scale of 0 to 10. Developed by Fred Reichheld with Bain and Company and introduced in a 2003 Harvard Business Review article, it produces a single score from -100 to +100. It is popular because it is simple to collect, easy to benchmark, and correlates with customer retention and business growth.
You calculate NPS by subtracting the percentage of detractors from the percentage of promoters. First, collect responses to the 0-to-10 recommendation question. Classify each as a promoter (9-10), passive (7-8), or detractor (0-6). Convert promoters and detractors into percentages of total responses, then subtract the detractor percentage from the promoter percentage. Passives count toward the total but not the subtraction. The result ranges from -100 to +100.
A good NPS score is any score above 0, since it means promoters outnumber detractors. As a rough guide, above 30 is good, above 50 is strong, and above 70 is world-class. However, benchmarks vary significantly by industry, so the same score can be excellent in one sector and average in another. The most reliable benchmark is your own score improving over time rather than a universal threshold.
You reduce detractors by closing the loop: contact unhappy customers, identify the root causes behind low scores, fix the recurring problems, and tell customers what changed. Then convert passives into promoters by removing friction and exceeding expectations at key touchpoints. NPS improves only when feedback becomes visible action, so a consistent listen, analyze, and act loop, not a one-time survey, is what raises the score over time.
Yes, NPS benchmarks vary significantly by industry. Sectors like tech, SaaS, and retail often report higher scores, while telecommunications, airlines, and financial services tend to run lower, because customer expectations and competitive intensity differ. This means a raw NPS number means little without context. Compare your score against others in your own sector, and weight your own trend over time more heavily than any cross-industry average.
NPS matters for growth because it is a leading indicator: promoters buy again and refer others at near-zero acquisition cost, while detractors churn and spread negative word of mouth. A rising NPS signals strengthening loyalty before it appears in revenue, and a falling one flags retention risk early. Linked to customer lifetime value, NPS works as an early-warning system for the health of your customer base, not just a satisfaction snapshot.
Nexus by Omniconvert is the AI eCommerce growth engine that captures NPS and unifies it with RFM segments, Customer Lifetime Value, and purchase behavior in one source of truth, then turns it into ranked actions. Instead of reading NPS in isolation, teams see which high-value segments are becoming detractors, which are promoters worth activating for referrals, and which fix protects the most revenue, so NPS drives action rather than just reporting.
Send the one-question NPS survey this week if you are not already, but do not stop at the number. The score itself changes nothing; what changes your business is what you do with the detractors. Pull every detractor response, read the comments, and find the one recurring complaint that costs you the most loyalty. Fix it, then go back and tell those customers you fixed it. That single closed loop will teach you more than any benchmark, and it is the habit that quietly turns detractors into promoters over time.
Turn NPS into ranked actions with Nexus
Nexus by Omniconvert captures NPS and unifies it with RFM segments, Customer Lifetime Value, and purchase behavior, then shows which high-value customers are becoming detractors and which fix protects the most revenue. NPS that drives action, not just a dashboard.