RFM Segmentation Tool: What It Does and How to Use It

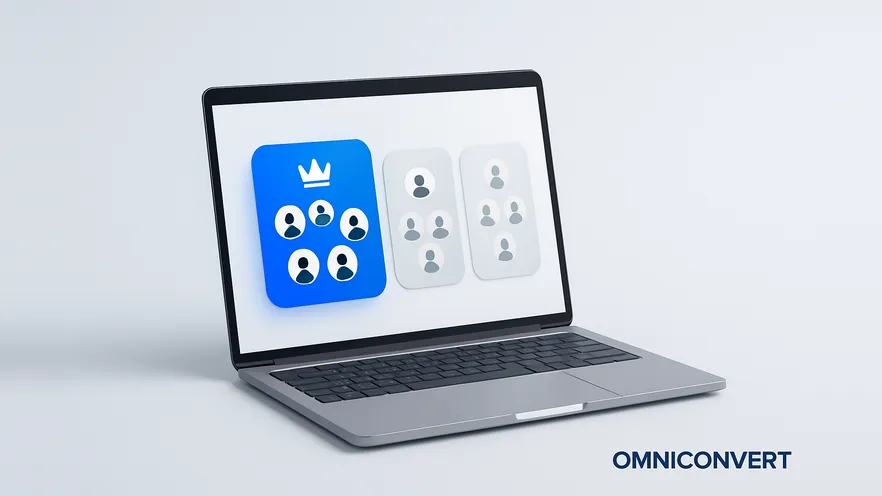
- An RFM segmentation tool scores customers on recency, frequency and monetary value and groups them into segments automatically, so the segments stay current without spreadsheet work.
- Customer value is not only revenue: add acquisition costs and retention costs, such as loyalty programs and discounts, to see which segments are profitable.
- Nexus by Omniconvert uses six RFM segments: Soulmates, Loyal, New, Promising, About-to-Dump and Breakups, each with a clear action and CLV implication.
- The revenue versus margin report per segment is the first report to read; top customers, returns, buying habits, CLV, NPS, retention and cohorts explain why the best segments behave as they do.
- Nexus by Omniconvert pushes RFM segments directly to Meta Ads, Google Ads and Klaviyo, so campaigns use current segments instead of a weekly export.
An RFM segmentation tool scores every customer on recency, frequency and monetary value, then groups customers with similar scores into segments you can act on. It does automatically what most teams try to do in a spreadsheet, and it keeps the segments current as customers buy again or drift away.
When a new eCommerce client approaches us for a service like LTV or retention optimization, we typically start by asking whether they do RFM segmentation, or what type of customer segmentation they use. Most medium and large web shops have some segments defined in their CRM and use them for paid ads and targeted email campaigns. However, many of them do not know how to segment their customer base in a way that turns all the collected data into actionable insights.
For this reason, our CLV optimization framework includes RFM customer segmentation, and we run it in a tool, to save time and to have all the insights available immediately. Below, we explain how the segmentation works, which segments and reports matter, and how to use the RFM groups to make better marketing and assortment decisions. For the method itself, see our RFM segmentation guide and how to calculate an RFM score.
What does an RFM segmentation tool do?
The purpose of RFM analysis is to help you understand which customers, products or services are dragging your business down and which ones fuel growth, or can. A spreadsheet can answer that question once. A tool answers it every day, because it recalculates the scores as new orders arrive.
A complete RFM tool for eCommerce analyzes customer, product and order data around two anchors, customer acquisition cost (CAC) and RFM scores, and gives you insight into:
- Net Promoter Score (NPS)
- Retention rate
- Product return rate
- Gross margin per customer type
- Cohorts
- Customer lifetime value (CLV)
How are RFM customer segments set up?
RFM segmentation identifies your most valuable client groups and lets you target clusters of customers that share behavior patterns. The insights improve the targeting of paid ads and marketing campaigns, and help you design personalized loyalty programs. Together, these attract more profitable customers, who stay longer and are worth more over time.
RFM stands for:
- Recency: how recently did the customer purchase?
- Frequency: how often do they purchase?
- Monetary value: how much do they spend?
To estimate a client's lifetime value accurately, you need more than the revenue and profit that customer generates. You also need your acquisition costs: the sum of all marketing and sales efforts needed to acquire a new customer in a given period. Add your retention costs too, if you spend on loyalty programs or discounts. Without them, a segment that buys a lot but only with a coupon looks better than it is.
The scoring then runs in three steps:
- Score. The system assigns points for recency, frequency and monetary value to each customer, based on their order history.
- Group. Customers who share similar RFM values are grouped into clusters, which become the named segments.
- Calibrate. You change the values and intervals of the R, F and M scales to match your business model. A furniture store and a coffee subscription do not have the same "recent" or "frequent".
For a deeper look at the scoring logic, see how the RFM model works.
What are the RFM customer segments in Nexus?
| Segment | RFM profile | What to do |
|---|---|---|
| Soulmates | High R, high F, high M. Your best customers: they buy often, spend the most, and bought recently. | Loyalty program, VIP retention, lookalike acquisition on Meta. |
| Loyal | High F, strong M, moderate R. Consistent repeat buyers who have not purchased as recently. | Re-engagement campaign; cross-sell to raise the M score. |
| New | High R, low F, variable M. They just bought for the first time. | Onboarding sequence and a second-purchase trigger. |
| Promising | Strong early signals, but not yet consistent: growing frequency or recent high spend. | Encourage a third order; introduce a subscription or bundle. |
| About-to-Dump | Previously active, now declining. Recency is dropping, but they have not left yet. | Win-back flow, personalized offer by CLV tier, NPS survey. |
| Breakups | Low R, declining F, no recent purchase. They have stopped buying. | High-CLV: win-back campaign. Low-CLV: exclude from acquisition audiences. |
The segment names are deliberately human. A marketer remembers "About-to-Dump" better than "R1 F3 M3", and the name already suggests the action. The older Reveal model used a finer split into 11 segments; the six Nexus segments keep the distinctions that lead to a different campaign. For more ways to group customers beyond RFM, see our overview of customer segmentation models.
How do you customize RFM segments?
Segments should fit your business, not the other way round. Whatever tool you use, customize them in three ways:
- Merge small segments. If there are only a few customers in a group, move them into a similar segment. A segment too small to target is a segment you will not use.
- Rename segments. Change a segment name to something that makes more sense to your team, as long as everyone uses the same name in every channel.
- Change the intervals. If your buying cycle is long, widen the recency scale, so seasonal buyers are not labeled inactive too early.
Which reports should you run on RFM segments?
An RFM dashboard gives you an overview of the key metrics for eCommerce growth. These are the reports worth reading, and the insight each one gives.
Revenue vs. margin
Probably the most revealing report. It shows total revenue and margin per RFM segment, and per new versus returning customer. In many stores the Pareto principle holds as a rule of thumb: a minority of customers brings in most of the revenue, and the most profitable customers also have a better gross margin than the rest. But who are these customers? The next reports let you drill down into their behavior to find patterns.
Top customers
This report shows your most and least valuable customers and the RFM group each belongs to. Analyze their profiles: is the demographic data similar? Do your most profitable customers buy the same products or choose the same shipping methods? The answers tell you who your best customers are and where to find more of them.
Product return rate per RFM group
Product returns show your worst-performing products, and they also reveal different behavior across RFM groups. For example, you might notice that your Loyal customers and Soulmates buy the same categories or brands, while Breakups stopped ordering after buying similar products. Such insights are valuable for cross-sell and upsell campaigns, and for personalizing paid ads per segment.
Buying habits
Like the returns report, buying habits reveal your customers' preferences and the performance of your products and brands. Among other things, it shows which products your top-performing segments buy most often, which is useful for assortment and merchandising decisions.
Customer lifetime value
Buying patterns can also be analyzed in Google Analytics, but a CLV report takes a lot of time and effort to compile with other tools. Before we automated it, we used Excel tables and imported the data into a BI tool. Customer lifetime value combines several factors:
- Average customer lifespan
- Customer retention rate
- Profit margin per customer
- Rate of discount
- Average customer value per period
A useful convention is to compute these metrics over the 12 months before the end of the selected period. Your store's CLV fluctuates as these factors change, but it is an essential piece of the business puzzle. Knowing CLV per RFM segment tells you which customers you want to attract and which segments deserve more time and attention. A Soulmate is worth more to your store than a one-time buyer, so customer service, packaging and targeting across channels should reflect that.
NPS
The Net Promoter Score measures how likely customers are to recommend your shop to a friend or colleague, and reflects the overall customer experience. It is not directly part of CLV, but it is a good signal of future growth. Measure it before and after delivery, so the score is tracked continuously and you know when and where to act. Read per segment, NPS gives a voice to the customers in each group and highlights your strong and weak points. See our NPS guide for how to run it.
Retention rate
The retention rate is the percentage of customers who place more than one order in a given period. Your goal is to turn new clients into recurring ones and keep existing customers buying. If the retention rate trends down, you may be acquiring the wrong customers, or your onboarding and retention strategies may not be working.
Cohort analysis
A cohort analysis groups customers by a shared characteristic, most often the month they were acquired, and shows how many stay active over time. If you run different promotions every month, cohorts show how effective each one was, and which strategies retain your most profitable customers.
How do you get started with an RFM segmentation tool?
- Connect your data. The tool needs four data sets: customers, categories, products and orders. On a hosted platform this is usually an app connection; on a custom or self-hosted store it is a data feed.
- Configure your store details. Add your average shop margin and decide how to handle guest checkouts, which have no customer account.
- Add your costs. Enter acquisition costs, and retention costs such as loyalty programs and discounts, so segment value reflects profit.
- Set the RFM intervals. Adjust the recency, frequency and monetary scales to your buying cycle, then check that no segment is too small to use.
- Read the reports and act. Start with revenue versus margin, give each segment one action, and push the segments to your email and ad platforms.
How does Nexus by Omniconvert handle RFM segmentation?
The weak point of most RFM projects is not the scoring. It is what happens after. Someone exports the segments, formats a file and uploads it to the ad account and the email platform, and by the time the campaign runs, customers have already moved between segments. We call this the Human Middleware Problem.
Nexus by Omniconvert removes that step. It segments customers by recency, frequency and monetary value and pushes the segments directly to Meta Ads, Google Ads and Klaviyo. A customer who drifts into About-to-Dump can get a win-back message while it still matters, and your Soulmates do not keep receiving acquisition ads.
According to the Nexus Customer Intelligence page, Nexus also covers the reports described above: CLV tracking by cohort and acquisition channel, NPS by segment and product category, buying habits analysis that maps the first-order product to retention, and a dynamic audience builder with Meta and Google sync. Segments update on every new order, calculated from Shopify purchase history.
Nexus is built on 13 years of data from more than 7,000 websites across 15+ industries. To see it on your own customer data, book a call with our team.
RFM segmentation tool FAQ
An RFM segmentation tool is software that scores every customer on recency, frequency and monetary value using your order data, then groups customers with similar scores into segments. It replaces the manual work of exporting orders to a spreadsheet, calculating scores and rebuilding the groups every month. Good tools also add costs and margin, so you see which segments are profitable and not only which ones spend the most.
RFM stands for Recency, Frequency and Monetary value. Recency is how recently a customer bought. Frequency is how often they buy. Monetary value is how much they spend. Together, the three show how engaged and how valuable each customer is.
Yes, for a one-time analysis of a small customer base. The problem is upkeep: customers move between segments every week, so a spreadsheet goes stale as soon as you build it, and connecting segments to costs, returns, CLV and your ad accounts takes many manual steps. A tool recalculates the scores automatically and keeps the segments current.
Use as many as you can act on. Nexus by Omniconvert uses six segments: Soulmates, Loyal, New, Promising, About-to-Dump and Breakups, which separate your best, repeat, first-time, growing, at-risk and lapsed customers. The older Reveal model used a finer 11-segment split. If you run the same campaign for two segments, you do not need both. More segments than campaigns only adds noise.
Revenue alone overstates customer value. A segment that spends a lot but costs a lot to acquire, or buys only with discounts, can be less profitable than a smaller segment. Adding acquisition cost and retention costs, such as loyalty programs and discounts, shows the real value of each segment and tells you which customers are worth paying to attract.
Start with revenue and margin per segment, then look at your top customers, product return rate per segment, buying habits, customer lifetime value, NPS, retention rate and cohorts. Revenue versus margin shows where profit comes from. The other reports explain why the best segments behave the way they do, so you can find more customers like them.
Match each segment to one action. Reward Soulmates with loyalty and VIP retention, cross-sell to Loyal customers, onboard New customers toward a second purchase, nudge Promising customers to a third order, send About-to-Dump customers a win-back flow, and win back only the high-CLV Breakups. Then send the segments to your email and ad platforms, so each audience sees a different message and budget.
Yes. Nexus by Omniconvert is Omniconvert's customer data platform for RFM segmentation, customer lifetime value, retention and churn prediction. It updates RFM segments on every new order, reports NPS by segment and buying habits, and pushes segments directly to Meta Ads, Google Ads and Klaviyo, so your audiences stay current without a weekly export and upload. It replaces Reveal, Omniconvert's earlier retail analytics tool.
RFM segmentation is only useful when it changes a decision. Start by connecting your customer and order data, add your acquisition and retention costs, and read revenue versus margin per segment. That one report usually shows which customers carry the business and which ones cost more than they return. Then study your best segments to find out who they are and what they buy, and give each segment its own action and budget. A tool earns its place by doing the scoring for you and keeping the segments current in the channels where you spend money.
Turn RFM segments into campaigns
Nexus by Omniconvert segments your customers by recency, frequency and monetary value, tracks customer lifetime value, and pushes RFM segments directly to Meta Ads, Google Ads and Klaviyo. Built on 13 years of data from 7,000+ websites across 15+ industries.