Statistical Significance in A/B Testing: When to Call a Winner

- Calculate required sample size before launching any test based on baseline conversion rate, minimum detectable effect, power, and significance threshold
- Evaluate confidence interval width alongside statistical significance to assess the precision of your effect size estimate
- Pre-register segments for subgroup analysis to avoid multiple comparison problems that inflate false positive rates
- Consider sequential testing methods when business constraints require faster decisions without sacrificing statistical validity
- Build organisational decision frameworks that standardise criteria based on test risk and potential business impact
You have been running your A/B test for two weeks. The variant shows a 12% lift in conversions, and your stakeholders are eager to ship it. But should you?
Premature test conclusions cost e-commerce brands millions in lost revenue annually. The pressure to move fast often leads teams to call winners too early, implement changes based on statistical noise, and then wonder why the promised lift never materialises in production.
This guide provides the statistical framework and practical decision criteria you need to determine exactly when your A/B test has reached valid conclusions worth acting on.
The True Cost of Calling Tests Too Early
Every CRO professional has experienced the sinking feeling: a test that showed a 15% lift during experimentation delivers flat or even negative results post-implementation. This phenomenon, known as regression to the mean, occurs when we mistake random variance for genuine treatment effects.
The mathematics behind this are unforgiving. If you call a test at 80% confidence instead of 95%, you are accepting a 20% false positive rate. Run ten tests per quarter with this threshold, and two of your implemented changes are likely based on noise rather than signal. Over a year, that compounds into eight potentially harmful changes to your site.
For mid-market e-commerce brands processing $10M to $50M annually, even a 1% conversion rate degradation from a false positive represents $100K to $500K in lost revenue. The urgency to iterate quickly must be balanced against the cost of iterating incorrectly.
Statistical rigour is not about slowing down your testing program. It is about ensuring that when you do implement changes, they deliver the results you predicted. The goal is sustainable, compounding gains rather than a random walk around your baseline conversion rate.
Understanding Confidence Intervals Beyond the p-Value

Most testing platforms display a single number: statistical significance at 95%. This binary indicator obscures the nuance required for sophisticated decision-making. A test reaching 95% significance with a confidence interval of 2% to 18% lift tells a very different story than one showing 9% to 11% lift.
The width of your confidence interval matters as much as whether it excludes zero. Wide intervals indicate high uncertainty about the true effect size, even when the test is technically significant. Narrow intervals provide actionable precision for forecasting the business impact of implementation.
Consider two scenarios: Test A shows 95% significance with an estimated lift of 10% and a confidence interval of 1% to 19%. Test B shows 95% significance with an estimated lift of 6% and a confidence interval of 4% to 8%. Despite Test A showing a higher point estimate, Test B provides far more reliable forecasting for business planning.
Your minimum detectable effect (MDE) should be determined before the test begins, based on the business impact threshold that justifies the implementation effort. If a 3% lift is your MDE, a test showing significance with a confidence interval of 1% to 5% has not conclusively proven the effect exceeds your threshold.
Sample Size Requirements: The Foundation of Valid Results

Insufficient sample size is the most common cause of unreliable test results. The required sample depends on four factors: your baseline conversion rate, the minimum effect size you want to detect, your desired statistical power, and your significance threshold.
For a typical e-commerce site with a 3% baseline conversion rate seeking to detect a 10% relative lift with 80% power at 95% significance, you need approximately 51,000 visitors per variation. At 5,000 daily visitors, that requires a minimum test duration of 20 days, assuming equal traffic split.
Power, often overlooked, represents your probability of detecting a real effect when one exists. At 80% power, you have a 20% chance of missing a genuine improvement. For high-stakes tests on primary conversion flows, consider increasing power to 90%, which roughly doubles your sample size requirement.
These calculations assume stable traffic quality and no external factors affecting conversion rates during the test period. Seasonality, marketing campaigns, and inventory changes can all introduce confounding variables that invalidate results regardless of sample size.
The Sequential Testing Alternative for Faster Decisions
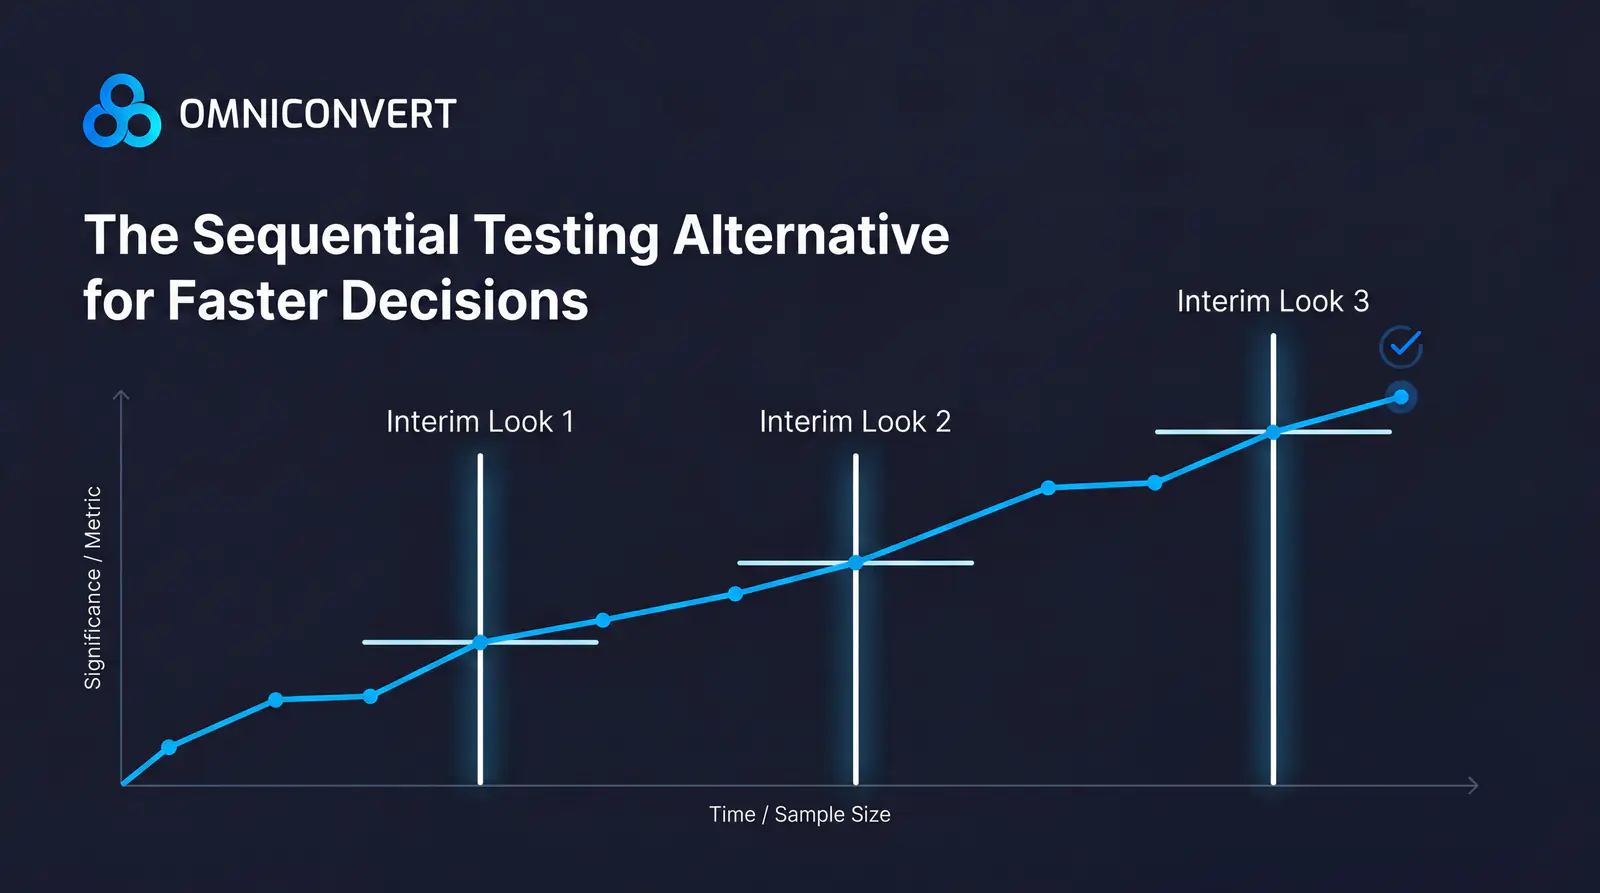
Classical fixed-horizon testing requires you to predetermine sample size and wait until that threshold is reached before analysis. Sequential testing methods, including Bayesian approaches and alpha spending functions, allow for valid interim analyses without inflating false positive rates.
Sequential testing works by adjusting the significance threshold at each interim look to maintain the overall Type I error rate. If you plan five interim analyses, each look uses a more stringent threshold than 95%, ensuring the cumulative false positive probability stays at 5%.
This approach is particularly valuable for e-commerce brands testing during high-stakes periods like holiday seasons. Rather than committing to a three-week test that might miss the Black Friday window, you can design a sequential test with planned interim analyses that allows early stopping if effects are large and clear.
The tradeoff is reduced power compared to fixed-horizon tests of equivalent duration. Sequential methods also require more sophisticated implementation and interpretation. Most testing platforms now offer Bayesian or sequential options, but the default settings may not align with your specific risk tolerance and business constraints.
Segmentation Analysis: Finding Signal Within Noise

Aggregate results can mask meaningful segment-level effects. A test showing no overall significance might reveal a 25% lift among mobile users offset by a 15% decline among desktop users. Conversely, an apparently successful test might be driven entirely by a small, non-representative segment.
Pre-registration of segments is essential for valid subgroup analysis. Deciding to examine mobile versus desktop performance after seeing the data introduces multiple comparison problems that inflate false positive rates. For every additional segment analysed post-hoc, apply appropriate corrections like Bonferroni adjustment.
The most actionable segment analyses focus on dimensions you can target with personalisation. Device type, traffic source, new versus returning visitors, and geographic region represent segments where differential treatment is implementable. Analysing by arbitrary dimensions like browser version or screen resolution rarely yields actionable insights.
When segment analysis reveals heterogeneous treatment effects, resist the temptation to implement only for the winning segment without further validation. A targeted test on that specific segment provides the statistical rigour needed for confident implementation.
External Validity: Will Your Test Results Hold in Production?
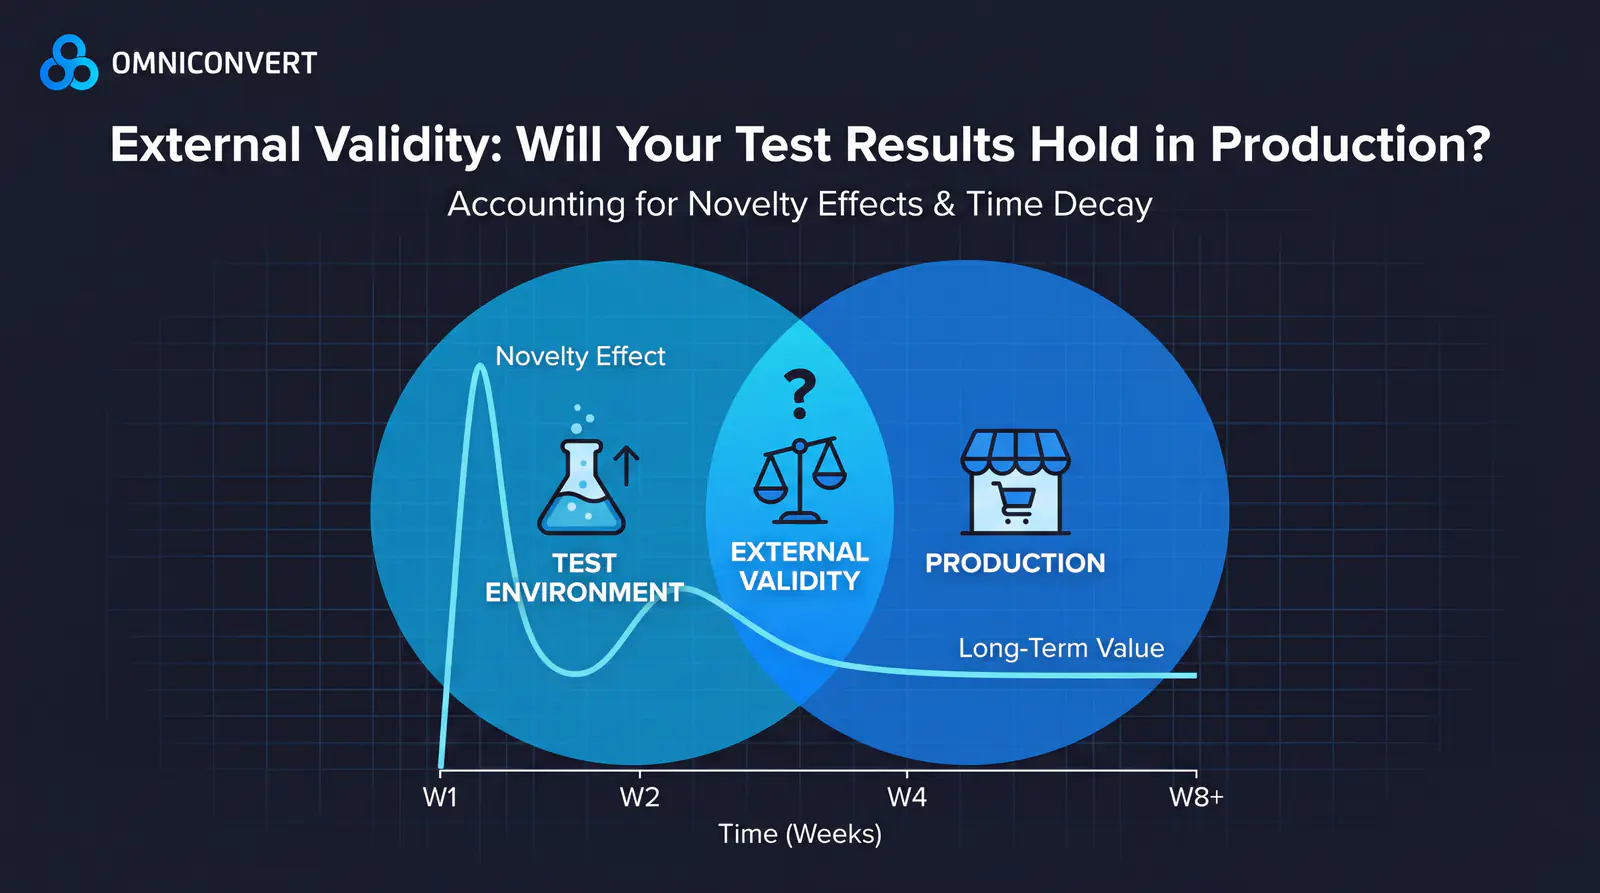
Statistical significance addresses internal validity: did the treatment cause the observed effect within the test environment? External validity asks a different question: will this effect persist when implemented at scale across time?
Novelty effects represent a common threat to external validity. Users may engage differently with a new design element simply because it is new, generating an initial lift that decays over time. Tests running longer than two weeks help capture this decay pattern before implementation decisions.
Sample representativeness matters for external validity. A test running exclusively during a promotional period may not generalise to regular shopping behaviour. Tests conducted during Q4 may not predict Q1 performance. Consider whether your test sample reflects the full range of conditions under which the treatment will operate.
Implementation fidelity is the final external validity concern. The test version and production version must be identical. Subtle differences in load time, rendering, or functionality between test and production environments can cause production results to diverge from test predictions.
Building a Decision Framework for Your Testing Program
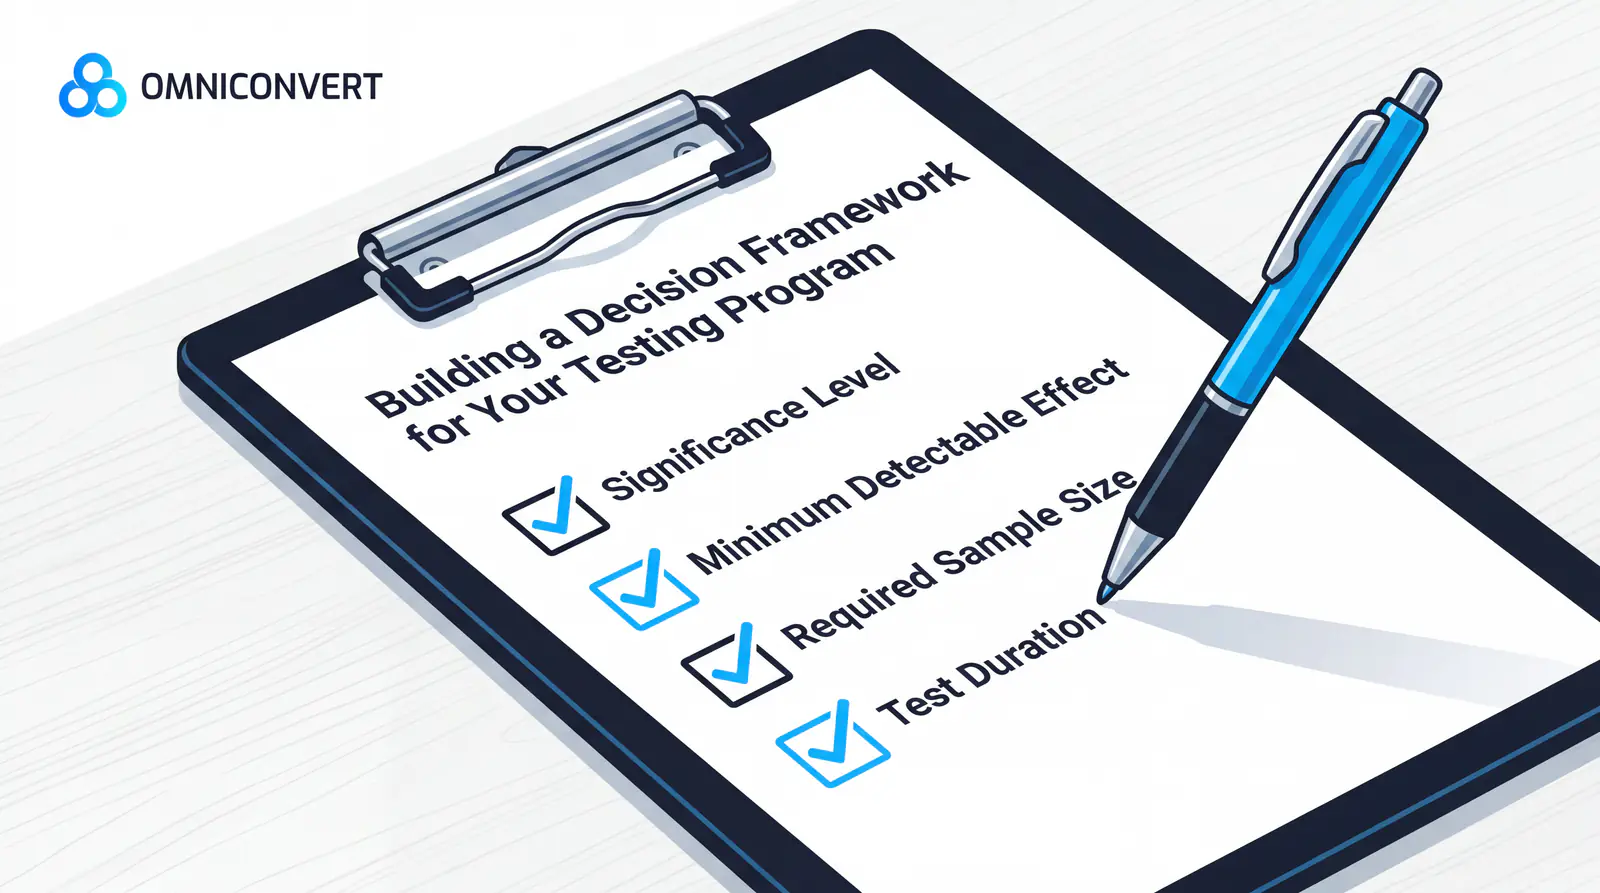
Standardising your decision criteria removes subjectivity and politics from test conclusions. Document your thresholds for significance level, minimum detectable effect, required sample size, and test duration before any test begins. These parameters should vary based on test risk and potential impact.
Create a tiered framework based on implementation risk. Low-risk changes like button copy might proceed at 90% confidence with narrower confidence intervals. High-risk changes affecting checkout flow should require 95% or higher confidence, adequate power, and validation of external validity concerns.
Establish clear ownership of go or no-go decisions and the criteria that inform them. When stakeholders understand that early termination risks specific, quantifiable business outcomes, the pressure to call tests prematurely diminishes. Data literacy across the organisation is your best defence against statistical shortcuts.
Finally, maintain a test archive that tracks predicted versus actual post-implementation performance. This feedback loop reveals systematic biases in your testing program and calibrates your team's intuition about when results can be trusted.
Frequently Asked Questions
Calling a test at 80% confidence instead of 95% means accepting a 20% false positive rate. Run ten tests per quarter at this threshold and two implemented changes are likely based on noise rather than signal. For mid-market e-commerce brands processing $10M–$50M annually, even a 1% conversion rate degradation from a false positive represents $100K–$500K in lost revenue.
A p-value tells you whether an effect is statistically significant. A confidence interval tells you the range of plausible true effect sizes. A test significant at 95% with a CI of 1%–19% lift has far more uncertainty than one showing 4%–8% lift — the second provides reliable forecasting for business planning even though the first shows a higher point estimate.
Sample size depends on four factors: your baseline conversion rate, the minimum effect size you want to detect, your desired statistical power, and your significance threshold. For a 3% baseline conversion rate, 10% relative lift, 80% power, and 95% significance, you need approximately 51,000 visitors per variation — about 20 days at 5,000 daily visitors.
Sequential testing allows valid interim analyses without inflating false positive rates by adjusting the significance threshold at each look. This is valuable for e-commerce brands testing during high-stakes periods like holiday seasons, enabling early stopping when effects are large and clear rather than committing to a fixed test duration that might miss a sales window.
Pre-register your segments before launching the test, not after seeing the data. Deciding post-hoc which segments to examine creates multiple comparison problems. For each additional segment analyzed after the fact, apply statistical corrections like Bonferroni adjustment. When segment analysis reveals heterogeneous effects, run a dedicated test on that specific segment before implementing for it alone.
Statistical rigour in A/B testing is not an academic exercise. It is the foundation of sustainable conversion optimisation that compounds over time rather than oscillating around baseline performance. By understanding the mechanics of confidence intervals, sample size requirements, and external validity threats, you equip your team to make decisions that deliver predicted results in production. The investment in statistical discipline pays dividends through every subsequent test, building a testing program where implemented changes reliably improve business outcomes.
Ready to run tests you can trust?
Omniconvert Explore gives you built-in statistical significance tracking, GA4-native reporting, and a support team to help you interpret results with confidence.