CRO Glossary
Sampling Error: Definition, Types and Examples
- What Is Sampling Error?
- What Does Sampling Error…
- What Is the Difference Be…
- What Are the Types of Sam…
- What Is Sampling Frame Er…
- What Causes Sampling Erro…
- When Does Sampling Error…
- How to Calculate Sampling…
- What Is Sampling Error in…
- What Are Examples of Samp…
- How to Reduce Sampling Er…
- Why Is Sampling Error Imp…
- How Does Sampling Error A…
- How Does Sampling Error I…
- How Does Sampling Error I…
Sampling Error is the difference between a sample result and the true population value. A Sampling error occurs because a sample reflects part of a group, not all members. The error measures uncertainty in research, helping researchers assess how well a sample reflects the whole population. The error impacts research accuracy. Small errors indicate the sample closely reflects the population, boosting confidence in planning, forecasts, and policy decisions, while large errors highlight uncertainty, affecting policies, financial plans, and scientific claims. For example, public health relies on low sampling errors for vaccination strategies and resource distribution.
The types of sampling error include random and systematic errors. Random error results from variation in selection (different responses from individuals). Systematic error occurs when a sample overrepresents or omits groups (surveying daytime shoppers while excluding workers). Knowing the errors aids researchers in designing better studies.
Sampling errors are calculated using formulas that measure the difference between sample statistics and population parameters. The common method uses the standard error formula, dividing the population standard deviation by the square root of the sample size. Another method employs the margin of error formula, multiplying a critical value from the normal distribution by the standard error. Sampling error arises from sample size, population variability, and selection method. Smaller samples decrease representation, while high variability among population members increases error. Poor techniques (excluding groups) cause systematic distortions that raise sampling errors.
What Is Sampling Error?
Sampling error is observed in election polls and market research surveys and constitutes the numerical difference between a result from a subset and the actual population value. The error occurs because a sample represents a specific portion of the total group. Researchers acknowledge that the most meticulously designed studies encounter statistical discrepancies. The magnitude of variation depends on the size and selection process of the data set. High-quality research accounts for natural variability to ensure data integrity is maintained. The concept of sampling error remains fundamental to interpreting research findings accurately.
How Is Sampling Error Defined in Statistics and Research?
Sampling error is defined in statistics and research by occurring when observations focus on a subset rather than the complete population. Analysts express the deviation through metrics such as margins of error or confidence intervals. Inferential statistics relies heavily on understanding the gap to make predictions about larger groups. Accurate measurement of the variance helps determine the reliability of the study conclusions. Researchers utilize the calculations to provide a clear picture of data precision. Statistics professionals calculate sampling error to validate experimental models.
Is Sampling Error an Unavoidable Outcome of Using Samples Instead of Populations?
Yes, sampling error is an unavoidable outcome of using samples instead of populations because it does not completely eliminated from a study using a subset of data. The discrepancy exists whenever measuring every individual within a population is impossible. Researchers focus on reducing the margin through improved methodology rather than seeking total removal. Statistical models account for the inherent limitations during the analysis phase. Proper planning mitigates the impact of fluctuations on the final results. The existence of sampling error is a standard expectation in non-census data collection.
What Does Sampling Error Mean in Research Studies?
Sampling error means in research studies represents the natural variability found between a sample and the population it aims to reflect. The term indicates the expected statistical fluctuation that occurs during data collection. Presence of the variation does not necessarily signal a flaw in the research design or execution. Scientists view the difference as an inherent part of the estimation process. Understanding the concept allows for better contextualization of research outcomes. Each study using a subset must address the implications of sampling error for its conclusions.
Why Does Sampling Error Occur in Research Methodology?
Sampling error occurs in research methodology because a sample represents the target population only partially. Random variation inherently affects the outcomes of any selected data subset. Increasing the size of the sample serves to reduce the impact of the statistical error. Diverse populations require more extensive sampling to capture the full range of characteristics. Methodological choices influence how much variance appears in the final data set. Researchers investigate the causes of sampling error to improve their investigative techniques.
Does Sampling Error Always Indicate Poor Research Quality?
No, sampling error does not always indicate poor research quality because it is a natural statistical outcome when using subsets. High-quality studies acknowledge, estimate, and manage the variation through appropriate sample sizes and confidence intervals. Researchers use probability sampling methods to ensure the data remains as representative as possible. The presence of a calculated margin of error reflects a rigorous and transparent analytical process. Managing these deviations is a hallmark of professional scientific inquiry. Valid studies openly report the estimated sampling error to provide context for their findings.
What Is the Difference Between Sampling Error and Sample Error?
The difference between sampling error and sample errot involves the distinction between inherent statistical variation and procedural mistakes. Sampling error refers to the natural difference between a sample and a population due to chance. Sample error refers to errors in data collection (incorrect data entry or interviewer bias). Distinguishing between the terms is vital for maintaining the accuracy of research conclusions. Statistical analysis addresses the former, while quality control addresses the latter. Precise terminology helps researchers identify the source of sampling error within their datasets.
How Do Sampling Error and Sample Error Differ in Terminology?
Sampling error and sample error differ in terminology because they represent distinct concepts within the fields of statistics and research. Sampling error is a formal statistical concept tied closely to probability theory. Sample error functions as an informal term describing human mistakes or procedural failures during a study. Confusing the terms leads to incorrect conclusions regarding the validity and reliability of a study. Clear communication ensures that analysts address the correct type of discrepancy. Proper usage of the terms improves the clarity of scientific reports. Accuracy in defining sampling error prevents misunderstandings in data interpretation.
Are Sampling Error and Sample Error Used Interchangeably in Statistics?
No, sampling error and sample error are not used interchangeably in the field of statistics. Statistical literature treats sampling error as an inherent limitation of the sampling process itself. Sample error indicates specific flaws in research execution or data handling. Maintaining the distinction is necessary for rigorous data analysis and peer review. Researchers must identify whether a problem stems from the nature of the subset or a mistake in the process. Scientific rigor demands a clear separation of sampling error from operational mistakes.
What Are the Types of Sampling Errors?
The types of Sampling Errors are listed below.
- Random Sampling Error: An error that involves fluctuations caused by pure chance during the selection of individuals. The size of the error decreases as the total number of participants increases.
- Systematic Sampling Error: An error that occurs when the selection process favors certain outcomes over others. Flaws in the research design cause the errors rather than random luck.
- Selection Bias: An error that happens when participants do not represent the broader population accurately. Results lack generalizability when bias exists within a study.
- Undercoverage Error: An error that arises when some members of the population have no chance of being selected. The exclusion results in a data set that misses critical perspectives.
- Overrepresentation Error: An error that occurs when a specific subgroup appears too frequently within the sample. Statistical averages become distorted when an imbalance exists in the data.
- Non-response Error: An error that develops when chosen participants fail to provide data. Absence of information introduces a significant sampling error into the final analysis.
How Are Sampling Errors Classified in Research Methodology?
Sampling errors are classified in research methodology by either random or systematic. Random errors arise by pure chance and affect the precision of the results. Systematic errors arise from biased sampling techniques and impact the overall accuracy of the findings. Identifying the classifications helps researchers implement strategies to reduce inaccuracies in their final results. Effective study design minimizes systematic flaws while accounting for random fluctuations. The classification system provides a framework for evaluating research quality. Methodologists categorize sampling error to better understand its effect on data.
Are Random and Systematic Errors Both Considered Sampling Errors?
Yes, random and systematic errors are both considered types of sampling errors. Random errors decrease in size when researchers utilize larger samples. Systematic errors require improvements in the sampling design to ensure the data is representative. Both forms of error contribute to the total deviation observed in research results. Analysts must address both to claim a study is reliable and valid. Differentiating between the two helps in troubleshooting data inconsistencies. Every comprehensive analysis must evaluate the presence of sampling error in its various forms.
What Is Sampling Frame Error?
Sampling frame error, occurring in telephone surveys and email marketing lists, happens when the list used to select a sample fails to represent the target population accurately. The discrepancy causes overrepresentation or underrepresentation of specific groups, which skews the final results. Evidence shows that careful construction of the sampling list reduces the likelihood of bias. Comparing the frame against known population characteristics ensures higher data quality. Researchers must verify the completeness of their source lists before beginning data collection. A flawed list is a primary source of sampling error in many social science studies.
How Does an Inaccurate Sampling Frame Lead to Sampling Error?
An inaccurate sampling frame leads to sampling error by misrepresenting the target population during the selection phase. Certain groups within the population end up overrepresented or underrepresented in the resulting data set. The imbalance skews the results and reduces the reliability of the research findings. Researchers must ensure that every individual has a known chance of being included in the frame. Using an outdated or incomplete list compromises the entire study. A missing segment in the list directly contributes to sampling error in the final estimates.
Is Sampling Frame Error a Form of Selection Bias?
Yes, sampling frame error is a form of selection bias. The error occurs when the chosen sample consistently excludes or overrepresents certain population groups due to a flawed list. The systematic exclusion makes the sample unrepresentative and negatively affects the validity of the study. Researchers aim to minimize bias by utilizing comprehensive and updated source lists. Selection bias undermines the ability to generalize findings to the broader population. Analysts identify the bias as a significant component of sampling error in their reports.
What Causes Sampling Error in Research?
The causes of Sampling Error in research are listed below.
- Random Variation: Natural differences exist between the individuals selected for a sample and the entire population. Variation occurs purely by chance during the selection process.
- Systematic Issues: Biased sampling methods consistently favor certain results or groups over others. The issues stem from flaws in the research design rather than random luck.
- Inaccurate Sampling Frame: The list used to identify the population fails to include relevant members. Misrepresentation leads to a skewed sampling error in the final data.
How Do Sample Size and Population Variability Influence Sampling Error?
Sample size and population variability influence sampling error by determining the precision of the resulting estimates. Larger sample sizes and lower levels of population variability work together to reduce the margin of error. Small samples or highly variable populations increase the risk of obtaining non-representative data. Researchers adjust their sample sizes based on the diversity of the population to improve accuracy. Higher variability requires more data points to capture the true population mean. The factors are the main drivers of the calculated sampling error in statistical tests.
Does Increasing Sample Size Always Reduce Sampling Error?
No, increasing sample size does not always reduce sampling error if systematic biases are present. Biases in the sampling process or data collection methods remain unaffected by the quantity of data collected. A proper sampling design is essential alongside larger samples to minimize the overall error effectively. A large but biased sample still produces inaccurate results that do not reflect the population. Researchers must focus on both quality and quantity to ensure data integrity. Increasing the number of participants only mitigates the random component of sampling error in a study.
When Does Sampling Error Occur?
Sampling error occurs whenever a researcher uses a sample instead of the full population for their study. The error reflects the natural difference between the sample estimate and the true population value. All research based on samples contains some level of error, even with the most careful design. The only way to eliminate the discrepancy entirely is to conduct a full census. Understanding the timing of the error helps in evaluating the reliability of data. Analysts expect to find a certain degree of sampling error in any subset analysis.
When Does Sampling Error Occur in the Research Process?
Sampling error occurs in the research process during the sample selection and data collection stages. Errors arise if the selected group does not perfectly reflect the characteristics of the larger population. Early detection of the issues helps researchers adjust their sampling methods to reduce the impact of error. Fluctuation is introduced the moment a subset is defined from the total group. Monitoring these stages ensures that the data remains as representative as possible. The initial choice of participants is a critical point where sampling error begins to affect the results.
Does Sampling Error Occur Even with Random Sampling Methods?
Yes, sampling error occurs even when researchers use random sampling methods. Random variation means that the sample differs from the population purely by chance. Increasing the sample size reduces the error but never fully eliminates the possibility of deviation. Probability theory accounts for the expected variance in every random selection process. Randomness ensures a lack of bias but does not guarantee a perfect replica of the population. The best random process results in some level of sampling error in the final dataset.
How to Calculate Sampling Error?
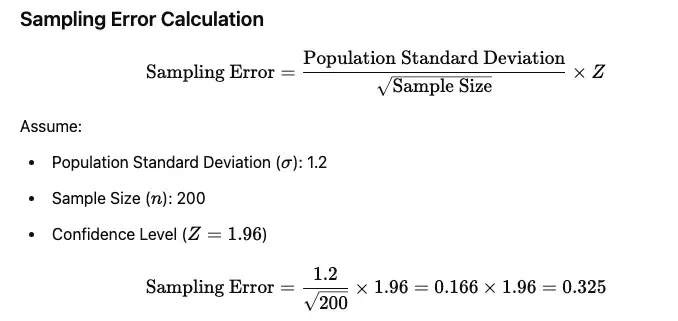
First, identify the standard deviation of the population or the sample proportion. Second, determine the total size of the sample being analyzed. Third, divide the standard deviation by the square root of the sample size for mean-based data. Fourth, use the proportion formula involving the product of successes and failures divided by the sample size for categorical data. Lastly, multiply the result by a Z-score corresponding to the desired confidence level. These steps provide a clear measurement of the sampling error for the specific study.
What Is the Standard Sampling Error Formula Used in Statistics?
The standard sampling error formula used in statistics depends on whether the data involves means or proportions. For example, the formula is SE = σ / √n, where “σ” is the standard deviation and “n” is the sample size. The formula is √[p(1−p)/n] for proportions, where p represents the sample proportion. Formulas measure the variability in estimates and assess the accuracy of the sample results. Analysts use these calculations to establish confidence intervals for their findings. Correct application of the formula is necessary for quantifying sampling error in research.
Does the Sampling Error Formula Change by Data Type or Distribution?
Yes, the sampling error formula changes depending on whether the data is continuous or categorical. Continuous data sets utilize formulas based on standard deviation to calculate the margin of error. Categorical data sets rely on proportion-based calculations to determine variability. Choosing the correct formula ensures an accurate measurement of the sampling variability present in the study. Different distributions require specific adjustments to maintain the precision of the estimates. Selecting the right mathematical approach is vital for assessing sampling error correctly.
What Is Sampling Error in Statistics?
Sampling error in statistics is common in agricultural yield studies and educational assessments, and it is the difference between a sample statistic and the true population parameter. The error arises because analysts examine only a subset of the population rather than the entire group. It serves as a measure to quantify uncertainty in estimates and guides the level of confidence in the conclusions. Smaller values indicate that the sample is a closer representation of the whole. Statisticians use the metric to evaluate the strength of their evidence. The mathematical definition of sampling error is central to hypothesis testing.
How Do Statisticians Interpret Sampling Error in Data Analysis?
Statisticians interpret sampling error in data analysis by the expected variation between sample outcomes and population parameters. Interpretation informs the construction of confidence intervals and the execution of hypothesis testing. Smaller errors indicate more reliable data, whereas larger errors suggest greater uncertainty in the results. Analysts use the information to decide whether observed effects are significant or due to chance. Understanding the variation is crucial for making accurate predictions. Data scientists evaluate the magnitude of sampling error before finalizing their reports.
Is Sampling Error Considered a Measure of Uncertainty?
Yes, sampling error is considered a measure of uncertainty because it quantifies the precision of an estimate. Larger errors signal less reliable estimates and a wider range of possible population values. The metric helps researchers evaluate the level of confidence they place in their results. Uncertainty is an inherent part of any study that does not measure every individual in a population. Reporting the values allows for a transparent assessment of the findings. Quantification of sampling error is a key step in statistical validation.
What Are Examples of Sampling Error?
The examples of Sampling Error are listed below.
- Survey Bias: A study overrepresents certain demographics when the selection process is not perfectly random. Results do not reflect the entire population when the imbalance occurs.
- Election Polls: Political surveys show a margin of error because the number of voters questioned differs from the total voting population. Predicted outcomes vary from the final count due to the discrepancies.
- Market Research: A business misestimates customer preferences when the sample group lacks diversity. Lack of representation creates a significant sampling error in the market analysis.
How Do Real World Surveys Demonstrate Sampling Error?
Real-world surveys demonstrate sampling error through the results from the sample differ from the actual outcomes in the population. Margins of error are included in reports to indicate the expected variation from the true value. Awareness of the phenomenon prevents the overinterpretation of survey data by stakeholders. Deviations are visible when comparing pre-election polls to actual election results. Each survey provides an estimate rather than an absolute fact. Public opinion researchers manage sampling error to provide useful insights.
Can Sampling Error Lead to Misleading Survey Results?
Yes, sampling error leads to misleading survey results by distorting the conclusions drawn from the data. Small or biased samples increase the risk that the findings do not reflect reality. Reporting margins of error mitigates the potential for misinterpretation by providing a range of likely values. Researchers must be cautious when generalizing results from a limited group of participants. Misleading data leads to poor decision-making in various fields. A high degree of sampling error hides the true trends within a population.
How to Reduce Sampling Error
To reduce sampling error, follow the five steps. First, increase the sample size to provide a more stable estimate of population characteristics. Second, utilize probability sampling methods to ensure every member has a chance of being selected. Third, stratify the population into subgroups to ensure proportional representation of different characteristics. Fourth, improve the quality of the sampling frame to include all members of the target group. Lastly, minimize non-response by using effective follow-up techniques with participants. The steps collectively help in reducing the overall sampling error in the research.
What Sampling Techniques Help Minimize Sampling Error?
The sampling techniques help minimize Sampling Error are listed below.
- Simple Random Sampling: Every individual in the population has an equal chance of being selected for the study. The technique reduces bias and provides a basis for calculating error margins.
- Stratified Sampling: The population is divided into subgroups, and samples are taken from each to ensure representation. The method is effective at reducing variance in heterogeneous populations.
- Cluster Sampling: Researchers divide the population into groups and select entire groups for the study. The approach helps manage costs while providing a way to estimate sampling error in the data.
Does Stratified Sampling Reduce Sampling Error More Than Simple Random Sampling?
Yes, stratified sampling reduces sampling error more than simple random sampling, especially for heterogeneous populations. The method ensures that each subgroup is represented proportionally within the final sample. It is effective when the population variability between groups is high but low within groups. Researchers gain more precise estimates by focusing on these specific divisions. The technique minimizes the risk of accidentally omitting a critical segment of the population. Proper stratification is a powerful tool for controlling sampling error in complex studies.
Why Is Sampling Error Important in Data Analysis?
Sampling error is important in data analysis as it shows the extent to which a sample estimate differs from the actual population value. Overlooking the discrepancy results in inaccurate conclusions and misleading interpretations of the data. Accounting for the error improves the confidence in the research results. Analysts use the information to set the boundaries for their predictions. The data analysis is a foundation for most statistical tests. Each analyst must consider the impact of sampling error on their findings.
How Does Sampling Error Influence Statistical Conclusions?
Sampling error influences statistical conclusions by reducing the precision of the estimates generated from the data. The variation affects the width of confidence intervals and the results of significance testing. Recognizing the presence of error prevents researchers from making false claims of statistical significance. Large errors obscure real effects or make random noise appear important. Statistical models incorporate the fluctuations to remain valid. The size of the sampling error determines the strength of the final conclusion.
Can Ignoring Sampling Error Lead to Incorrect Business Decisions?
Yes, ignoring sampling error can lead to incorrect business decisions and flawed organizational strategies. Misinterpreted data results in the pursuit of ineffective marketing campaigns or product changes. Considering the margin of error ensures that leaders make better-informed choices based on the reliability of the data. The business analysts distinguish between meaningful trends and random noise. Ignoring statistical nuances results in wasted resources and lost opportunities. Failing to account for sampling error compromises the success of a corporate project.
How Does Sampling Error Affect Conversion Rate Optimization (CRO)?
Sampling error affects Conversion Rate Optimization (CRO) by making differences in performance appear misleading or exaggerated. Small tests are affected by the fluctuations, leading to incorrect assumptions about user behavior. Awareness of the error prevents practitioners from reaching false optimization conclusions. The Conversion Rate Optimization for Ecommerce teams ensure their tests run long enough to reach statistical significance. Random variations in traffic are mistaken for a permanent change in user preference. Professionals in the field monitor sampling error to validate website changes.
Why Is Sampling Error Critical When Interpreting CRO Test Results?
Sampling error is critical when interpreting Conversion Rate Optimization (CRO) test results because it determines if observed differences are real or due to chance. Misjudging the fluctuations leads to implementing website changes that do not actually improve performance. Proper accounting for the error ensures that optimization decisions are based on reliable data. Analysts use statistical power to verify that the sample size is sufficient for the test. Understanding the variance helps in separating signal from noise. Evaluating sampling error is a mandatory step for a data-driven optimization strategy.
Can Sampling Error Cause False Winners in A/B Testing?
Yes, sampling error causes false winners in A/B testing when small samples show random variation as significant gains. The phenomenon inflates the risk of drawing incorrect conclusions about which version performed better. Adequate sample sizes and rigorous statistical testing are necessary to reduce the risk. Researchers must be wary of ending tests too early based on preliminary data. False winners lead to the implementation of suboptimal designs on a website. Most A/B testing platforms calculate sampling error to help users avoid these mistakes.
How Does Sampling Error Impact CRO Audits?
Sampling error impacts Conversion Rate Optimization (CRO) audits, visible in user engagement reports and heat map analyses, by distorting engagement metrics and the insights derived from them. Specific campaigns or pages appear better or worse than they actually are due to sample variability. Auditors must consider the presence of the error to ensure the accuracy of their recommendations. Small data subsets within the CRO audits are prone to inaccuracies. Recognizing the limitations leads to more realistic assessments of website performance. A thorough audit addresses the potential for sampling error in its data sources.
Why Must CRO Audits Account for Sampling Error in Engagement Metrics?
Conversion Rate Optimization (CRO) audits must account for sampling error because ignoring it misrepresents key metrics like bounce rate or click-through rates. Sample variability has the potential to exaggerate or hide trends that are crucial for optimization. Accounting for the fluctuations ensures that recommendations for improvement are based on reliable evidence. The engagement metrics derived from small traffic segments are vulnerable to the type of deviation. Analysts ensure that insights are not based on random noise. Understanding sampling error is essential for a high-quality website audit.
Can Sampling Error Skew Metrics Like Bounce Rate and CTR?
Yes, sampling error skews metrics like bounce rate and CTR when small or biased samples are used for analysis. Observed differences in the rates do not reflect the true performance of the entire user population. Ensuring an adequate sample size mitigates the issue and provides a more accurate view of user behavior. Metrics fluctuate between different days or traffic sources due to random chance. Analysts look for the bounce rate, long-term trends, rather than short-term spikes. Fluctuations in the KPIs are the result of sampling error in the dataset.
How Does Sampling Error Impact Analytics Tools?
Sampling error impacts analytics tools because these systems often rely on sample data to generate reports quickly. The reliance affects the reliability of the data, as reports over- or underestimate user behavior. Awareness of the limitations ensures that users interpret analytics data with the necessary level of caution. Some tools use sampling when the volume of traffic exceeds a certain threshold. Understanding how a tool handles data subsets is vital for accurate reporting. The presence of sampling error is a common feature in high-traffic web analytics tools.
Theory is nice, data is better.
Don't just read about A/B testing, try it. Omniconvert Explore offers free A/B tests for 50,000 website visitors giving you a risk-free way to experiment with real traffic.


