Taking the Pulse of eCommerce: the Real-time eCommerce Benchmark Report
Article last updated:
Article first published:
Take the pulse of eCommerce with the help of the Real-time eCommerce Benchmark Report, an overview of the data from +1000 e-stores in different industries.
The Real-time eCommerce Benchmark Report is a compilation of data from more than 1000 e-stores in different industries. What kind of data are we talking about, how did we get it and how can you use it for your business growth? And more importantly, where can you get it?
You can now access for free over 35 statistics to compare your e-store's KPIs against the industry benchmark.
Now you have the chance to see where you stand in terms of customer retention, customer segmentation, eCommerce analytics and customer behavior - an essential process for your store’s growth - by having a look over what has been going on in eCommerce lately, especially given the pandemic situation.
As an eCommerce entrepreneur, manager, or key player in the eCommerce game, these metrics help you make better decisions based on customer insights.
General eCommerce stats you should know
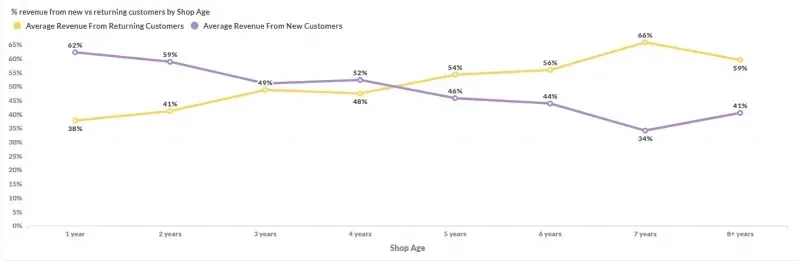
Percentage of revenue from new vs returning customers by shop age
How much revenue do eCommerce businesses get from new and returning customers?
From the data we collected from 1000+ e-shops by end of Q1, 2021, we concluded that 47% of revenue comes from returning customers, whereas 53% comes from acquired customers.
In the above graph, you can see that the first four years are more challenging when it comes to retaining more customers, which reflects in the revenue distribution between new versus recurring customers. So we bear the following question: is your store below or over the average according to your shop’s age?
Moving a bit further down the rabbit hole, the Pareto Principle has proved that 20% of repeat customers bring 80% of business margin which makes you wonder what happened to the other customers? That’s why we built this Real-time eCommerce Benchmark Report.
Here’s a sneak peek of the eCommerce benchmark
- According to the data we gathered from over 1000 e-shops, we noticed that the Average Customer Lifetime Value (CLV) is $239.
- Coming up next, we concluded that the Average Customer Retention rate is 23%.
- The Average Margin as a percent of the revenue is 41%.
- Last but not least, the Average Order Value (AOV) for the 1000+ shops we researched is $99.
The pulse of eCommerce at the end of Q1 in 2021
This is also a sneak peek, but up until the end of the first quarter of 2021, we noticed a few more detailed statistics on:
Customer behavior
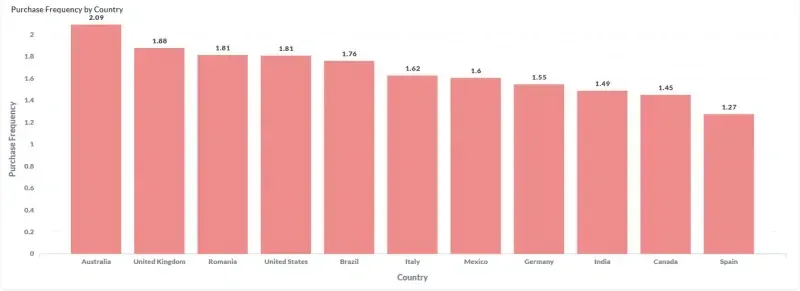
Purchase frequency by country
There's a slight difference in purchase frequency from a country to another, which reflects the average purchase frequency of a customer when it comes to online acquisitions.
For example, if the purchase frequency in the U.S. is 1.8, it means that the average online customer buys 1.8 times in their lifetime.
Customer Lifetime Value
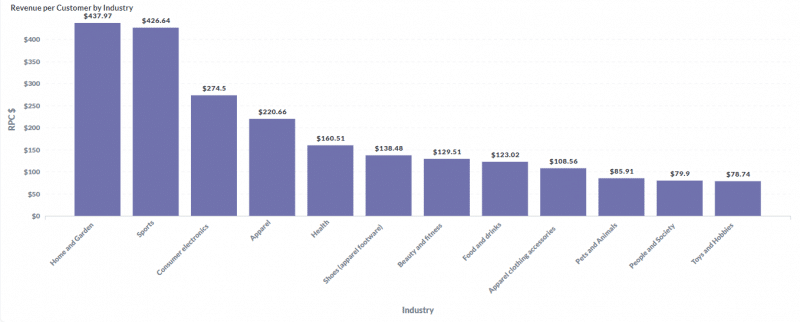
Revenue per customer by industry
This metric helps you see if you gather enough revenue from your customers compared to other stores in your industry.
The first three industries in this graph attract more people who are willing to spend more online compared to the stores in other industries.
Note: If your Revenue per Customer is below your industry average, you should look into your store’s data and see how you could improve the numbers.
Customer retention
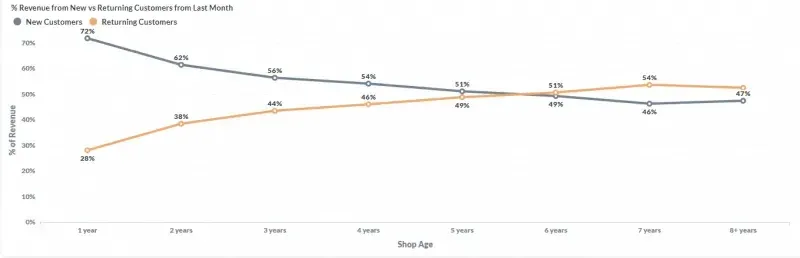
Percentage of revenue from new vs returning customers from the previous month
This chart shows real-time data for the previous month. If you look at this chart in May 2021, the chart reflects data from April 2021. Find the recent evolution of revenue of new versus returning customers by stores that have the same age as yours.
Note: Year after year, you should become more skilled at retaining new customers. But, if the last month's results are below your lifetime average, you should check the effectiveness of your recent marketing and sales efforts.
Customer segmentation
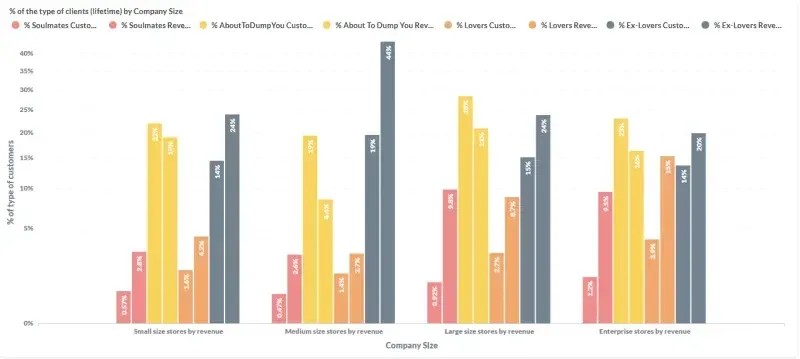
Percentage of the type of lifetime clients by company size
In this chart, you can see the percentage of each customer segment next to the revenue that it brings.
Note: If you have many customers in the About To Dump You segment, you could try to re-engage the ones with higher monetary values, but in the long term, your goal is to generate a better retention program and make sure that fewer customers end up in this segment.
eCommerce analytics
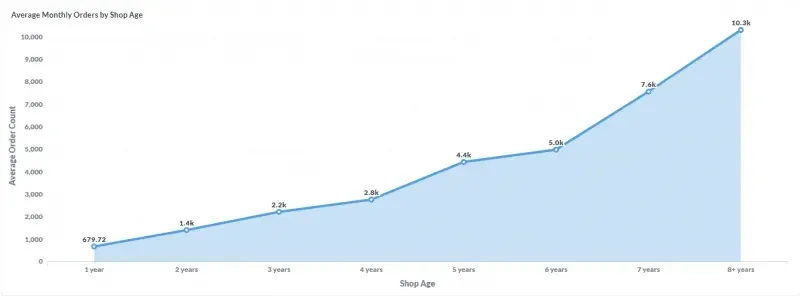
Average monthly orders by shop age
This chart shows you the monthly number of orders placed by Shop age. The trend clearly shows that stores succeed to generate more orders year over year, with a slight increase between year one and year six, and a sudden growth after year six. The most problematic period seems to be between years eight and nine.
Note: Take a look at how your average monthly orders evolved in time. There are many ways to generate more orders from new and existing customers, such as cross-selling, up-selling, loyalty programs, subscription-based purchases and/ gamification.
Each eCommerce business is different so you need to find what works best for your store and create a powerful strategy to influence the customers’ buying habits.
Tapping into the RFM segmentation
We have created an entire guide on Customer Value Optimization, where we included a whole chapter on RFM analysis and how segmenting your customers using this model can completely transform your eCommerce business.
Customer segmentation and analytics help you discover what pool of customers you should address right away and who you should transform into loyal customers. On top of this, it helps with better advertising targeting so you can attract more valuable new customers.
The Benchmark Report also includes statistics of the total revenue split between new and existing customers in eCommerce. This is where we calculated the percentage of customers by segment type, followed by the percentage of revenue by customer segment.
We then discovered an incredible statistic that shows that only 1% of the entire pool of customers are actually Soulmates, the most valuable customers. The Lover customers segment (the second most valuable customer segment) represents 3% of the total. Each of these segments generates 9% of the total revenue.
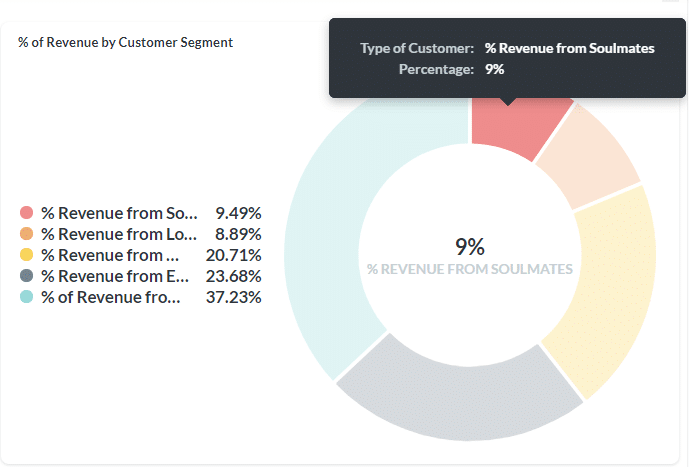
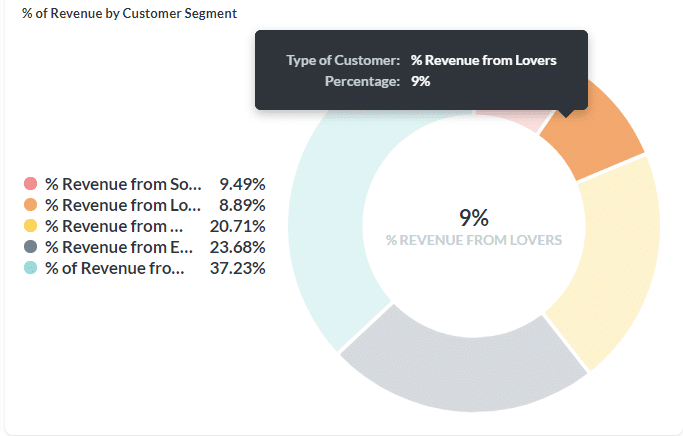
The conclusion is that the more Soulmates and Lovers a store retains, the bigger the chances to achieve a positive evolution across the most relevant eCommerce KPIs. Also, the most valuable customers, Soulmates and Lovers, are not high in numbers but generate an important part of the total revenue and are very important for sustainable business growth.
The top 4 customer segments that we analyzed include, of course, the Soulmates and Lovers, followed by Ex-Lovers and About to Dump You. These segments are some of the most important ones that a company should monitor to evaluate their business’s health.
- The Soulmates are your most valuable customers, that bought the most often and have spent the most in your online shop. Their latest order has been recently placed.
- The Lovers are the second most valuable customer segment, that haven’t spent as much as the Soulmate segment, but they bought from you recently and frequently. A piece of advice is that you could convince them to spend more with you.
- The Ex-Lovers are your former Soulmates, who have abandoned your website and are now inactive. You probably don’t know why they stopped buying!
- The About To Dump You segment includes your inactive customers that haven’t ordered for a while.
The names of these segments are inspired by love life and are part of a total of 11 default RFM segments that we’ve created for the Reveal app users. You can read all about them in our Customer Value Optimization guide.
Where did we get this data from?
The benchmark aggregates 100% anonymized data from more than 1000 eCommerce stores that use Reveal, our Customer Value Optimization app, to increase the number of loyal customers, improve Customer Lifetime Value, and maximize profits with automated RFM segmentation.
We keep this eCommerce benchmark updated with aggregated data from our 1000+ clients, all eCommerce businesses that are measuring key performance indicators automatically with the help of Reveal.
How can this data help your business?
In short, the real benefits of this eCommerce platform are:
- A clear overview of your customers and business
- The ability to create better-targeted campaigns in the future
- Knowledge on exactly what to offer and who to offer
- Refining your assortments based on NPS results
- Helping you create awesome loyalty programs
As such, you can evaluate your business and get insights about how you should adjust strategies for improved customer retention, on all levels of your eCommerce company, from customer experience to digital marketing strategy.
Get free access to over 35 statistics to compare your e-store's KPIs against the industry benchmark!
Short FAQ
How do I interpret this eCommerce data? We offer you the interpretation and explanation for each report. Ideally, make sure you already have your eCommerce store data to compare each performance indicator. If you are missing data, you can connect your store to Reveal and it will generate your KPIs automatically. Remember that your eCommerce business is unique and use the benchmark report to put things into perspective, not to set unrealistic expectations.
We offer you the interpretation and explanation for each report. Ideally, make sure you already have your eCommerce store data to compare each performance indicator. If you are missing data, you can connect your store to Reveal and it will generate your KPIs automatically. Remember that your eCommerce business is unique and use the benchmark report to put things into perspective, not to set unrealistic expectations.
How do I access these statistics for my store? You can export existing data from your eCommerce analytics platforms, calculate KPIs manually where data is not available, or get them automatically by connecting your eCommerce store to Reveal. Reveal will then deliver customer retention insights for your eCommerce business by showing you automated customer reports. Ideally, you can access real-time data from the analytics platform you are using for your eCommerce store. In this way, you can spend less time aggregating data and more time on tasks with a direct impact on your business goals.
You can export existing data from your eCommerce analytics platforms, calculate KPIs manually where data is not available, or get them automatically by connecting your eCommerce store to Reveal. Reveal will then deliver customer retention insights for your eCommerce business by showing you automated customer reports. Ideally, you can access real-time data from the analytics platform you are using for your eCommerce store. In this way, you can spend less time aggregating data and more time on tasks with a direct impact on your business goals.


If you liked this article, make it shine on your page :)