The Most-Copied Ad Structure of September 2026: Over 1,000 Brands Filmed the Same Shot. Did You?

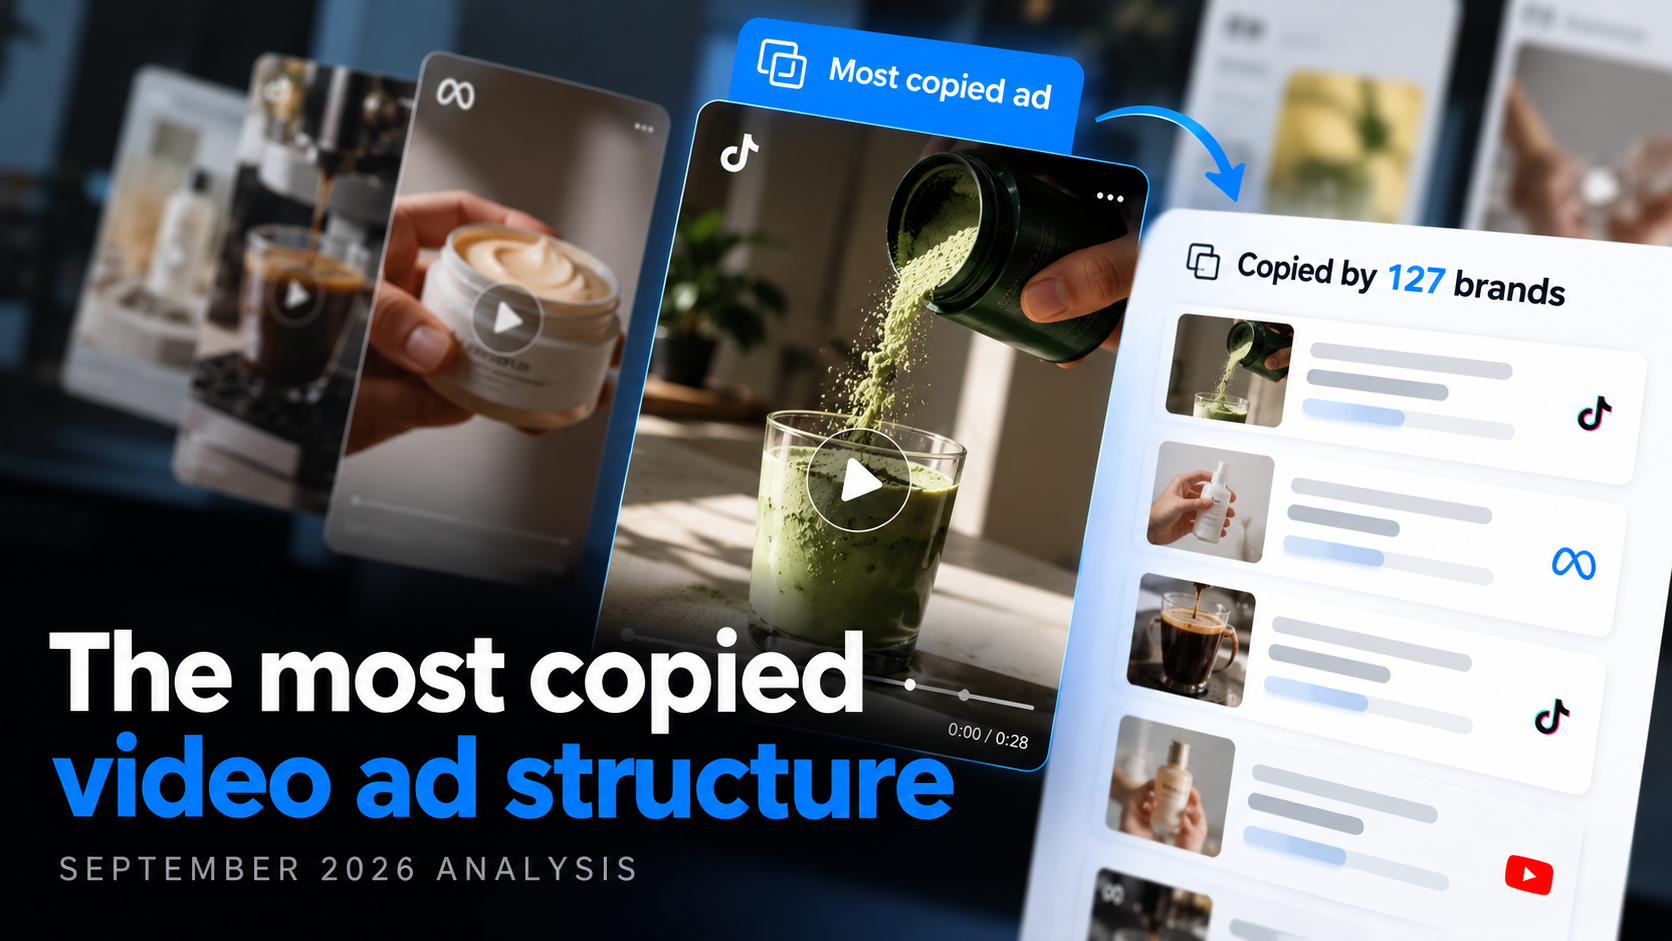
Scope: every industry and country the eCommerceBenchmark Ad Library tracks, 2,573 brands, and the 68,341 ads active in September 2026, read against the previous month, August 2026. This cut has no per-industry or per-country split, and every share counts all of the month's ads as its base.
Picture a thousand brands, in a thousand offices, all filming the same shot.
Product held up. Label facing the camera. Words on top. Nobody planned it together. It just happened.
That is the story of September 2026. Most ad reports ask which ad structure fills the most feeds. We asked something sneakier: which one do the most brands use? Count ads, and you learn what fills a feed. Count brands, and you learn what the market really shares.
Why does that matter? Because one brand running a shape forty times looks nothing like forty brands each trying it once. The first is a habit. The second is a crowd. And we only found out which is which by counting heads.
- If your ad looks like everyone else's, a shopper can't tell whose it is. Over a thousand brands ran the same staging this month, so the first line and the proof have to do the work.
- Some shapes are habits and some are still experiments. Knowing which is which tells you where it is safe to copy and where there is room to stand out.
- You can check your own account in one sitting. Sort twenty ads into four piles, and the empty pile is your next shoot.
A creative concept is defined as the way an ad is staged on screen: what the viewer sees and how it is shot, not the file format. A brand count is defined as the number of tracked brands with at least one ad in that concept during the month. Here, most copied means run by the most brands. One fair warning: the data shows how many brands use a structure, not who copied whom. Nobody is accused of anything.
So who is on top, and by how much? Let's count the heads.
Brands and ads tell different stories
We added one extra number to the ranking: ads per brand. A high number means the brands in a concept run it a lot. A low one means many brands each ran only a few ads, which looks like testing. Ads per brand is our calculation.
Brands running each concept, September 2026. A brand counts if it had at least one ad in that concept during the month. Source: eCommerceBenchmark Ad Library, 2026.
Now flip the lens. Same ten concepts, but this time: how many ads did each brand run, on average?
Ads per brand, our calculation from each row's own ads and brands. Source: eCommerceBenchmark Ad Library, 2026.
Product Demo Close-Up is the only one with a big crowd that also goes deep. A thousand brands, about six ads each. That is a habit.
Side-by-Side Comparison sits at the other end. Its 484 ads are spread over 262 brands, so most of those brands have two ads in the lane and nothing more. Montage is the odd one out the opposite way: 634 ads from only 173 brands, so the few brands in it run it often instead of trying it once. And Cinematic B-roll, second by brands, ran 3,326 ads at 744 brands, about 4.5 each.
| Concept | Brands | Ads in September | Ads per brand | September share | Ran 60+ days (sample) |
|---|---|---|---|---|---|
| Product Demo Close-Up | 1,067 | 6,208 | 5.8 | 9.1% | 52.8% |
| Cinematic B-roll | 744 | 3,326 | 4.5 | 4.9% | 35.1% |
| Customer Testimonial Reel | 305 | 675 | 2.2 | 1% | 49.8% |
| Side-by-Side Comparison | 262 | 484 | 1.8 | 0.7% | 50.4% |
| Offer-first banner | 212 | 737 | 3.5 | 1.1% | 35.1% |
| Montage | 173 | 634 | 3.7 | 0.9% | 26% |
| UGC Unboxing | 158 | 301 | 1.9 | 0.4% | 45.8% |
| Grid swap | 148 | 224 | 1.5 | 0.3% | 67.4% |
| Selfie talking-head | 114 | 259 | 2.3 | 0.4% | 28.6% |
| Problem agitation | 39 | 113 | 2.9 | 0.2% | 23.9% |
Enough maths. Let's meet the three shapes most brands run, one at a time, starting with the king.
The three concepts most brands run
One honest note first. The library files each ad under one concept and gives no shot-by-shot breakdown. So every "what it looks like" below, and every shot list, is our reading from the concept's name and the words of the ads filed under it. Peek at a few of the ads yourself before you brief anyone.
1. Product Demo Close-Up: one product held in frame while the words do the pitch
What it looks like. One product sits in the middle of the frame, close enough that a shopper can read the label. Nothing in the picture explains the offer, so the words carry it: what the thing is, who it is for, or a count of reasons to own it. This is our reading of the staging, not a description of any one ad.
What it tells you. 1,067 brands ran it, and across its 6,208 ads that is about 5.8 each. That reads as a habit, not a test. Its share of all September ads was 9.1%, and in August it was 9.1% as well. So this lane is dug in, not climbing.
It also has the most staying power of the three. In the library's longevity-ranked sample, 52.8% of its ads ran sixty days or more [eCommerceBenchmark Ad Library, 2026]. So plan to keep one live for a stretch, not a week. (That is time on air, not sales.)
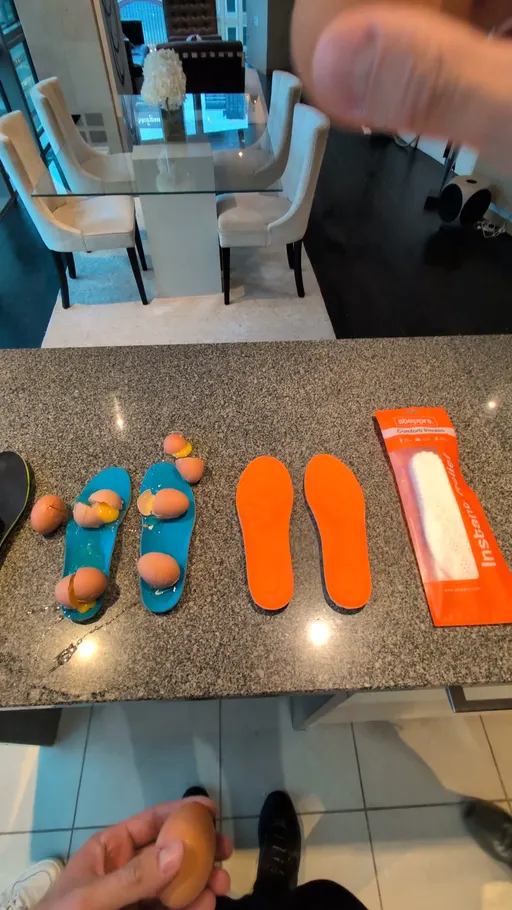


Look at how each one opens. stepprs.com opens on what the thing is and what it is for: "This is Stepprs, the viral insoles that relieve your foot pain instantly." bellroy.com opens on a count of reasons to take its sling travelling. And comme-avant.bio opens on the street where its shop is. Same staging, three very different first lines.
The king is a close-up with words. What if the ad has no words at all, and no one looking at the camera? That is shape number two.
2. Cinematic B-roll: staged scenes with nobody speaking to the camera
What it looks like. A setting carries the ad, and nobody turns to the camera to explain it. The product is placed inside the scene instead of held up to the lens. A short line of words sits over the top, often a mood or a collection name instead of a feature. Our reading, from the concept's name and its ads' own words.
What it tells you. 744 brands ran it across 3,326 ads, about 4.5 each. So it is wide and reasonably deep. Its share was 4.9% of September ads against 4.6% in August.
The staying power is lower. In the longevity-ranked sample, 35.1% of its ads ran sixty days or more, well under the leader. So expect to refresh a scene sooner than you refresh a product shot.
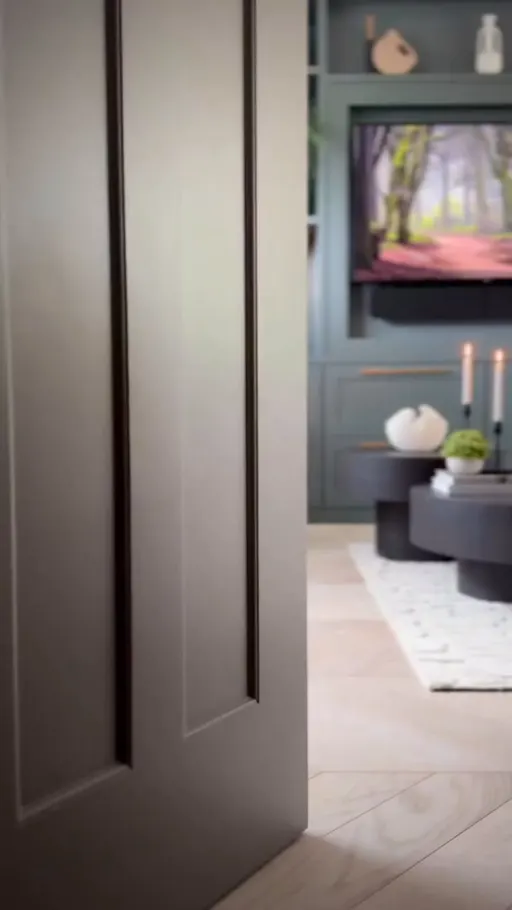



olivias.com names what the scene is doing: "Adding texture to an interior." guerlain.com gives a product name and nothing else. The two French ads reach further. wee-bot.com opens on being slowed down, and gemmyo.com on a collection coming back.
The first two shapes are brand-led. The third hands the microphone to someone who is not on your payroll.
3. Customer Testimonial Reel: a shopper's own sentence carries the ad
What it looks like. A customer's own words are the loudest thing on screen, with the person and the product together underneath or beside them. The product is not the subject of the picture. The sentence is. Our reading, drawn from the concept's name and the lines its ads open on.
What it tells you. 305 brands ran it across 675 ads, about 2.2 each. That reads as a lot of brands each trying it a couple of times, not a habit. Its share was 1% of September ads against 0.9% in August.
Here is the interesting bit. In the longevity-ranked sample, 49.8% of its ads ran sixty days or more. That is close to the leader. So the ones brands do make tend to stay up.



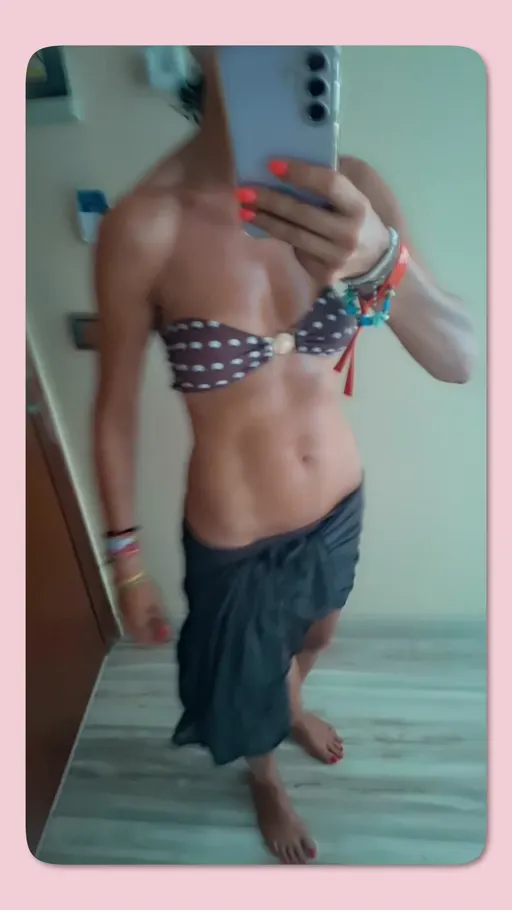
montelleintimates.com keeps the shopper's own words: "I love how these chemises support the girls. Comfortable and pretty!" gaala.com uses a flat invitation to judge for yourself. nupo.ro opens as a question a shopper would ask out loud. And epycure.com opens on the figure its own line states.
Those are the big three. But the market is not standing still. Did anything move this month? Yes, three smaller lanes. Read on.
What moved in September
The widest concepts barely moved. Product Demo Close-Up held at 9.1% of all ads in September and 9.1% in August. The month's movement came from smaller lanes with fewer brands behind them.
A mover on this page is a concept whose share moved by a fifth of a point or more since August, up or down. That threshold is our line, not the library's. None of the concepts we track fell by that much. Side-by-Side Comparison, for one, held at 0.7% in both months [eCommerceBenchmark Ad Library, 2026].
Change in share of all ads, September vs August 2026, in percentage points. Nothing on the other side of the line: no tracked concept fell by a fifth of a point or more. Source: eCommerceBenchmark Ad Library, 2026.
| What moved | Before → after | Change | Ads | Brands |
|---|---|---|---|---|
| Montage (concept) | 0.6% → 0.9% | ▲ 0.3 pt · +50% | 634 | 173 |
| Cinematic B-roll (concept) | 4.6% → 4.9% | ▲ 0.3 pt · +7% | 3,326 | 744 |
| Offer-first banner (concept) | 0.9% → 1.1% | ▲ 0.2 pt · +22% | 737 | 212 |
Let's take the two small risers with ads in them. First, the one that works like a shop window.
Montage: it keeps giving the eye somewhere new to land
A montage is defined as a string of short cuts that puts several moments in front of a shopper one after another. It held 0.6% of all ads in August and 0.9% in September, on 173 brands. Next to the leader's 1,067 brands, that is a small lane, and the brands in it are a thin slice of the market.
Why might a shopper stay with one? Each new moment gives the eye somewhere else to land, so there is no single picture to decide about. It works a little like flipping a rail of clothes in a shop. You are not reading anything. You are just seeing the next thing, and then the next. That is our reading of the staging. It is not a claim that the staging works.
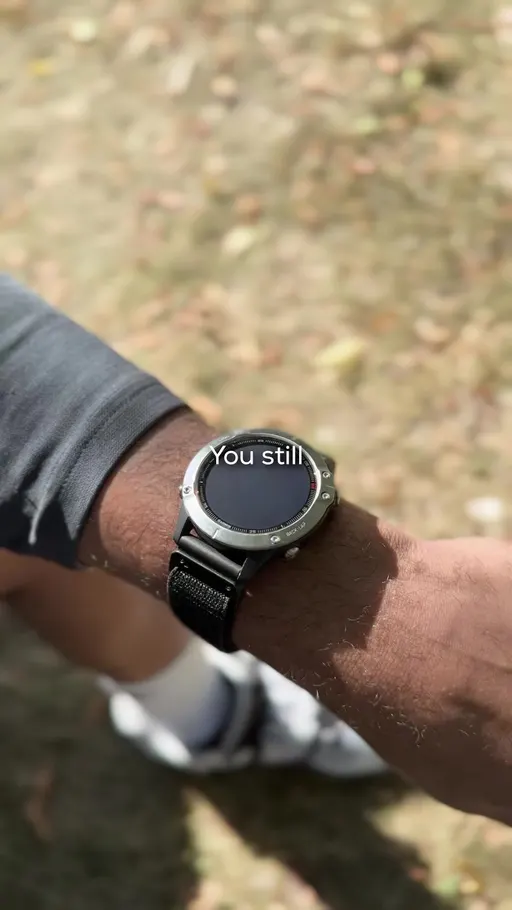

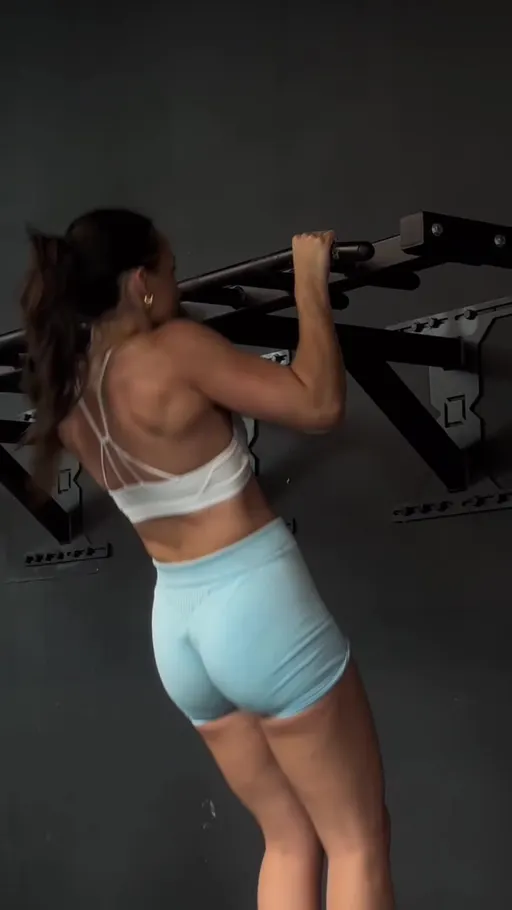
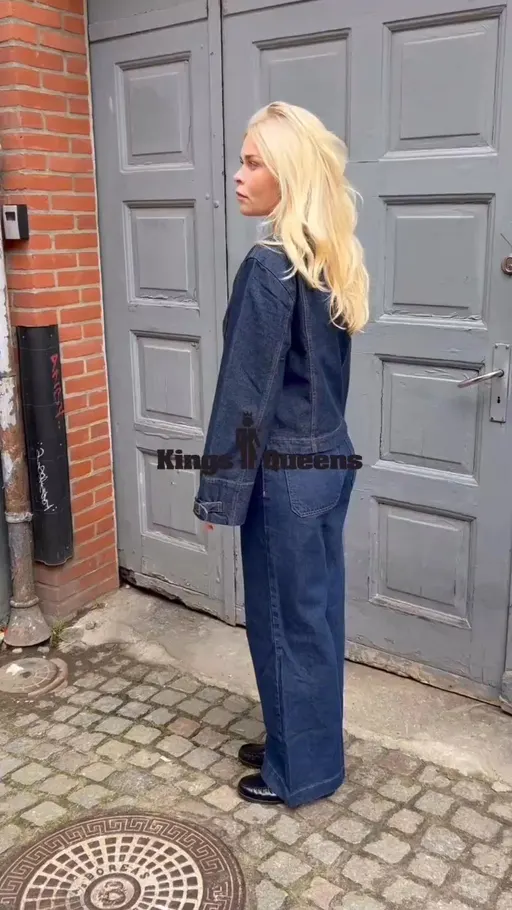
strapsco.com asks if you want to change your watch without breaking the bank, and puts a buy-2-get-1-free line on it. designbysi.dk is a travel diary: what the shopper wore in Marrakesh. feelreformed.com tells a 30-day story, and kingsqueens.dk sells the sheer size of its choice. Four montages, four very different first lines.
From a rail of clothes to a shop window sticker. Next lane: the deal itself.
Offer-first banner: it hands a shopper a number to judge in one glance
An offer-first banner is defined as a layout where the deal itself is the biggest thing on screen. It held 0.9% of all ads in August and 1.1% in September, on 212 brands. That is fewer brands than Customer Testimonial Reel's 305, despite the larger share of ads. So a few hundred brands are making a lot of these.
A number is the one thing on a screen a shopper can judge without reading a sentence. It is the shop window sticker: you know in a glance whether to go in. There is nothing to work out and nothing to believe. Our reading again, and the library cannot tell you what any of it earned.




hawkersco.com puts the deal in the biggest words it has, and glamnetic.com does the same with a mix-and-match price. deteca-barcelona.com gives the reason for its promotion first: a warehouse move. And blissim.fr opens on a category instead of a deal, which shows how far the staging varies inside one concept.
Now the fun part. We have seen the shapes. What would you actually do with them on Monday?
A shoot to brief this week: one day, three concepts
The three concepts most brands run do not need three shoots. One half-day gives you all three: the product held in one frame, the staged scene, and a customer's own sentence. This is our suggestion, built from the brand table. The library cannot say it will work, which is why it is a test.
The half-day plan
- Film the product held in one frame. Your single best seller, close enough that the label reads, nothing else in shot.
- Film the staged scene. The same product in the room it gets used in, nobody turned to the camera, and the line you want over it written before you start.
- Record the customer's own sentence. One review you already have, kept in the exact words the customer used.
- Cut three ads from the one half-day. One per concept, same product, three different first lines.
- Test all three against your current best ad. Two weeks, one audience, an even split of budget, judged on cost per purchase and never on clicks.
Each outcome teaches you something. If the customer's own sentence wins, you are in a lane only 305 brands ran in September while 1,067 ran the product held close [eCommerceBenchmark Ad Library, 2026]. If the leader wins, the crowded default is still the right default for your account, and your next shoot is a better version of it, not a different one. Both are useful answers.
Skip the spreadsheet
The eCommerceBenchmark Ad Library reads your ads, files each one under a concept, and shows your mix beside the market.
Check my concept mixOne more question is bugging us. If everyone shoots the same shape, what is left to stand out with?
When everyone shoots the same shape
Most brands brief the staging the rest of the market already runs. With the leader running at 1,067 brands in September [eCommerceBenchmark Ad Library, 2026], the staging alone no longer tells a shopper whose ad they are looking at. When ads look alike, price is the only thing left on screen to compare.
So what sets an ad apart? Its first line and its proof. A concept few brands have scaled costs the same to test, as long as it is tested before anyone switches the whole account over.
Here is a ten-minute check you can do at your desk. Think of it as tidying your sock drawer, but for ads.
Sort your last twenty ads
- Make four piles. One for the product held in one frame, one for the staged scene, one for the customer's own sentence, and one called other. Sort your last twenty ads.
- Count each pile. Do it in one sitting, by eye, and write the counts down.
- Make the empty pile your first test. Find the pile with nothing in it that matches something you already own: a product you can shoot close, a room you already use, a review already on your site. That is the shoot to brief.
A wide concept is a popular brief, not a proven one. The eCommerceBenchmark Ad Library holds no spend, sales or profit data. So a brand count shows what brands tried and how long they kept it up, never what it earned.
Your test card
Here is the first test from this article, set up the way a media buyer would run it. Fill in the blanks with your own numbers, and write them down before you launch.
| Hypothesis | An ad that opens on a real customer sentence will cost less per purchase than my product close-up. |
| Change only this | The first line: a customer's exact words. Keep the product shot. |
| Keep the same | Product, offer, audience, placement and budget split. |
| Funnel stage | Say first whether this ad is for prospecting (cold) or retargeting (warm). A deal in the first line is often right for warm audiences and wrong for cold ones, so test it where the ad will really run. |
| Setup | One control and one variant, same audience, same placement, even budget split. Do not edit either ad while the test runs. |
| How long and how much | Until each version has about 50 purchases, or two full weeks, whichever comes later. This is general testing practice (Meta's own learning-phase guideline is about 50 results per ad set per week), not a library finding. |
| Success metric | Cost per purchase, not clicks. |
| Stop rule | Pause a variant that has spent about 3 times your target cost per purchase with no purchase. If it is close, keep it running. |
| What counts as a win | The variant beats the control on the metric by an amount you would act on, and still does in a second week. |
Key takeaways
- 1,067 brands ran Product Demo Close-Up in September 2026. That is about 5.8 ads each across its 6,208 ads [eCommerceBenchmark Ad Library, 2026], the one staging the market shares.
- Cinematic B-roll was second by brands at 744. Customer Testimonial Reel was third at 305, clear of Offer-first banner's 212.
- Side-by-Side Comparison spreads thinnest, 484 ads. Those sit at 262 brands, about 1.8 each, which reads as sampling.
- Montage held 0.6% of all ads in August and 0.9% in September, on 173 brands.
- One half-day covers all three of the widest concepts: the product held close, the staged scene, the customer's own sentence. Cut three ads, then run them against your control for two weeks on cost per purchase.
- Sort your last twenty ads into four piles, one per concept above plus other, and make the empty pile that matches something you already own your first test.
Questions
Film one half-day, then cut three ads out of it: the product held in one frame, the staged scene, the customer's own sentence. Run all three against your strongest current ad for two weeks, one audience, an even split of budget, judged on cost per purchase. Product Demo Close-Up is the control, because 1,067 brands already run it. Customer Testimonial Reel is the one with room to surprise you, because only 305 do. You are not looking for a winner this month. You are looking for the pile in your account that nobody filled.