Predictive Customer Lifetime Value: How to Forecast CLV

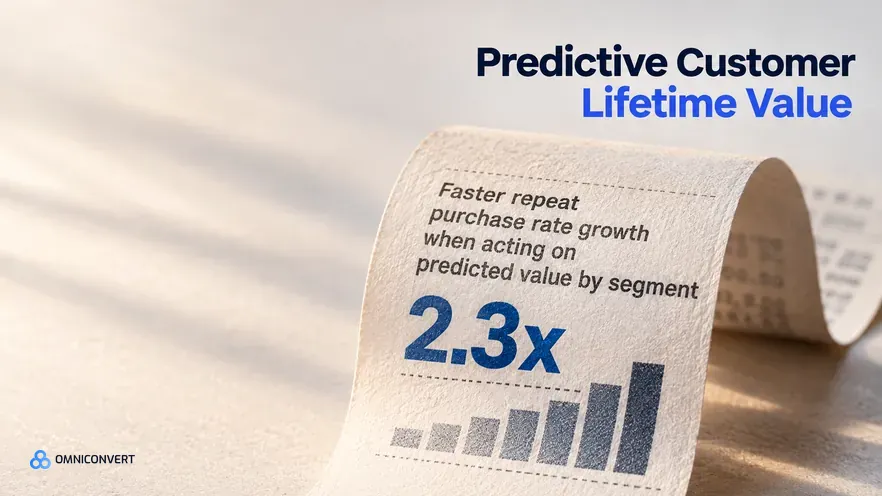
- Predictive customer lifetime value forecasts a customer's future profit from early signals, while historical CLV only totals what they already spent.
- The classic AOV times frequency times lifespan formula blends everyone into one average and hides the heavy tail where most future value sits.
- The standard non-contractual method pairs a BG/NBD model (future purchase count) with a Gamma-Gamma model (order value), discounted over a horizon.
- A forecast is only worth building if something acts on it: cap acquisition bids to predicted value, trigger retention on decile drift, prioritize top deciles.
- Across the CROBenchmark dataset, brands that acted on predicted value by segment grew repeat purchase rate 2.3x faster than those watching a blended number.
Predictive customer lifetime value is a forecast of the total future profit a customer will generate, built from early behavioral signals rather than a total of past orders. It matters because direct-to-consumer unit economics are broken on the first purchase: the average brand loses roughly $29 on a new customer, and the profit lives in the second and third order [Swell, 2026]. Across the 7,000+ stores in the CROBenchmark dataset spanning 15+ industries, brands that acted on predicted value at the segment level grew repeat purchase rate 2.3x faster year over year than brands that watched a single blended CLV [CROBenchmark Report 2026, Omniconvert].
Nexus by Omniconvert is the AI eCommerce growth engine that forecasts lifetime value by segment and turns it into ranked actions. This guide covers what predictive CLV is, why the old formula quietly misleads, how the BG/NBD and Gamma-Gamma models work without the math degree, the signals that make a forecast trustworthy, what the forecast lets you do, the trap of prediction without a decision loop, and how to start on a Shopify stack.
What is predictive customer lifetime value?
The distinction is not academic. Historical CLV tells you what a cohort was worth; predictive CLV tells you what a customer bought last week is likely to be worth over the next year, when you still have time to change the outcome. One is a receipt, the other is a plan.
Churn probability is defined as the modeled likelihood that a customer has silently stopped buying, expressed as a number between zero and one. In ecommerce this cannot be observed directly, because nobody cancels a store the way they cancel a subscription, which is exactly why it has to be inferred from behavior rather than read off an account status. Predictive CLV folds this probability into every forecast: a customer with high recent frequency but a lengthening gap since their last order carries a rising churn probability and, therefore, a falling predicted value, long before the revenue actually disappears.
| Dimension | Historical CLV | Predictive CLV |
|---|---|---|
| Time direction | Backward: totals past orders | Forward: forecasts remaining lifecycle |
| Unit of analysis | Usually one blended average | Per customer or per segment |
| Handles churn | No: assumes the past continues | Yes: models dropout probability |
| Best used for | Reporting what happened | Pricing acquisition and retention decisions |
Why does the old CLV formula mislead DTC teams?
Sam Savage's Flaw of Averages is the mental model that explains the damage: any plan built on the average of a skewed distribution is wrong in a predictable direction. Because customer value is heavy-tailed, the average predicted lifetime value sits well above the median customer and well below the whales. Acquire against that average and you overpay for the many low-value buyers and underpay to keep the few high-value ones. The formula is not merely imprecise; it is biased toward the wrong decision.
The deeper problem is the word lifespan. The deterministic formula treats it as a single number applied to everyone, when in reality each customer has their own latent purchase rate and their own moment of silent departure. This is the insight behind Peter Fader and Bruce Hardie's "buy-till-you-die" school of customer-base analysis: model each customer as an individual who buys at some private rate until an unobserved moment when they stop, rather than assuming a shared lifespan. That is the conceptual leap from a formula to a forecast, and it is why the probabilistic approach beats the arithmetic one in plain business terms, not just statistical ones.
The stakes are set by the market. Acquisition cost has climbed 40 to 60 percent since 2023 to roughly $68 to $84 on average [Mobiloud, 2026], while the median DTC brand runs an LTV to CAC ratio of about 2.3, with gross margins of 40 to 60 percent capping the upside [Enrich Labs, 2026]. When the margin for error is that thin, pricing every customer at the average is how a brand quietly buys unprofitable growth.
How do predictive CLV models work?
Most ecommerce is "non-contractual": customers can leave without telling you, unlike a gym membership or a SaaS seat. That single fact rules out simple churn accounting and is why the field standardized on two models that work together.
- BG/NBD (Beta-Geometric / Negative Binomial Distribution): forecasts the number of future purchases. It assumes each customer buys at their own rate (spread across the base as a gamma distribution) and, after any order, has a fixed probability of becoming inactive forever (spread as a beta distribution). This is the formal version of "buy-till-you-die."
- Gamma-Gamma: forecasts the average monetary value of those purchases, assuming order value varies across customers but is independent of how often they buy.
Put together, predicted CLV equals expected number of transactions multiplied by expected profit per transaction, discounted back over your chosen horizon [Towards Data Science, 2026]. The inputs are humble: each customer's recency, frequency, and monetary value, plus how long they have been a customer. You do not need a data-science team to grasp the shape of it, and you do not need hundreds of behavioral columns; you need clean order history and the discipline to read the output as a distribution.
Which signals make a CLV forecast trustworthy?
Recency, frequency, and monetary value, the same three dimensions behind RFM scoring, are the load-bearing signals. Recency does the heaviest lifting, because a lengthening gap since the last order is the earliest observable sign of rising churn probability. Frequency calibrates each customer's purchase rate, and monetary value feeds the Gamma-Gamma side. Everything else is secondary.
Two conditions decide whether to trust a number. First, cohort maturity: forecasts for customers with only one order are wide-ranged guesses, while those with several orders are tight. Second, first-order behavior: the discount level, product, and channel of the first purchase strongly shape a cohort's trajectory, which is why a brand should read predicted value by acquisition cohort, not just in aggregate. Accuracy improves with cohort depth, not with more fields, so the fastest path to a trustworthy forecast is time and clean data, not a wider schema.
See predicted lifetime value by segment, who is drifting toward churn, and which action protects the most profit.
Learn more about Customer Intelligence in Nexus →What does predictive LTV let you do?
The forecast becomes leverage in three places:
-
Cap acquisition bids to predicted valueExport high-predicted-value segments as lookalike audiences and set bid ceilings by expected CLV, so you spend more to win customers who will be worth it and stop overpaying for the ones who will not return.
-
Trigger retention on decile driftWhen a high-value customer's predicted value starts falling, usually a recency signal, intervene before they lapse, when a win-back still costs a fraction of a fresh acquisition at $68 to $84.
-
Prioritize your top decilesRoute inventory, concierge service, early access, and your best offers to the deciles carrying the heavy tail of future profit, rather than spreading effort evenly across a base where value is anything but even.
This is the Customer Value Optimization loop applied to a forecast: predict, decide, execute, then measure the change and predict again. A structured version of that loop is what drives results you can point to. AliveCor used Omniconvert to run a structured A/B testing programme and achieved a +21% conversion rate, +5% revenue per visitor, and 94% statistical relevance across their experiments [Omniconvert, AliveCor case study] — the same discipline of tying a measured signal to a deliberate action, rather than admiring the metric.
Why does a prediction without a decision loop fail?
The DTC brands that plateau at a 2.3 LTV to CAC ratio consistently share one pattern: they invest in forecasting lifetime value and then let the number sit in a dashboard, reviewed weekly and acted on never. The benchmark gap closes fastest when operators treat the predicted-value forecast as the trigger for a specific action, an acquisition bid cap or a retention play, not as a metric to report. A forecast measured but unwired is a lagging indicator wearing a leading indicator's clothes.
In our CVO work with ecommerce brands through 2026, we repeatedly find that the constraint is never the model's accuracy; it is the missing wire from the forecast to the action [Omniconvert, 2026]. Two brands can run the identical BG/NBD and Gamma-Gamma pair and get opposite returns, because one caps its Meta bids by predicted decile the same afternoon and the other exports a slide. The line worth remembering: a CLV forecast you cannot act on is a horoscope, precise, confident, and useless.
How do you start forecasting CLV on a Shopify stack?
The practical sequence is shorter than most teams expect:
- Assemble the data: a few hundred repeat customers and roughly twelve months of orders is enough to estimate the purchase-rate and dropout distributions. You need order dates, values, and a customer key, not a warehouse of attributes.
- Fit the model: the BG/NBD plus Gamma-Gamma pair is the non-contractual standard and is available in well-maintained open-source libraries. Score each customer's expected transactions, expected order value, and churn probability.
- Read it by decile: rank customers into value deciles rather than trusting any single-customer figure. Directionally useful early, precise later; treat individual numbers as ranges until cohorts deepen.
- Wire two decisions: one at the top of the distribution (protect and grow the top deciles) and one at the bottom (cap acquisition spend on look-alikes of low-value cohorts).
"Good" accuracy is not a single-customer number matching reality; it is the decile ranking holding up out of sample, so the customers the model calls valuable actually are. Judge the forecast by whether it sorts customers correctly, because sorting is what your acquisition and retention decisions depend on. As cohorts mature, the same model tightens on its own, and the loop from prediction to action, not a better algorithm, is what compounds the return.
Predictive customer lifetime value FAQ
Predictive customer lifetime value is a forecast of the total future profit a customer will generate, produced by statistical or machine-learning models from early behavioral signals such as recency, frequency, and first-order value. Historical CLV only totals what a customer has already spent, a backward-looking record. Predictive CLV estimates what they will be worth across their remaining lifecycle, which is the number you acquire and budget against, because you cannot plan growth on the past alone.
Most ecommerce setups are non-contractual, meaning customers can leave silently, so the standard approach pairs a BG/NBD model, which predicts how many future purchases a customer will make, with a Gamma-Gamma model, which predicts their average order value. Multiply expected transactions by expected profit per transaction, then discount over a horizon such as twelve months. The result is a per-customer forecast rather than a single blended average across the whole base.
The classic formula is retrospective and blends every customer into one average, which hides the heavy tail where most future value sits. A small share of customers carries most of the profit, so an average predicted lifetime value describes a customer who does not exist and misprices both acquisition and retention. Predictive CLV keeps the distribution intact by forecasting at the individual or segment level, so you act on the customers who actually drive the number.
Probabilistic models are built for sparse, non-contractual data, so you need less than teams expect: typically a few hundred repeat customers and roughly twelve months of order history to estimate purchase-rate and dropout distributions. Accuracy improves with cohort depth, not with more columns of customer attributes. A young brand can start forecasting early, as long as it reads single-customer numbers as ranges and acts at the segment or decile level until cohorts mature.
A forecast only creates value when it changes an action before the outcome is locked. Cap acquisition bids to each segment's predicted value, so you never overpay for low-value customers. Trigger retention on high-value customers whose predicted value is drifting down, while winning them back is still cheap. Prioritize inventory, service, and offers for your top deciles. The number itself is inert; the decision it changes is where the return lives.
Nexus by Omniconvert ingests behavioral and transactional data across your store to forecast lifetime value at the segment level and flag which customers are at risk, growing, or ready for upsell in real time. It then maps those forecasts to ranked actions, so marketing budget targets customers worth retaining rather than those easiest to reach. The forecast does not stop at a dashboard; it becomes a prioritized queue of retention and acquisition moves tied to predicted profit.
Predictive customer lifetime value earns its keep only when it changes a decision before the customer's value is locked in. The math is settled: a BG/NBD and Gamma-Gamma pair turns twelve months of orders into a per-segment forecast, and brands that act on it by segment grow repeat purchase rate about 2.3x faster than those watching a blended number. The gap is never the model; it is the loop from prediction to action. Start by forecasting one thing this month, your top and bottom value deciles, then wire a single decision to each, an acquisition bid cap and a retention trigger. See how Customer Intelligence in Nexus closes that loop.
Forecast CLV, then act on it with Nexus
Nexus by Omniconvert forecasts customer lifetime value at the segment level, flags who is drifting toward churn, and ranks the retention and acquisition moves tied to predicted profit. Stop letting a forecast sit in a dashboard and start acting on the customers worth keeping.