Customer Lifetime Value: Formula & How to Grow It (2026)

- Customer lifetime value (CLV) is the total revenue, or profit when margin-adjusted, a customer generates over their whole relationship with a business.
- The formula is average order value multiplied by purchase frequency multiplied by customer lifespan, then by gross margin for a profit-based CLV; subscriptions use monthly revenue per customer divided by churn rate.
- The CLV to CAC ratio matters more than absolute CLV: about 3 to 1 is healthy, below 2 to 1 loses money, above 5 to 1 signals underinvestment in growth.
- Grow CLV by raising retention, order value, and frequency, cutting churn, and tracking it per RFM segment rather than as a blended average.
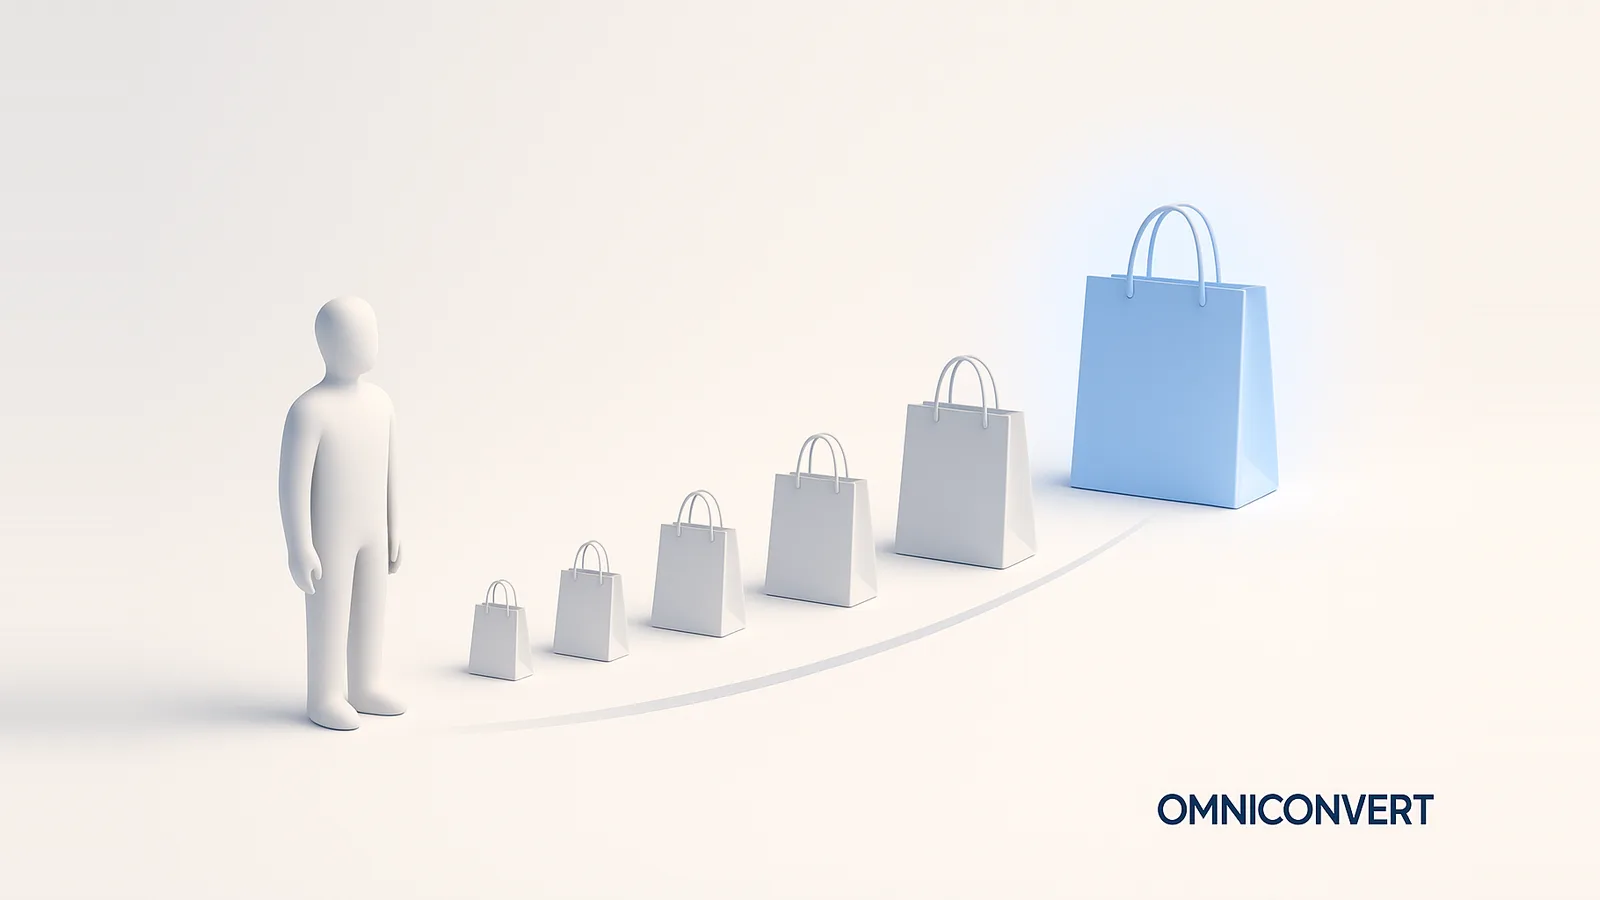
- The Omniconvert CLV Framework (measure, segment, predict, act) plus Nexus by Omniconvert turn CLV into a ranked queue of growth actions.
Customer lifetime value (CLV) is the total revenue a customer generates over their entire relationship with a business, and the total profit once it is adjusted for gross margin. It is arguably the most important metric in eCommerce because it tells you how much you can afford to spend to win and keep a customer. Across the CROBenchmark dataset of 7,000+ websites in 15+ industries, against 248+ audit criteria, brands that tracked CLV at the customer-segment level grew repeat purchase rate 2.3x faster year over year than brands that tracked only a blended CLV, drawing on 13 years in eCommerce conversion rate optimization [CROBenchmark Report 2026, Omniconvert].
Nexus by Omniconvert is the AI eCommerce growth engine that calculates customer lifetime value at the segment level and turns it into ranked actions. This guide covers what CLV is, how to calculate it with the formula, benchmarks by category, why it matters, the Omniconvert CLV Framework, how to grow CLV, and how RFM segmentation makes it actionable. Every section answers the question directly, then goes deeper.
What is customer lifetime value (CLV)?
The word that matters most in the definition is lifetime. Most metrics measure a single transaction; CLV measures the whole relationship, which is why it reframes a customer from a one-time sale into an asset with a value you can grow. A business that optimizes for the first order and a business that optimizes for lifetime value make very different decisions about discounts, acquisition, and service.
It is also forward-looking. Historic CLV totals what a customer has already spent, but the useful version is predictive: an estimate of what they will be worth across their remaining lifecycle, based on how they buy. That projection is what you acquire against and budget against, because you cannot plan growth on a number that only looks backward.
How to calculate customer lifetime value
There are three formulas worth knowing, in increasing order of usefulness:
- Basic CLV: Average Order Value × Purchase Frequency × Customer Lifespan. A quick revenue estimate.
- Margin-adjusted CLV: (Average Order Value × Purchase Frequency × Customer Lifespan) × Gross Margin %. The profit version, and the one to plan against.
- Subscription CLV: Average Monthly Revenue per Customer ÷ Monthly Churn Rate. Best for recurring-revenue models.
A worked example makes it concrete. Take a direct-to-consumer apparel brand with an average order value of $85, a purchase frequency of 2.4 orders per year, and a customer lifespan of 2.8 years:
- Basic CLV: $85 × 2.4 × 2.8 = about $571 in revenue.
- Margin-adjusted CLV: $571 × 55% gross margin = about $314 in profit.
- Acquisition headroom: at a healthy 3 to 1 CLV to CAC ratio, that brand can profitably spend up to about $105 to acquire each customer.
The margin-adjusted number is the one that matters, because revenue you cannot keep does not fund growth. And because CLV is a projection, it is only as good as the inputs, which is why the highest-value version is predictive and calculated per segment rather than across your whole base at once.
In practice, calculate CLV by cohort rather than for the whole base at once. Group customers by the month or quarter they first bought, then track each cohort's value over time. Cohort CLV reveals whether newer customers are becoming more or less valuable, which a single all-time average completely hides. It also makes the effect of any change, a new onboarding flow or a loyalty program, visible as a lift in later cohorts, turning CLV from a static figure into a measure of whether your retention work is actually compounding.
CLV benchmarks by category
The table below shows typical CLV ranges by category and the lever that drives value most in each. Treat these as directional context for sanity-checking your own number, not as targets to hit.
| Category | Typical CLV range | Primary CLV driver |
|---|---|---|
| Luxury retail | $1,500 to $5,000+ | Average order value |
| Beauty and cosmetics | $200 to $600 | Purchase frequency |
| Supplements and vitamins | $150 to $400 | Subscription retention |
| Apparel and fashion | $150 to $500 | Customer lifespan |
| Home and household goods | $100 to $400 | Average order value |
| Pet products | $300 to $900 | Subscription and frequency |
| Electronics | $200 to $1,200 | Average order value |
Notice that the driver changes by category, which is the practical insight: a supplements brand grows CLV through subscription retention, while a luxury brand grows it through order value. Knowing your category's primary lever tells you where to focus first. Benchmarks are for sanity-checking, not target-setting, and the CLV to CAC ratio matters more than any absolute figure.
Why customer lifetime value matters
CLV matters because it converts growth from a guess into arithmetic. Once you know what a customer is worth, you know what you can spend to acquire one, how much a churned customer costs you, and which segments deserve the most attention. The single most useful expression of this is the CLV to CAC ratio:
- Around 3 to 1: Healthy. Each customer is worth about three times what you pay to acquire them.
- Below 2 to 1: A warning. Acquisition is barely profitable or losing money, and more spend makes it worse.
- Above 5 to 1: Underinvestment. You could likely afford to acquire more aggressively and still profit.
Retention is the lever that moves CLV most, which is why the economics are so favorable: according to Bain and Company, a 5 percent increase in retention can raise profits by 25 to 95 percent. And the way you track CLV decides whether it is useful at all. A single blended CLV hides your best and worst customers; tracking it per segment is what makes it actionable, and it is why brands that do so grow repeat purchase rate far faster than those that watch one averaged number. Pair it with customer acquisition cost to keep the ratio honest.
The KPIs that drive CLV
CLV is a lagging metric: by the time it changes, the work is already done. The leading KPIs that move it are the ones worth tracking directly, because each is something you can act on this quarter:
- Average order value (AOV): Revenue per order; raise it with bundles and cross-sells.
- Gross margin: The share of revenue you keep; CLV is only as valuable as its margin.
- Purchase frequency: Orders per customer per period, the core of repeat revenue.
- Repeat purchase rate: The share of customers who buy more than once, the clearest early signal of CLV health.
- Time between purchases: A shortening gap means rising engagement; a lengthening one is an early churn signal.
- Retention rate: The share of customers who stay, the strongest lever on lifespan.
- Churn rate: The mirror of retention, and the input to the subscription CLV formula.
- Customer acquisition cost (CAC): What you pay to acquire a customer, the denominator in the ratio that decides whether CLV is profitable.
The point of tracking these is leverage: CLV itself only confirms months later whether your actions worked, while the KPIs underneath it move within weeks. Watch the KPIs to steer, and watch CLV to keep score.
The Omniconvert CLV Framework
Knowing CLV is not the same as growing it. The framework below turns the metric into a loop, so each measurement leads to a prioritized action rather than a slide nobody acts on.
| Stage | Goal | Main lever | Metric that tracks it |
|---|---|---|---|
| Measure | Know CLV by segment, not blended | Margin-adjusted CLV formula, per segment | CLV, CLV to CAC |
| Segment | See who actually drives value | RFM segmentation | RFM scores, segment CLV |
| Predict | Spot churn and growth early | Predictive signals on behavior | Churn probability, predicted CLV |
| Act | Grow value per segment | Retention, AOV, second purchase, loyalty | Repeat rate, AOV, retention |
The framework is deliberately a loop: acting on one segment changes its CLV, which you measure again and feed into the next decision. This is the Customer Value Optimization approach applied to lifetime value, and it is exactly the loop Nexus by Omniconvert automates, calculating CLV by segment, predicting churn, and ranking the actions that protect the most revenue.
See your CLV by segment, who is about to churn, and which action protects the most revenue.
Learn more about Customer Intelligence in Nexus →How to grow customer lifetime value
Because CLV multiplies order value, frequency, and lifespan, improving any input lifts the whole. The highest-leverage moves:
-
Increase retentionRetention is the strongest CLV lever. Improve service, onboarding, and the post-purchase experience so customers stay longer and buy more times.
-
Raise average order valueUse bundles, cross-sells, and thresholds (free shipping over a value) to lift the size of each order without acquiring anyone new.
-
Design the second purchaseThe jump from one order to two is where lifespan is won or lost. Trigger a deliberate, well-timed second-purchase offer rather than hoping it happens.
-
Reduce churn with predictive signalsIdentify at-risk customers from declining recency or frequency and intervene before they leave, when winning them back is still cheap.
-
Segment and reward your best customersUse RFM to find high-value customers, then protect them with loyalty rewards, early access, and personalized offers. Remove products that mostly attract one-time bargain hunters.
RFM segmentation and CLV
RFM scoring ranks every customer on how recently they bought, how often, and how much they spend, which is essentially a proxy for CLV. Omniconvert's Customer Value Optimization methodology names the resulting segments so teams can act on them:
- Soulmates: Top RFM scores, highest CLV and loyalty. Protect and reward them.
- Lovers: Strong scores and still growing. Nurture toward Soulmate status.
- Apprentices: Recent customers with potential. Design their second purchase.
- About to dump you: Declining recency or frequency. Intervene now.
- Break-ups: Lost customers. Win back the valuable ones selectively.
Segmenting this way turns CLV from a number into a plan: you protect Soulmates, grow Apprentices, and rescue the About-to-dump-you segment before they become Break-ups. You can even export high-CLV segments as lookalike audiences to Meta and Google Ads, so acquisition targets the customers most likely to be valuable. On Shopify specifically, see the best Shopify CLV apps for tools that calculate and act on this.
Common CLV mistakes to avoid
CLV is easy to calculate badly, and a wrong CLV is worse than none, because it drives confident bad decisions. The mistakes that recur:
- Blended CLV only: One company-wide average hides the segments that actually drive value and the ones quietly losing money. Always segment.
- Revenue instead of margin: Revenue CLV overstates what a customer is worth. Use the margin-adjusted figure for any spending decision.
- Treating CLV as historical: Totaling past spend tells you what happened, not what to plan for. Acquire against predictive CLV.
- Ignoring CAC: A high CLV means nothing if acquisition costs more. The CLV to CAC ratio, not CLV alone, decides profitability.
- Chasing CLV with discounts: Heavy discounting can lift order counts while destroying margin and attracting one-time bargain hunters who never return.
Avoiding these is less about sophisticated modeling and more about discipline: segment the number, use margin, look forward, and never read CLV without CAC beside it.
Frequently Asked Questions
Customer lifetime value (CLV), also called LTV, is the total revenue a customer generates over their entire relationship with a business, and the total profit once it is adjusted for gross margin. It reflects how much they spend per order, how often they buy, and how long they stay. CLV is forward-looking, projecting what a customer will be worth across their full lifecycle, which is why it is the metric that should anchor acquisition and retention decisions.
The basic formula is average order value multiplied by purchase frequency multiplied by customer lifespan. For a profit figure, multiply that by gross margin percentage. For subscription businesses, divide average monthly revenue per customer by monthly churn rate. For example, a brand with an $85 average order, 2.4 orders a year, and a 2.8-year lifespan has a CLV of about $571 in revenue, or $314 after a 55 percent margin.
A healthy customer lifetime value to customer acquisition cost ratio is about 3 to 1, meaning each customer is worth roughly three times what you spend to acquire them. A ratio below 2 to 1 means acquisition is barely profitable or losing money, while a ratio above 5 to 1 often signals you are underinvesting in growth and could afford to acquire more aggressively. The ratio matters more than the absolute CLV figure.
Historic CLV measures what a customer has already spent across their past orders, a backward-looking record. Predictive CLV projects what a customer will be worth across their entire remaining lifecycle, using purchase patterns, frequency, and churn probability. Historic CLV is easy to calculate but limited for planning; predictive CLV is what you should acquire and budget against, because it estimates future value rather than just totaling the past.
Customer lifetime value is important because it tells you how much you can profitably spend to acquire and retain a customer, anchoring nearly every growth decision. According to Bain and Company, a 5 percent increase in retention can raise profits by 25 to 95 percent, and retention is a core CLV driver. Tracking CLV by segment rather than as a blended average is what turns it from a vanity metric into a tool for prioritizing spend.
You increase customer lifetime value by improving its inputs: raise retention so customers stay longer, increase average order value with bundles and cross-sells, lift purchase frequency by designing the second purchase, and reduce churn by acting on at-risk signals early. Segmenting with RFM so you focus on high-value customers, removing products that attract one-time bargain hunters, and rewarding loyalty all compound the effect over the customer's lifespan.
Customer lifetime value (CLV) is the total profit a customer generates over their relationship with you; customer acquisition cost (CAC) is what you spend to acquire that customer. CLV measures the value you capture, CAC the cost to capture it, and the ratio between them, ideally about 3 to 1, tells you whether your growth is profitable. Neither number means much alone; the relationship between them is what guides spend.
Nexus by Omniconvert is the AI eCommerce growth engine that calculates customer lifetime value at the segment level, using RFM and purchase data, then turns it into ranked actions. Instead of a single blended CLV figure, teams see which segments drive the most value, which are about to churn, and which intervention protects the most revenue, so growing CLV becomes a prioritized queue of work rather than a number watched from a distance.
Calculate one number this week: your CLV to CAC ratio. Take your average order value, purchase frequency, and customer lifespan, multiply for CLV, adjust for margin, and divide by what you pay to acquire a customer. If it is below 3 to 1, your problem is retention or margin, not traffic, and acquiring more customers will only lose money faster. If it is above 5 to 1, you are leaving growth on the table and can afford to acquire more aggressively. Then run it again per segment, because the blended number hides both your best customers and your worst, and the whole point of CLV is to act on the difference.

Measure CLV by segment and grow it with Nexus
Nexus by Omniconvert calculates customer lifetime value at the segment level using RFM and purchase data, then ranks the actions that protect and grow it, from retention to the next best offer. Stop watching a blended CLV figure and start acting on the segments that drive it.