RFM Score: Analysis, Formula, and How to Calculate It
Article last updated:
Article first published:
RFM stands for Recency, Frequency, and Monetary value. This powerful analytical tool helps businesses evaluate customer behavior based on how recently they made a purchase, how often they buy, and how much they spend. By calculating RFM scores, you can gain valuable insights into your customers’ purchasing patterns, enabling you to segment them more effectively and tailor your marketing efforts to drive engagement and increase profitability.
The Recency, Frequency, and Monetary (RFM) Score is a quantitative method used to assess customer value by analyzing recency, frequency, and monetary behavior. It supports customer segmentation and strategic decision-making through transaction data analysis. RFM analysis is a structured approach that ranks customers based on these three key behavioral dimensions, helping businesses measure engagement strength and revenue contribution.
Recency measures the time since a customer’s last purchase, frequency tracks the number of purchases made within a defined period, and monetary value evaluates the total spending during that period. Each of these metrics is assigned a score, and combined scores produce an overall ranking of customers. Higher scores reflect stronger commercial value.
RFM analysis works by sorting transaction records according to purchase date, order count, and total spend, then ranking customers within each dimension. The aggregation of these rankings generates composite scores, guiding targeted actions tied to each group.
The RFM model provides distinct customer segments (high-value loyal customers, frequent low spenders) and inactive customers. RFM segments align with operational strategies for retention, reactivation, and resource allocation.
RFM analysis helps prioritize marketing investments and strengthens customer lifecycle management. While it offers substantial benefits, maintaining data hygiene and addressing market-specific biases is crucial for preserving its accuracy and effectiveness.
What is the RFM score?
The RFM score is a numerical representation of customer value derived from analyzing recency, frequency, and monetary behavior. RFM stands for Recency Frequency Monetary. Recency measures the time elapsed since a customer last made a purchase. Frequency measures the total number of purchases within a defined period. Monetary measures the total spending of a customer during the same period. Each metric receives a score based on relative position among all customers, and the combined result produces the overall RFM score.
RFM functions as a customer segmentation model that categorizes customers based on transactional behavior. High RFM scores identify customers who have purchased, spent, and engaged recently. Low scores indicate customers with infrequent or low spending and long gaps since their last purchase. The model supports marketing decisions, retention strategies, and resource prioritization by highlighting the most valuable and at-risk customers.
The purpose of the RFM score in analyzing customer value is to provide an objective measure of engagement and revenue contribution. Businesses use RFM analysis to target profitable segments, optimize campaigns, and improve return on investment in customer acquisition and retention efforts. The structured approach allows comparison of customers without subjective bias, ensuring data-driven decisions that increase efficiency and profitability.
How Does RFM Analysis Work?
RFM analysis works by evaluating customer behavior through purchase timing, transaction frequency, and spending value (e-commerce stores, subscription services, loyalty programs). RFM analysis applies Recency scoring to measure the number of days since the last recorded purchase, reflecting engagement freshness without inference. RFM analysis applies Frequency scoring to count completed transactions during a defined observation window, indicating behavioral consistency across time. RFM analysis applies Monetary scoring to calculate cumulative or average spend, reflecting revenue contribution per customer record.
RFM scoring relies on ordinal ranking to normalize customer comparisons. Implementations apply a 1 to 5 scale where higher values represent stronger performance per metric. Recency scoring ranks customers from the most recent purchasers to the longest inactive buyers using elapsed time thresholds. Frequency scoring ranks customers from repeat purchasers to one-time buyers using transaction counts. Monetary scoring ranks customers from highest spenders to lowest spenders using revenue totals. Each metric remains isolated during scoring to preserve analytical precision.
RFM classification combines three metric scores into a single segment code used for interpretation. A customer assigned 5 for Recency, 5 for Frequency, 5 for Monetary enters a top tier engagement segment. A customer assigned 1 for Recency, 1 for Frequency, 1 for Monetary enters a dormant segment associated with churn exposure. Mixed score combinations support targeted segmentation for retention, reactivation, or value growth initiatives. Analysts apply RFM segmentation inside structured decision frameworks grounded in Data Analyis.
Why Is RFM Score Important for Businesses?
The RFM score is important because it helps businesses identify and prioritize their most valuable customers. By focusing on customers who buy, spend, and purchase recently, companies allocate marketing resources efficiently.
RFM analysis improves campaign performance by enabling targeted messaging instead of broad, generic promotions. RFM analysis supports customer retention by identifying declining engagement early, allowing businesses to intervene before customers churn. When used consistently, RFM scoring contributes to higher conversion rates, stronger customer relationships, and sustainable revenue growth.
What Are the Three Components of the RFM Formula?
The three components of the RFM formula are Recency, Frequency, and Monetary. Recency measures how recently a customer made a purchase, helping to gauge their current engagement level. Frequency tracks how repeatedly a customer makes purchases, providing insight into their loyalty and buying habits. Monetary evaluates how much a customer spends, identifying high-value customers who contribute significantly to revenue. The three components of the RFM formula work together to segment customers effectively and allow businesses to create targeted, data-driven marketing strategies.
Understanding customer behavior is key to effective marketing. The RFM formula provides a structured way to analyze and segment customers based on their interaction with a brand. This approach helps businesses prioritize resources on high-value customers while designing targeted campaigns that engage different customer segments appropriately. Companies craft personalized marketing strategies that align with customer preferences and increase overall customer lifetime value by leveraging RFM.
Recency (R)
Recency tracks how recently a customer made a purchase, giving you a snapshot of how active they are with your brand. The more recent the purchase, the higher their recency score. This metric is essential because it shows which customers are engaged and more likely to interact with your future marketing efforts. Customers who’ve made recent purchases are more likely to come back, making recency a strong predictor of retention. A high recency score lets you send targeted messages and offers, increasing the likelihood of encouraging repeat business.
It helps identify customers who might need re-engagement, allowing you to proactively reach out with tailored incentives. Monitoring recency help prevent customer churn, as you focus on those who have shown interest recently and prompt them to take action before their engagement decreases. It helps in prioritizing the marketing budget by focusing on the most engaged customers, ensuring the best return on investment for your campaigns. Businesses improve customer loyalty and extend the customer lifecycle by understanding recency patterns.
Frequency (F)
Frequency measures how often a customer makes a purchase within a specified time period. It helps identify your loyal repeat buyers.
High-frequency customers are more likely to participate in loyalty programs or exclusive offers, improving their long-term value to the business. Monitoring frequency allows businesses to identify and reward top-tier customers, ensuring that they continue engaging and driving steady revenue. Regular purchases from frequent buyers help predict future buying behavior, making it easier to anticipate demand and plan marketing campaigns accordingly. Businesses focus marketing efforts on this segment, ensuring cost-effective outreach with higher chances of conversion. Understanding frequency helps refine customer engagement strategies and improve retention.
Monetary Value (M)
Monetary Value measures the total amount of money a customer has spent within a specified time period. It helps identify high-value customers who contribute significantly to your revenue.
Monetary value is essential because it highlights revenue contribution, showing that customers with high monetary value make significant purchases. Customers with high monetary value are ideal targets for premium offers, loyalty programs, and exclusive promotions.
High monetary value customers repeatedly represent a smaller percentage of the total customer base but generate a large proportion of the business's revenue. Understanding this metric allows businesses to allocate resources efficiently, focusing efforts on retaining High monetary value, high-spending customers through personalized incentives. Companies predict future spending behavior and design marketing strategies that encourage repeat high-value transactions by identifying monetary patterns. The focus on monetary value supports product development and pricing strategies by revealing which customers are willing to invest in premium products or services. High-spending customers tend to be more responsive to tailored messaging and targeted marketing, increasing the potential for upselling and cross-selling.
How Can RFM Score Improve Customer Segmentation?
RFM Score can Improve Customer Segmentation by creating structured customer groups (Champions and At-Risk segments), identified through purchase timing, buying consistency, and spending level. RFM Score improves customer segmentation by assigning numerical values to recency, frequency, and monetary behavior, grouping customers with similar patterns into clear segments. Businesses score recency based on the time since the last transaction, frequency based on purchase count within a defined period, and monetary value based on total spending. Combined scores create distinct customer clusters based on measurable behaviors rather than assumptions.
High recency, high frequency, and high monetary scores form Champions, representing customers with recent activity, repeated purchases, and strong revenue contribution. Low recency, combined with declining frequency, forms At-Risk groups, signaling disengagement despite past value. Low frequency and low monetary scores identify low-value or one-time buyers who require limited investment. Each segment reflects a different relationship stage, supported by transaction data rather than demographics.
Segmentation through RFM Score supports targeted strategies by aligning outreach intensity, messaging, and incentives with behavioral signals.
Champions receive loyalty rewards to maintain engagement. At-risk groups receive reactivation offers timed to purchasing gaps. Lower value segments receive cost-controlled campaigns to protect margins. Data-driven segmentation strengthens personalization by grounding decisions in observable behavior patterns, improving efficiency across retention and revenue planning using RFM Score.
What Customer Types Can Be Identified with RFM?
The types of customers that can be identified with RFM are listed below.
- Champions: Champions represent customers with recent purchases, frequent transactions, and high spending levels. Champions demonstrate strong engagement and revenue contribution across measured periods. Segmentation insight directs retention-focused actions focused on rewards, early access offers, and priority communication.
- Loyal: Loyal customers show consistent purchase frequency with steady monetary value over time. Loyal customers maintain stable engagement even without very recent transactions. Segmentation insight directs relationship-building actions through loyalty programs and personalized messaging.
- At Risk: At Risk customers show declining recency after a history of strong frequency or spending. At-risk patterns signal disengagement despite past value contribution. Segmentation insight directs reactivation strategies through targeted incentives and timing based on purchase gaps.
- New: New customers show high recency with low frequency and limited monetary value. New customer behavior reflects early-stage engagement following initial transactions. Segmentation insight directs onboarding actions through education-focused messaging and introductory offers.
How Do Companies Use RFM Score in Marketing Campaigns?
Companies use RFM score in marketing campaigns by personalizing offers and messages based on recency, frequency, and monetary behavior (loyalty rewards, reactivation emails). RFM scoring separates customers into behavior-driven segments that reflect purchase timing, buying consistency, and spending contribution. Recency scores guide message timing by identifying customers with recent engagement. Frequency scores control campaign cadence by distinguishing repeat buyers from infrequent purchasers. Monetary scores prioritize incentives toward high value segments with proven revenue impact.
Personalized messaging replaces uniform outreach across all audiences. Champions receive loyalty rewards that reinforce repeat purchases through exclusive benefits or priority access. Loyal segments receive appreciation focused messages that maintain engagement without heavy discounts. At Risk segments receive reactivation emails triggered by extended inactivity, emphasizing reminders or limited time offers tied to past preferences. New segments receive onboarding messages that clarify value propositions and purchasing pathways.
Targeted segmentation reduces wasted ad spend by narrowing promotions to customers with measurable intent or historical value. Budget allocation shifts away from low response audiences toward segments with higher conversion probability. Campaign efficiency improves through relevance driven targeting rather than broad distribution, strengthening performance across channels within an Email Marketing Campaign.
How to Calculate RFM Score?
To calculate RFM Score, follow the five steps below.
- Analyze Historical Purchase Data. Gather customer purchase data, including the date of their last purchase, the number of purchases made, and the total monetary value spent.
- Choose the Suitable Scale. Define a scoring system for each RFM category: Recency, Frequency, and Monetary. For example, use a 1 to 5 scale, where 1 represents low engagement and 5 represents high engagement.
- Define Intervals for Each Point. Set specific intervals for each category:
- Assign Scores. Assign a score (1-5) based on how each customer performs in each category, based on the intervals defined.
- Segment Customers. Combine the scores for Recency, Frequency, and Monetary to calculate an overall RFM score. Use RFM scores to create customer segments, (high-value, frequent buyers or inactive customers), to target with personalized marketing strategies.
Step 1: Analyze Historical Purchase Data.
You have to analyze the historical purchase data, looking for the minimum and the maximum value for each of the three RFM variables or RFM metrics. This data include details on purchase dates, the number of purchases, and the monetary value of each purchase for every customer.
Analyzing historical purchase data involves examining key details (the dates of purchases, the number of purchases, and the total spending of each customer. The goal is to identify the minimum and maximum values for the three RFM metrics: Recency, Frequency, and Monetary. Recency focuses on how recently a customer made a purchase, with the earliest and most recent purchase dates providing the range. Frequency examines the number of purchases made within a specified period, identifying the customer with the fewest and most purchases. Monetary tracks the total spending, highlighting the lowest and highest spending customers.
Once the data is collected, it is essential to clean and standardize it to ensure consistency across all entries. This allows for a clear comparison of customer behavior, ultimately enabling the calculation of RFM scores. RFM scores then be used to segment customers based on their purchasing habits, guiding targeted marketing strategies.
Step 2: Choose the Suitable Scale.
You have to choose a suitable scale according to the size of your customer base.
1–3 scale for less than 30k customers;
1–4 scale for 30k–200k customers;
1–5 scale for more than 200k customers.
The minimum and maximum values for recency, frequency, and monetary will help you define the intervals for each point in your scale.
Choosing the suitable scale for RFM analysis involves determining how to categorize customers based on their Recency, Frequency, and Monetary values. A 1-5 scale is used, where 1 represents the lowest engagement, and 5 represents the highest. For Recency, the scale reflect how recent a customer's last purchase was, with a score of 1 assigned to customers whose last purchase was far in the past and a score of 5 for those who purchased recently. For Frequency, the scale indicates how repeatedly a customer makes a purchase, with 1 for infrequent buyers and 5 for those who make frequent purchases. For Monetary, the scale reflects the total spending, with 1 for low spenders and 5 for high spenders. The scale should be flexible, allowing for meaningful differentiation between customer segments while aligning with business goals and marketing objectives.
Step 3: Define Intervals for Each Point.
Then, you have to define the intervals for each point on your chosen scale using the minimum and maximum values for recency, frequency, and monetary value.
In the table below, you see a 1 to 5 scale used by a company with over 200k customers.
<table><tbody><tr><td><p><b>Metric</b></p></td><td><p><b>1 (Lowest)</b></p></td><td><p><b>2</b></p></td><td><p><b>3</b></p></td><td><p><b>4</b></p></td><td><p><b>5 (Highest)</b></p></td></tr><tr><td><p>Recency</p></td><td><p>>12 months</p></td><td><p>9-12 months</p></td><td><p>6-9 months</p></td><td><p>3-6 months</p></td><td><p><3 months</p></td></tr><tr><td><p>Frequency</p></td><td><p>1 purchase</p></td><td><p>2-3 purchases</p></td><td><p>4 purchases</p></td><td><p>5 purchases</p></td><td><p>>5 purchases</p></td></tr><tr><td><p>Monetary</p></td><td><p><$10</p></td><td><p>$10-$20</p></td><td><p>$20-$35</p></td><td><p>$35-$45</p></td><td><p>>$45</p></td></tr></tbody></table>
In this company’s case, a customer who purchased more than a year ago receives the minimum score for recency, respectively, 1 point. If that customer’s purchase frequency is higher than 5, they receive the maximum score, 5 points. If the monetary value is [$45], the customer gets 5 points.
Step 4: Assign Scores.
Assign scores to each customer based on their recency, frequency, and monetary values according to the defined intervals. In our example, the RFM score for the customer will be 155: 1 for recency, 5 for frequency, and 5 for monetary value.
Recency scores are assigned based on how recently a customer made a purchase. For example, a customer who purchased within the past week might receive a score of 1, indicating high recency, while a customer who made a purchase several months ago receives a lower score. Frequency scores reflect how repeatedly a customer makes purchases. A customer who buys five times in the last month might receive a high frequency score, like 5, while those with fewer purchases are given a lower score.
Monetary scores are assigned based on the total amount spent within a set period. A customer who spends a significant amount of money ([$500] in the past quarter would receive a high score, like 5, compared to a customer who spends much less.
In our example, the customer has a recency score of 1, a frequency score of 5, and a monetary value score of 5, resulting in a total RFM score of 155. RFM score helps the business segment customers for targeted marketing strategies.
Step 5: Segment Customers.
Once you have assigned RFM scores to all customers, you segment them into different groups based on their scores. Each segment will represent customers with similar purchasing behaviors. What does the 155 RFM score say about the customer in our example? What segment do they fall into? According to Omniconvert’s RFM segmentation, segment customer is an Ex-Lover – customers who used to be loyal to your brand but stopped buying from you a long time ago.
Customers in the highest RFM segments, like those with the highest scores in Recency, Frequency, and Monetary, are considered your most valuable. The highest RFM segments customers are potential to engage with your brand regularly and contribute significantly to revenue. On the other hand, customers in lower segments (those with lower recency or frequency scores) might need re-engagement strategies to boost their activity and loyalty.
Segmenting customers allows businesses to create personalized campaigns for each group. High-value customers might receive exclusive offers or loyalty rewards, while at-risk or low-value customers might be targeted with reactivation offers or reminders. Customer segmentation helps optimize resources and marketing budget, ensuring that efforts are focused on the most promising customer groups. Businesses continuously refine their approach to maximize engagement and retention based on each segment’s behavior by analyzing the RFM scores.

Like what you're reading?
Join the informed eCommerce crowd!
Stay connected to what’s hot in eCommerce. We will never bug you with irrelevant info.
RFM score segments
You could calculate RFM scores and perform RFM segmentation manually, but that would be tiring, and you would have to go through the same process month after month. Unfortunately, the manual calculation doesn’t help you react in real-time in multiple situations, like when you get a batch of new high potential customers.
The RFM score signals that you should include them in the onboarding process right away and send the correct email for these new high-value customers that might become your next loyal customers.
Ideally, you should calculate the RFM score automatically, using a dedicated solution for RFM segmentation. This way, you’ll have the RFM constantly updated based on customers’ behavior.
For example, in REVEAL, a customer value optimization platform developed by Omniconvert, all customer RFM scores are calculated automatically based on transactional data captured by your eCommerce platform.
With REVEAL, you have access to 11 default RFM segments that you can name and regroup as you wish to make them 100% relevant to your business model.
The RFM Segments according to the CVO methodology
The default RFM segments name are inspired by love life, so you can easily differentiate between a “Soulmate,” a “New Passion,” and a “Don Juan.”
Let’s look at the RFM scores and the main characteristics for each of these 11 segments.
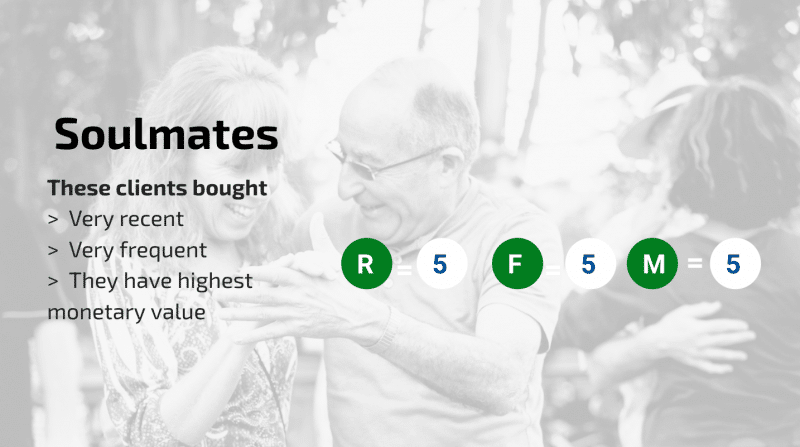
Soulmates
RFM Score
Recency = 5
Frequency = 5
Monetary value = 5
One of the main reasons you want to calculate the RFM score is to identify your best customers. It’s crystal clear that Soulmates are your ideal customers with a perfect RFM score of 555. Soulmates customers have recently made a purchase, buy and spend the most money. You want to keep the maximum score for all variables as long as possible. You want to learn all about what makes Soulmates loyal, use the insights to inform your future campaigns, and improve customer lifetime value.
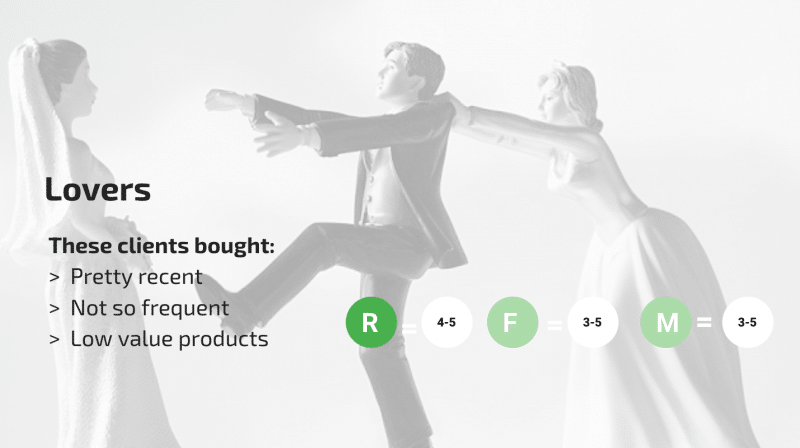
Lovers
RFM Score
Recency = 4 - 5
Frequency = 3 - 5
Monetary value = 3 - 5
Lovers are almost as good as your Soulmates, but they aren’t so excited about you yet. Lovers customers have made recent purchases, buy and spend a considerable amount, but there is still room for growth in their engagement and loyalty. RFM customer segment needs more nurturing, and your job is to eliminate frictions that prevent them from becoming your Soulmates.
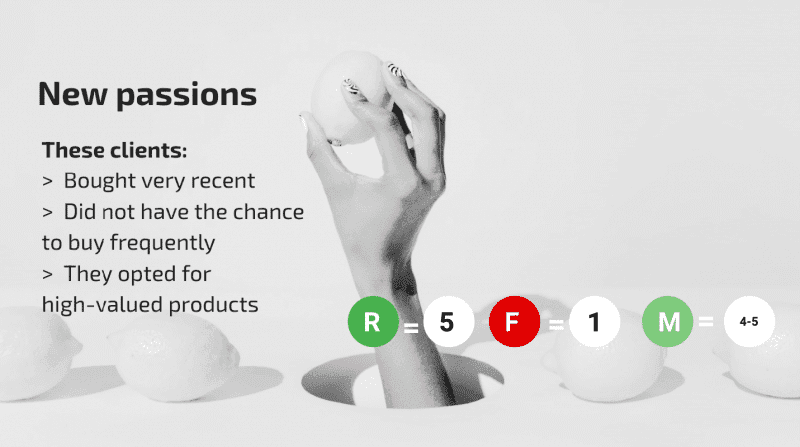
New Passions
RFM Score
Recency = 5
Frequency = 1
Monetary value = 4 - 5
New Passions are new customers with the highest monetary value among all new customers. They have made a recent purchase, but it is their first interaction with your business. If you treat them right, they might become your next Lovers and Soulmates. The key is to nail the onboarding and encourage further purchases.
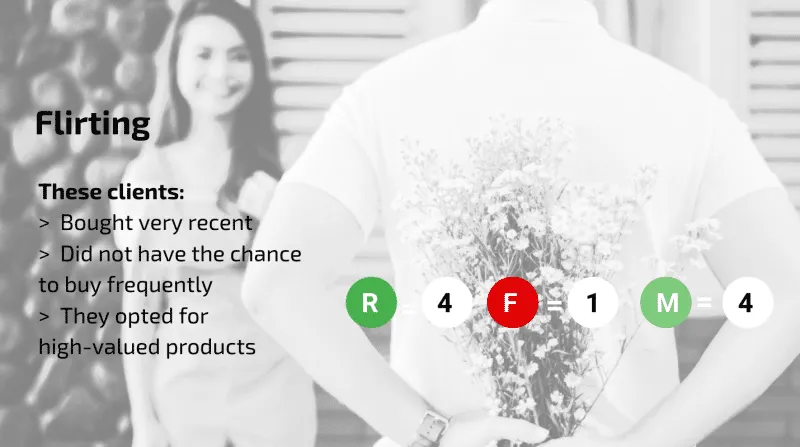
Flirting
RFM Score
Recency = 4
Frequency = 1
Monetary value = 4
Flirting customers are new customers who placed their first order a while ago, and the monetary value wasn’t as high as a New Passion customer. They have potential, so you have to encourage several purchases before rushing to conclusions. Encourage additional purchases through targeted marketing campaigns, personalized offers, and follow-up communications.
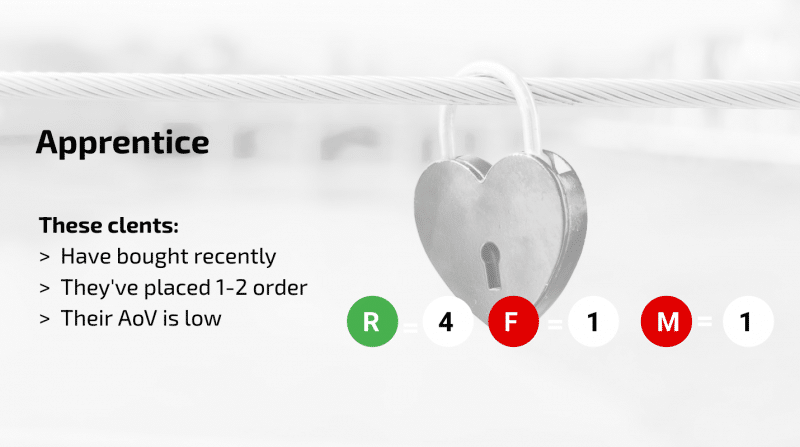
Apprentice
RFM Score
Recency = 4
Frequency = 1
Monetary value = 1
With one or two low-value orders, the Apprentice segment includes new customers that aren’t willing to spend more until you win their trust. You need to find their motivations and what would get them more engaged. Offer personalized experiences, address any concerns they might have, and provide incentives for repeat purchases.
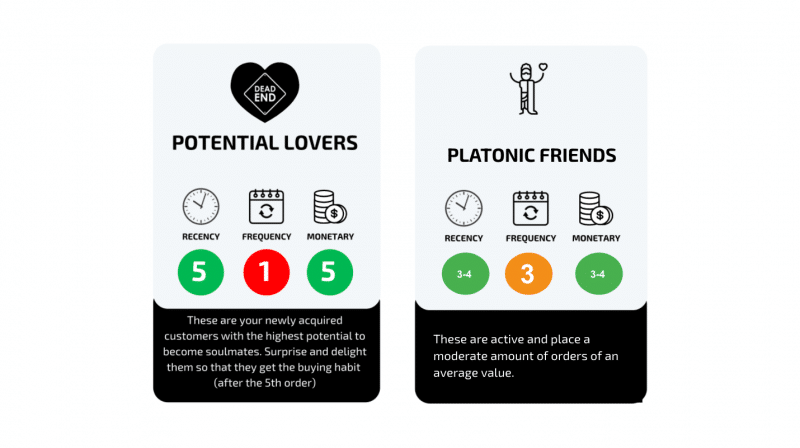
Platonic Friends
RFM Score
Recency = 3 - 4
Frequency = 3
Monetary value = 3 - 4
Platonic Friends are customers that buy from your store quite regularly, and the orders they place are below average. Still, they aren’t consistent yet, so you need to do extra work to increase the scores for each RFM variable.
Potential Lovers
RFM Score
Recency = 5
Frequency = 1
Monetary value = 5
The Potential Lovers segment of active customers is worthy of your attention since they’ve placed a couple of high-value orders, but have not yet made frequent purchases. With proper treatment, they might become your next Lovers.
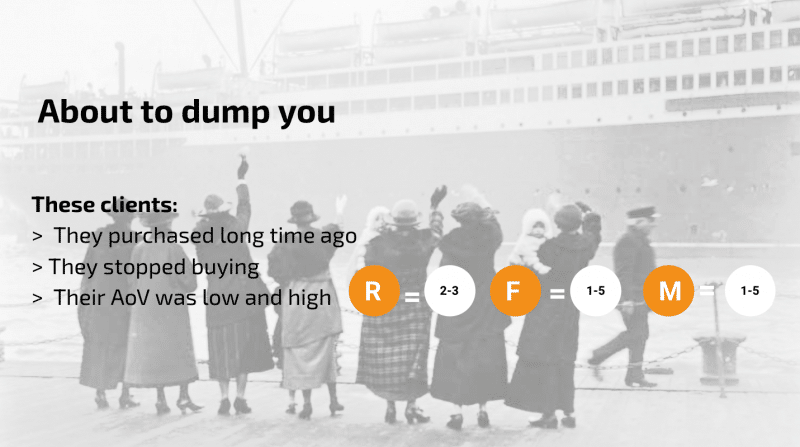
About To Dump You
RFM Score
Recency = 2 - 3
Frequency = 1 - 5
Monetary value = 1 - 5
The About To Dump You segment is represented by all types of customers who used to buy from you but haven’t in a while. You try to reactivate the ones who used to have high frequency and monetary value. You implement re-engagement strategies (personalized emails, special discounts, and loyalty incentives) to win them back. Your best customers should never get in this segment.
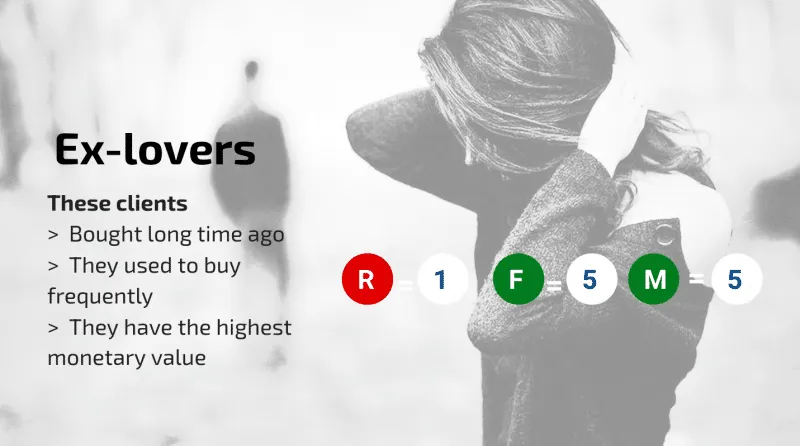
Ex-Lovers
RFM Score
Recency = 1
Frequency = 5
Monetary value = 5
Ex-Lovers are inactive customers who left your store a while ago and have high frequency and monetary value. However, they have not purchased for a long time, indicating that you have lost them. While it might be challenging to win back Ex-Lovers, understanding why they left can provide valuable insights to prevent other customers from following the same path. Conduct surveys or gather feedback to identify potential issues and improve your offerings and customer experience.
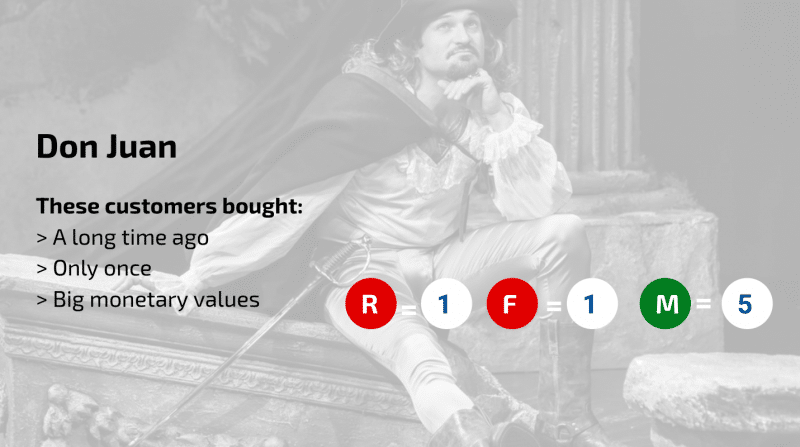
Don Juan
RFM Score
Recency = 1
Frequency = 1
Monetary value = 5
Just like one-night stands, Don Juan customers place one high-value order and never come back. They represent a missed opportunity for long-term engagement and loyalty. You need to find out why they never came back and dig deeper for clues. Maybe it was a toxic product or a poor customer experience. Dig deeper for clues by analyzing their purchase journey, seeking feedback, and reviewing their interactions with your brand.
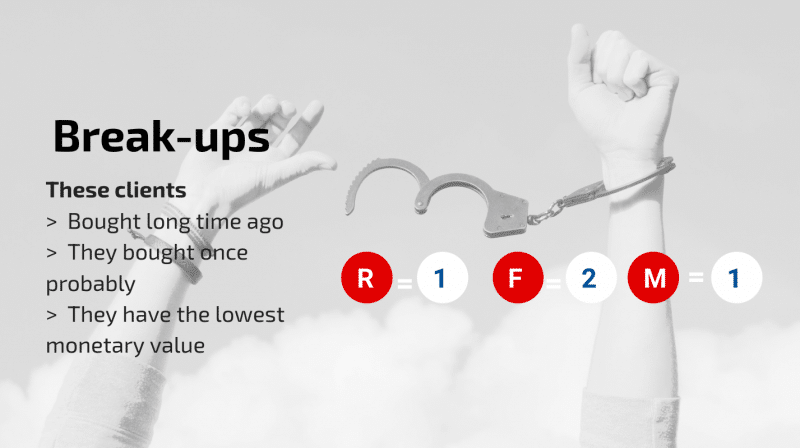
Break-Ups
RFM Score
Recency = 1
Frequency = 2
Monetary value = 1
The Break-Ups segment includes low valued customers that purchased sporadically and placed low-value orders. Don’t waste your time with them, as they’re part of the natural churn rate – 15-25% of customers end up in break-up segment.
What Are the Limitations of RFM Scoring?
The limitations of RFM Scoring are listed below.
- Data Dependency: RFM scoring relies heavily on historical transaction data, which not fully capture customer behavior if data is incomplete or inconsistent.
- Lack of Customer Sentiment: RFM does not account for customer sentiment or satisfaction, which be critical for understanding loyalty and long-term engagement.
- Static Segmentation: RFM uses fixed thresholds (e.g., 1-5 scale) that may not adapt to changing customer behavior over time or account for market fluctuations.
- Over-Simplification: The model simplifies customer behavior into three metrics, potentially ignoring other factors like product preferences, purchase context, or external influences.
- Limited Predictive Power: RFM scoring focuses on past behavior, which is not always accurately predict future behavior, for new or infrequent customers.
- Exclusion of Demographic Data: RFM does not consider demographic factors, which may provide valuable insights into customer preferences and segmentation.
How Does RFM Compare to Other Customer Analytics Models?
RFM (Recency, Frequency, Monetary) analysis focuses on customer behavior based on recent purchases, purchase frequency, and total spend. It is a quick and effective method for segmenting customers, in scenarios where you want to target active customers or identify at-risk customers. RFM works well for businesses with a high volume of transactions where customer retention is key, offering actionable insights in a relatively short time frame.
In contrast, Customer Lifetime Value (CLV) measures the total revenue a customer is expected to generate throughout their relationship with a business. While RFM offers a snapshot based on recent activity, CLV takes a holistic, long-term view, incorporating historical data, future purchasing patterns, and customer retention rates. CLV provides a comprehensive understanding of customer value, for businesses looking to forecast future revenue. Customer Lifetime Value is ideal when a business wants to allocate marketing spend based on a customer’s potential future value rather than just past behavior.
Cohort analysis, on the other hand, groups customers based on shared characteristics or behaviors over time, (the month they made their first purchase or the marketing campaign that brought them in). Cohort analysis reveals trends over time, (the retention rates of customers acquired during a particular campaign), which RFM cannot provide. While Recency, Frequency, and Monetary (RFM) identify segments of high or low-value customers, cohort analysis helps track changes in customer behavior across specific groups, offering a deeper understanding of trends and customer lifecycle stages.
RFM is practical in situations where businesses need quick, actionable insights for customer segmentation and targeted campaigns. It’s ideal when businesses need to quickly engage with customers or identify churn risks. However, when a detailed, long-term customer valuation or trend analysis is needed, models like Customer Lifetime Value or cohort analysis might be suitable.
Is RFM Scoring Suitable for All Types of Businesses?
Yes, Recency, Frequency, and Monetary (RFM) scoring be suitable for most businesses, but its effectiveness varies depending on the business model.
For e-commerce and retail businesses, RFM is highly effective. The e-commerce and retail industries often deal with repeat purchases, making Recency, Frequency, and Monetary metrics relevant for segmentation and targeted marketing. RFM allows businesses to identify loyal customers, high-value segments, and at-risk customers, facilitating personalized offers and retention strategies.
In subscription models, RFM works well by tracking customer engagement, frequency of subscription renewals, and total spend over time. It helps identify which subscribers are most engaged and likely to continue their subscriptions, making it useful for retention-focused strategies.
Recency, Frequency, and Monetary (RFM) has limitations in one-time purchase industries (certain luxury or high-ticket items). In one-time purchase industries, customers do not make frequent purchases, and RFM’s focus on frequency does not provide as much insight into long-term customer behavior. Adjustments, (incorporating post-purchase metrics like satisfaction or lifetime engagement), are necessary to gain a fuller understanding of customer value.To adapt RFM for different markets, businesses need to fine-tune their scoring thresholds or add supplementary data points, like customer demographics or product preferences, to get an accurate representation of customer value.
How Can You Start Implementing RFM Scoring in Your Strategy?
To implement RFM scoring effectively, begin by gathering the necessary data. You will need customer transaction history, including purchase dates, frequencies, and total spending amounts. Ensure that your data is clean, complete, and consistently updated. Gathering the necessary data is crucial for accurate RFM analysis and segmentation.
Next, use tools or software designed for RFM scoring. Many Customer Relationship Management (CRM) systems, (HubSpot, Salesforce, or specialized analytics tools), offer built-in features for RFM segmentation. Instead, use business intelligence tools like Google Analytics or Excel to perform manual calculations, though intelligence tools require setup. Intelligence tools tools help automate the scoring process, making it easier to segment customers based on Recency, Frequency, and Monetary values.
Once the data is collected and the scoring system is set up, start by testing RFM scoring on a small customer sample. Segment customers into different RFM groups (high value, low value, at risk) and evaluate how each group behaves. Segmenting customers will help understand the validity of scores and adjust the scoring thresholds if necessary.
Integrate RFM segments into marketing and sales campaigns by targeting different groups based on their behavior. For example, create re-engagement campaigns for at-risk customers, special offers for high-value customers, or win-back offers for those who haven’t purchased in a while. Monitor the performance of marketing and sales campaigns to refine strategy over time.
Wrap up
RFM modeling and RFM score emphasize that not all customers are created equal, so focus on retaining the most valuable customers and acquiring customers like the best customers.
Plus, automated RFM segmentation keeps RFM scores updated and helps you know how your customers’ behavior changes over time based on their purchase history. It also makes it easiePlus, automated RFM segmentation keeps RFM scores updated and helps you know how your customers’ behavior changes over time based on their purchase history. It makes it easier to identify how customer segments’ evolution influences various KPIs, like the customer lifetime value, repeat purchase rate, or customer retention rate.
The more you learn about each RFM segment, the better you become at optimizing strategies, from acquisition to retention. In our CVO Academy courses, you’ll find all you need to know about the RFM score system, segmentation, and how to approach each segment.
We encourage you to invest time in understanding advanced eCommerce strategies so you generate sustainable growth for your business.
Frequently asked questions
The best RFM score is the one with the highest values for each variable. If a store uses a 1 to 5 scale for recency, frequency, and monetary value, with 5 being the highest, then the perfect RFM score is 555.
How do you interpret RFM results?
After you have the RFM scores for each customer, group customers to reflect different buying behaviors, differentiating your most loyal customers from your ex-customers. Looking at the overall image pictured by the RFM scores, you’ll be able to prioritize actions, like improving the loyalty program to avoid losing the most valuable customers or the onboarding process to retain of your newly acquired customers.
What is the highest RFM score possible?
The highest RFM score possible depends on the scale you are using for each of the three components: Recency, Frequency, and Monetary value. If you are using a scale of 1 to 5 for each component, the highest possible RFM score is 555. 555 score indicates that the customer has the highest score for recency (most recent purchase), frequency (most frequent purchases), and monetary value (highest spending).


If you liked this article, make it shine on your page :)