No eCommerce Ad Concept Lost Share in September 2026. So Why Retire Yours?


Scope: every industry and country the eCommerceBenchmark Ad Library tracks. 68,341 ads active in September 2026, compared with August 2026. No split by country or industry.
Every month we ask one question: which ad concept is fading?
This month, the answer is: none.
We checked all 68,341 ads running in September. We ranked every concept by how much share it lost since August. The list came back empty. Not short. Empty.
- If you were about to retire a concept because it feels tired, the market didn't. The biggest concept held its share exactly.
- The month's movement was only upward. Four concepts gained and none fell. That's a month to add something, not to swap.
- The risers are small. That makes them cheap to test, and too small to build a month on.
A creative concept is defined as the way an ad is staged on screen: the build a shopper takes in before reading a word. Here is what moved, and what didn't.
No concept lost share: the falling list came back empty
It was a quiet month. The widest gain took one concept from 4.6% of all ads to 4.9%. Here is every concept that moved, and by how much.
Change in share of all ads, September vs August 2026, in percentage points. Nothing on the other side of the line: no concept lost share. Source: eCommerceBenchmark Ad Library, 2026.
The nearest thing to a fade is the biggest concept standing still. Product Demo Close-Up held 9.1% of all ads in both months. A row that sits in the same spot twice hasn't lost anything.
Four concepts gained. Cinematic B-roll and Montage each moved up 0.3 points. Two more sat flat next to the biggest one: Side-by-Side Comparison held at 0.7%, and UGC Unboxing at 0.4%.
One honest warning. It was a thin cycle, and the rows that moved are small. A move that size on a row under 1% of ads could be labelling drift as much as a trend. So read it as a quiet month, not a signal. The firm part is the negative: no row carries a loss, so no row supports a brief that retires a concept.
So which of the risers is worth a look? Start with the one where the deal is the layout.
Offer-first banner: the deal is the layout
An offer-first banner is a concept where the deal is the layout: the saving or the price is the first thing the ad puts in front of you. It carried 1.1% of all ads in September, up from 0.9%, on 737 ads from 212 brands. Among the gaining concepts we can show, it's the largest.


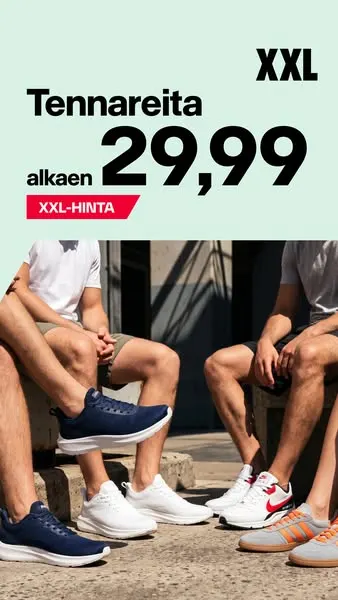

wilko.com opens on “Shop Garden and Outdoor Essentials for less”. Two more are here in their own language, with a plain English gloss beside them: bahne.dk with “save up to 50%”, and xxl.fi with sneakers from 29.99€. What the three share is the order of information. The saving lands before the product category in every one. A fourth, faunusplant.ro, leads with a book to download instead of a saving.
The deal is one kind of thing a shopper can check. Another is a stranger's own words.
Customer Testimonial Reel: a shopper's sentence as the opener
The Customer Testimonial Reel carried 1.0% of all ads in September, up from 0.9%, on 675 ads from 305 brands. Ads filed here hand the first line to a shopper's own sentence or a review count. The brand's claim waits for the headline.

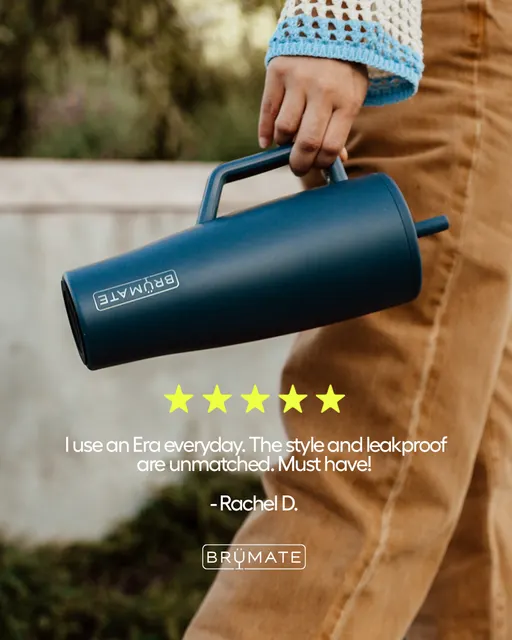
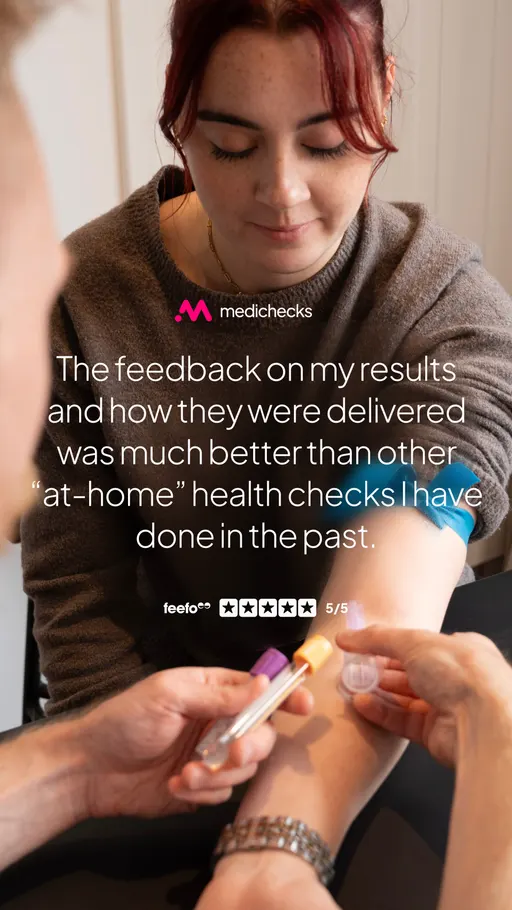
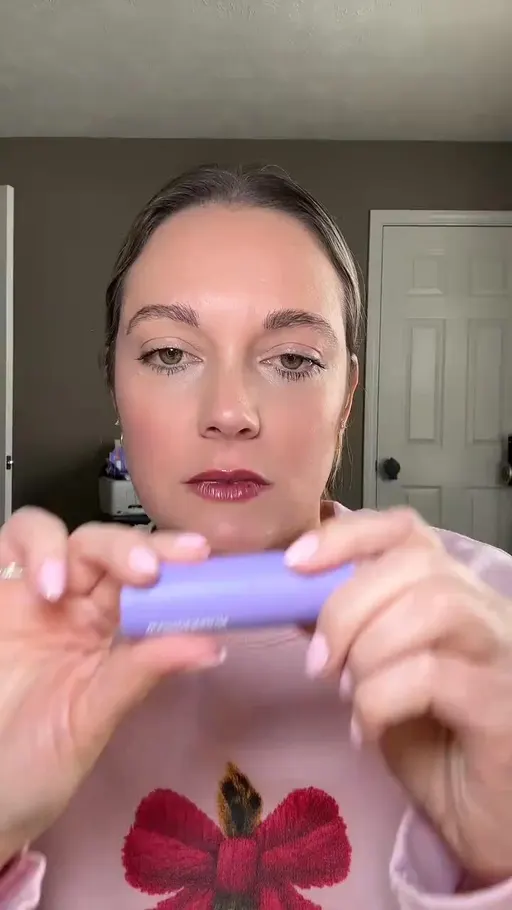
The pattern holds across all four. The opening words belong to somebody who bought, and the product's own name arrives later. shadestation.co.uk and brumate.com lead with a review count in the headline or the line. medichecks.com and wonderskin.com open on a customer saying how it went.
Ready to test? Here are three tests built from this month.
Three tests that fit a flat month
- An offer-first still. Put the saving in the first line against your current control. Offer-first banner holds 1.1% of all ads, against 0.9% in August.
- A customer's sentence as the opener. Test a review line in the first words against your best product-led opener. 305 brands ran a testimonial reel in September.
- Add, don't swap. Keep your close-up control on air and give the new slot to a second concept. The close-up held 9.1% of all ads in both months.
Skip the spreadsheet
The eCommerceBenchmark Ad Library sorts your ads into the same hooks, angles, concepts and offers used in this report and shows your mix next to the market, so you can see which shapes you have never shipped.
Audit my creatives, freeBefore you pick a test, look at how big each of these lanes really is. The ad count and the brand count tell different stories.
Ads and brands behind the four gains
Brands with at least one ad of each concept in September 2026. Source: eCommerceBenchmark Ad Library, 2026.
| Concept | August | September | Ads | Brands |
|---|---|---|---|---|
| Cinematic B-roll | 4.6% | 4.9% | 3,326 | 744 |
| Offer-first banner | 0.9% | 1.1% | 737 | 212 |
| Customer Testimonial Reel | 0.9% | 1.0% | 675 | 305 |
| Montage | 0.6% | 0.9% | 634 | 173 |
Ad count and brand count don't move together. The Testimonial Reel sits on fewer ads than the Offer-first banner but on more brands. So that gain came from a wider set of advertisers, each running fewer ads. Montage is the narrowest of the four on brands.
Last: the mistake that costs the most when a month looks like this.
The mistake: rotating out of a concept nobody left
The habit is reading a flat row as a falling one, and then writing a replacement brief for it. A concept that holds 9.1% of all ads in both months has lost nothing.
When a whole field does it in the same month, the small lanes fill with first attempts, while the staging most of the market already runs gets quieter for no measured reason. Nothing here says which of those is the better place to spend. It says only that the move out wasn't forced.
Your test card
Here is the first test from this article, set up the way a media buyer would run it. Fill in the blanks with your own numbers, and write them down before you launch.
| Hypothesis | An offer-first still, added next to my close-up, will hold my cost per purchase without taking budget from the control. |
| Change only this | Add one new ad with the saving in the first line. Do not turn off the close-up. |
| Keep the same | Product, audience and placement. The close-up control keeps running as it is. |
| Funnel stage | Say first whether this ad is for prospecting (cold) or retargeting (warm). A deal in the first line is often right for warm audiences and wrong for cold ones, so test it where the ad will really run. |
| Setup | One control and one variant, same audience, same placement, even budget split. Do not edit either ad while the test runs. |
| How long and how much | Until each version has about 50 purchases, or two full weeks, whichever comes later. This is general testing practice (Meta's own learning-phase guideline is about 50 results per ad set per week), not a library finding. |
| Success metric | Cost per purchase, not clicks. |
| Stop rule | Pause a variant that has spent about 3 times your target cost per purchase with no purchase. If it is close, keep it running. |
| What counts as a win | The variant beats the control on the metric by an amount you would act on, and still does in a second week. |
Key takeaways
- No concept fell: the list of concepts ranked by biggest drop in share came back empty for September against August 2026, so no row here supports retiring a concept [eCommerceBenchmark Ad Library, 2026].
- The Product Demo Close-Up carried 9.1% of all ads in both months, on 6,208 ads from 1,067 brands. Read that row as holding.
- Cinematic B-roll went from 4.6% to 4.9% of all ads, the widest gain by brand count.
- Montage went from 0.6% to 0.9%, which is still a small lane to brief into.
- Offer-first banner went from 0.9% to 1.1%, the largest gain with a still card you can copy from.
Questions
Sort your last month of ads into the same concept buckets this piece used. If the row you were about to retire is the one holding 9.1% of the market's ads in both months, leave it on air. Give the new slot to a bucket you have no card for at all: an offer-first still, or a customer's own sentence as the opener. The month's movement was additive, four rows up and none down. So a swap costs you the concept you already run and buys nothing the numbers asked for.