The eCommerce Ad Report, September 2026: 28.1% of Ads Opened by Holding Back the Point

Scope: 68,341 classified ads from September 2026, every industry and country the eCommerceBenchmark Ad Library tracks, 2,573 brands in the ad sample. This cut has no per-country or per-industry split.
We classified 68,341 ads running in September 2026, from every industry and country we track. The month's most common ad is easy to picture. It opens without saying its point, it sells who the buyer is, and it asks for nothing: 57.3% of ads carry no offer at all. Below: the ads behind each of those three, the small buckets that gained share, and the test the month justifies.
28.1% of Ads Open by Holding Back the Answer
A curiosity gap hook is defined as an opening line that holds back the thing the reader wants to know, so the only way to get it is to click. It opened 28.1% of the month's ads, about 19,188 of them. At least one of those ads came from 1,961 separate brands. In August the same opening sat on 28.5% of ads, so the market's default first line was the same first line two months running. Each share here counts every ad active in the month, not only the ads launched in it.

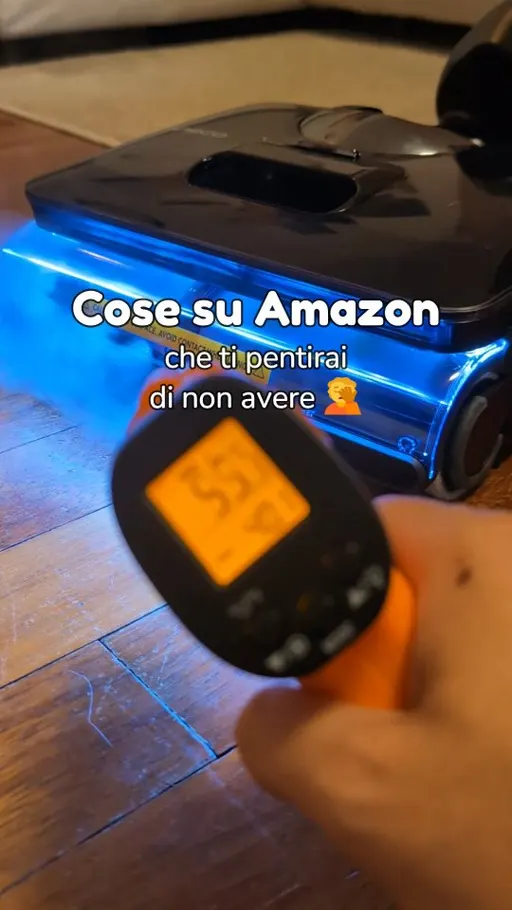

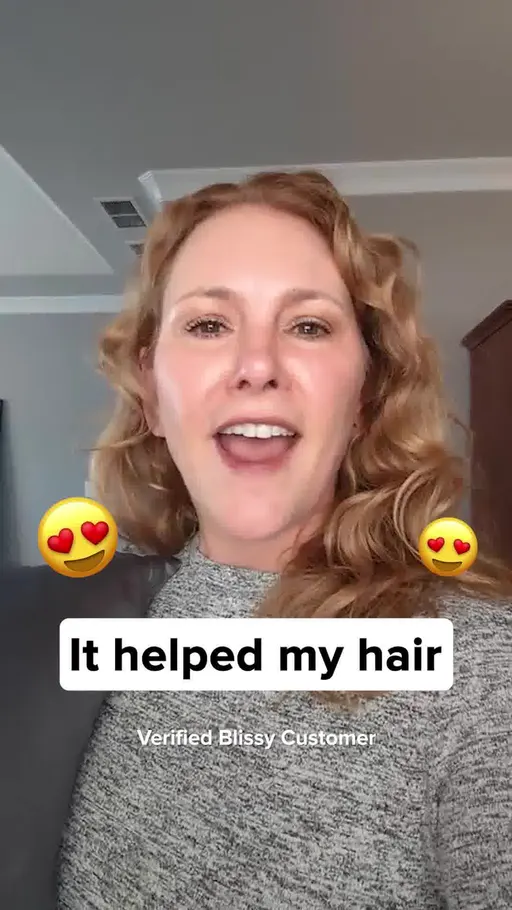
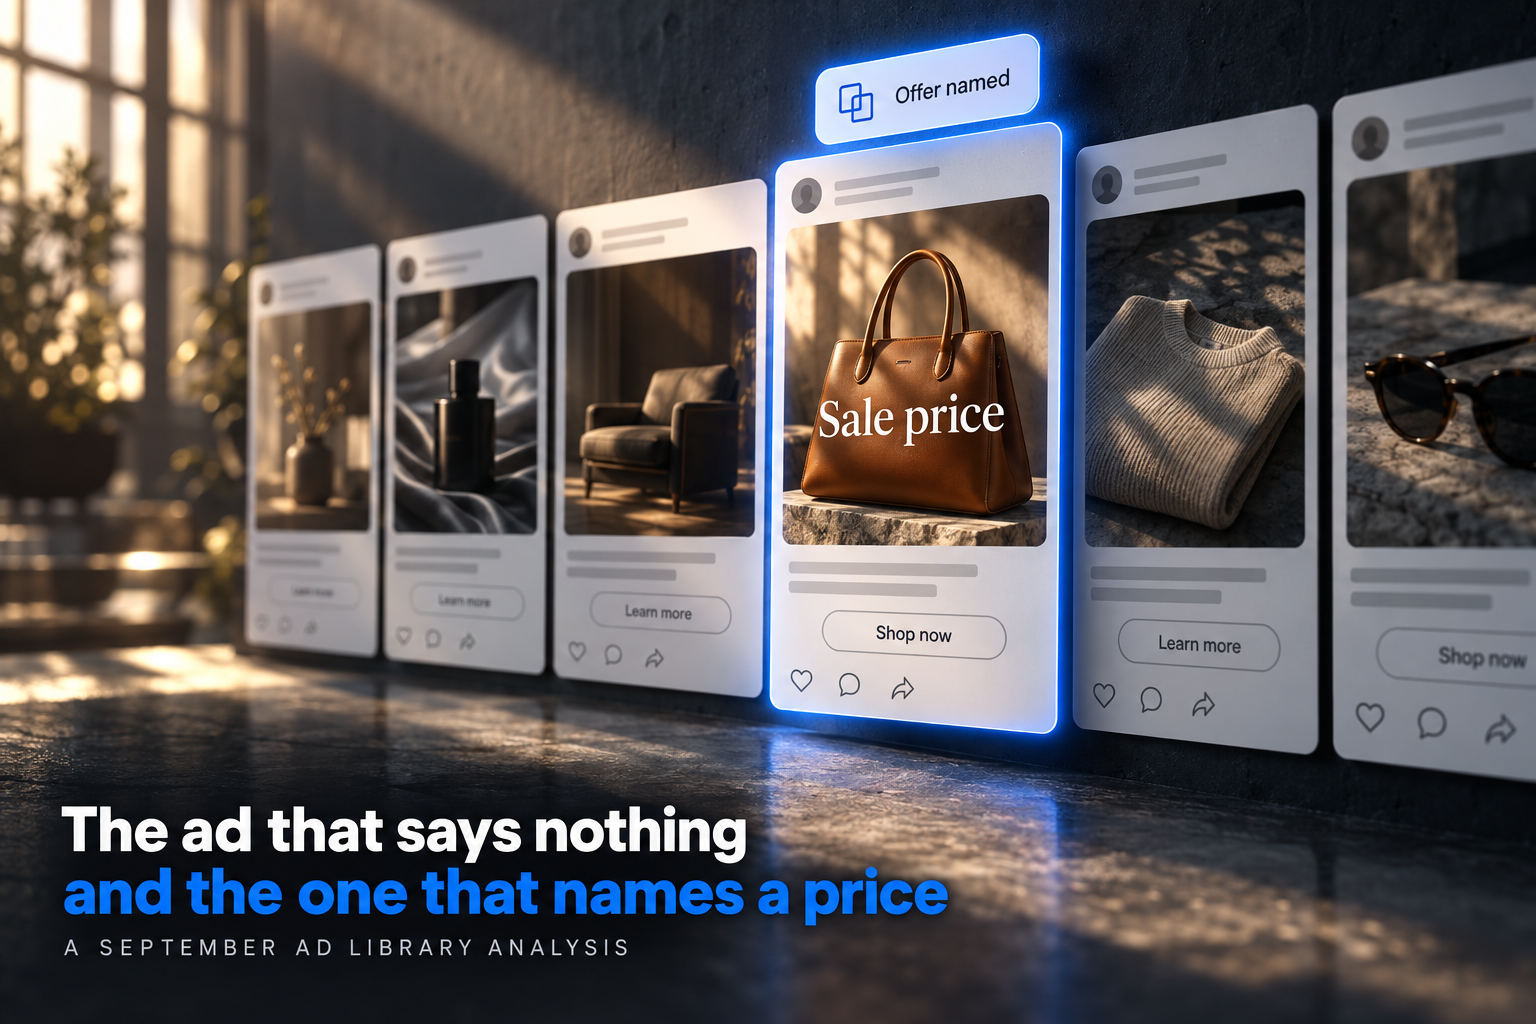
One of those openings, in the advertiser's own words: strathberry.com ran "A symphony of suede. Turn the volume up." There is no product in that line, no price and no date. The ad has been on air 386 days, which tells you how long the brand kept it live, not what it sold. The cards below hold their point back the same way.
Identity Is the Market's Main Selling Angle at 25.7%
An identity angle is defined as a selling angle that tells the reader who the product is for instead of naming a problem it fixes. It carried 25.7% of September's ads, about 17,556 of them. Those ads came from 1,663 brands. In August the angle sat on 25.4%. The next angle down, problem-aware, was on 11.9% of ads, so the market named a buyer far more often than it named a problem.
An identity line tells a shopper which group they are joining. It does not say what goes wrong without the product, and it does not have to carry a price.
What to copy: these openings spend their first three words on mood or on who the buyer is, and the thing a shopper can price sits in the headline beside them, or nowhere. Write one version that swaps the two: the priceable thing first, the mood second, and read both lines together before you ship it.
57.3% Carry No Offer, and That Share Held
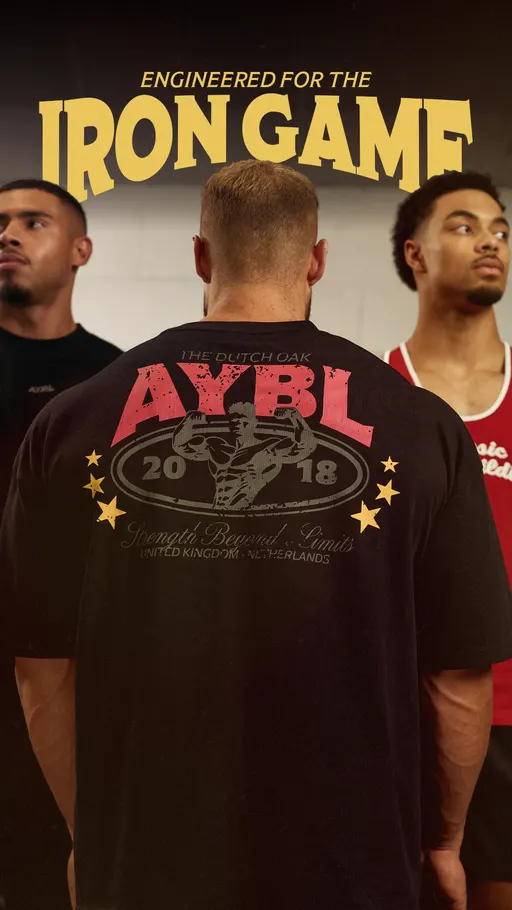
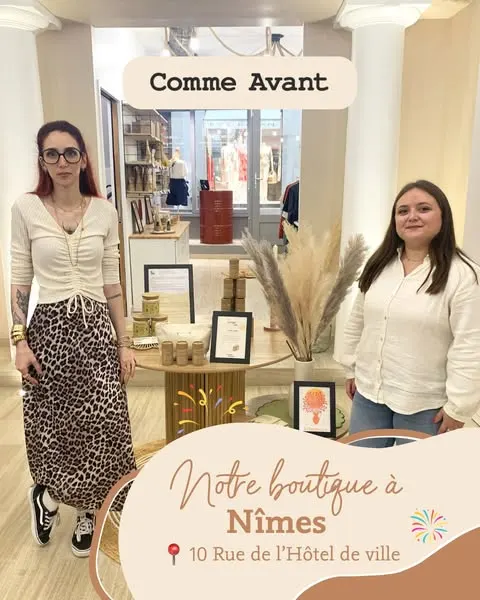
The biggest offer bucket in September was no offer at all: 57.3% of ads, about 39,140 of them. They came from 2,070 brands. August's share was the same 57.3%, so this is two flat months rather than a swing. Discount came next at 15.7%. Free shipping was on 4.6% of ads and bundle on 2.7%.
| Offer | Share of ads | Ads | Brands |
|---|---|---|---|
| No offer (brand ad) | 57.3% | 39,140 | 2,070 |
| Discount | 15.7% | 10,742 | 1,433 |
| Free shipping | 4.6% | 3,168 | 747 |
| Bundle | 2.7% | 1,821 | 538 |
| Free gift | 1.8% | 1,262 | 365 |
| Free trial | 1.6% | 1,084 | 306 |
A brand ad with no offer can still sell. It moves the price, the terms and the reason to act today onto the landing page. In the library's longevity-ranked sample, 61.1% of the ads in this bucket have been on air 60 days or more: staying power inside a sample, never a result.
Newness Hooks Rose From 0.7% to 1.1%
Newness was the opening on 1.1% of September's ads, about 742 of them. Those ads came from 143 brands. In August the hook sat on 0.7% of ads. Bold claim moved the same way, from August's 0.8% to 1.2% of September ads.
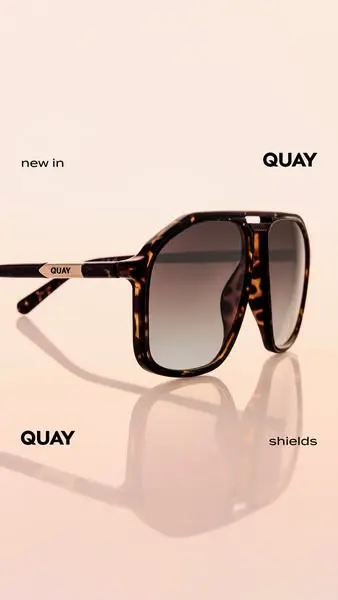
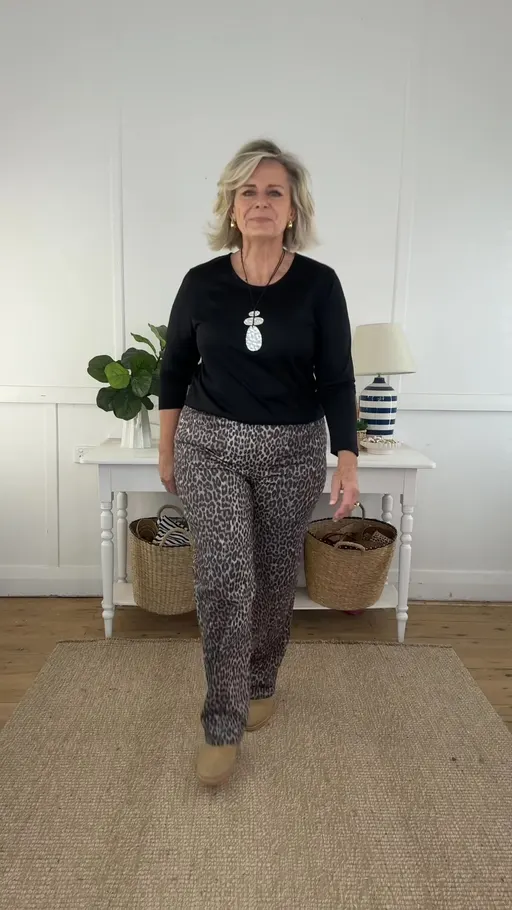
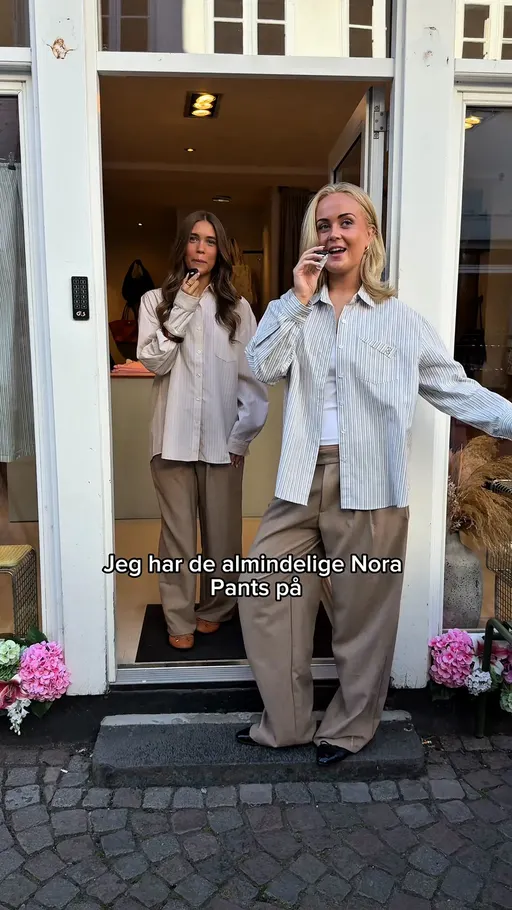
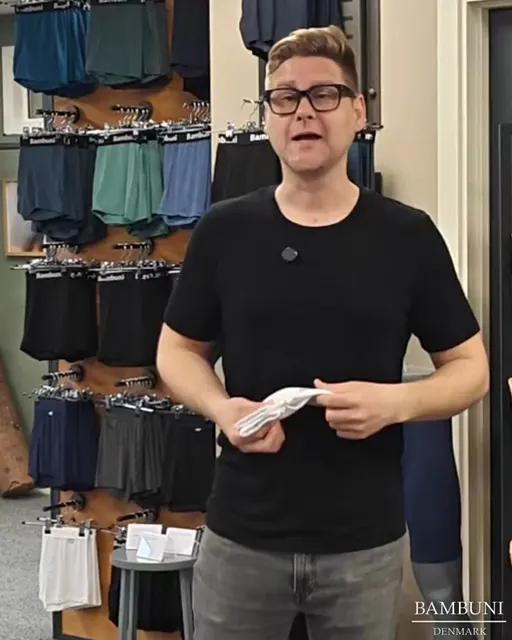
Both of those openings put something checkable in the first words: a model, a range, a date a thing landed. Both sit low on the hook ladder, so a claim opening is a thin lane to brief into, and an uncrowded one.
Three tests to run next month
- An offer in the opening line. Run one ad that names the deal in its first three words against your usual tease: 57.3% of September's ads named no offer at all.
- A claim instead of a gap. Test a flat claim opening against your control. Bold claim went from 0.8% to 1.2% of ads.
- Problem line versus identity line. Same product, one opening about who it is for and one about the problem. Identity sat on 25.7% of ads and problem-aware on 11.9%.
Skip the spreadsheet
The eCommerceBenchmark Ad Library sorts your ads into the same hooks, angles, concepts and offers used in this report, and shows your mix next to the market, so you can see which shapes you have never shipped.
Audit my creatives, freeSeptember's Shares Beside August's
Every bucket that gained share in September gained by claiming or by staging something, not by cutting a price. Solution-aware, an angle written for a shopper already looking for a fix, reached 2.8% of ads. Identity rose to 25.7%. On screen, cinematic b-roll reached 4.9% of ads. Montage reached 0.9%. Concept shares rest on fewer ads than hook and angle shares, so read concepts against each other only.
Source: eCommerceBenchmark Ad Library, 2026.
The falls sat at the top of the hook ladder. Curiosity gap was the month's most common opening and still eased to 28.1%. Authority eased to 6.4% of ads. Neither move is big, and that is the thing worth briefing on: the market's default ad in August was the market's default ad in September.
The Risk When Every Opening Is a Tease
Briefing the first line as a tease by default is the habit these shares describe. The reader of your ad meets a line that promises an answer and names no product, no price and no date. The only way to learn anything is to click. When most of a feed is written that way, a shopper meets four teases in a row and learns that a tease carries no information. The fifth gets scrolled past unread, including the one that had something to say. With 28.1% of ads opening on a held-back point, and the no-offer bucket at 57.3%, the fifth ad is a common place to be.
Key takeaways
- Curiosity gap opened 28.1% of ads, about 19,188 of 68,341, with 1,961 brands running at least one [eCommerceBenchmark Ad Library, 2026]: if it is your only opening, you are writing the market's default.
- Identity was the selling angle on 25.7% of ads, about 17,556 of them, against 11.9% for problem-aware: the market named the buyer more often than the problem.
- 57.3% of ads carried no offer, about 39,140 from 2,070 brands, the same share as August: the landing page is doing the selling.
- Newness rose from 0.7% to 1.1% of ads and bold claim from 0.8% to 1.2%: September's gains went to openings that claim something.
- Discount sat at 15.7% of ads and free shipping at 4.6%: the deal buckets barely moved, so an offer line is still a thin lane to brief into.
Questions
Pull last month's ads and sort them into four boxes: opening, angle, concept, offer. The market's default ad in September teased, named a buyer and asked for nothing, with 57.3% of ads carrying no offer at all. If your offer box and your claim box are both empty while every opening holds its point back, you are briefing the same ad as everyone else. Write one ad for next month that names the thing a shopper can price in its first line, and read it beside your usual tease before you ship either.