Gross Margin vs Net Margin in Ecommerce: What Each Hides

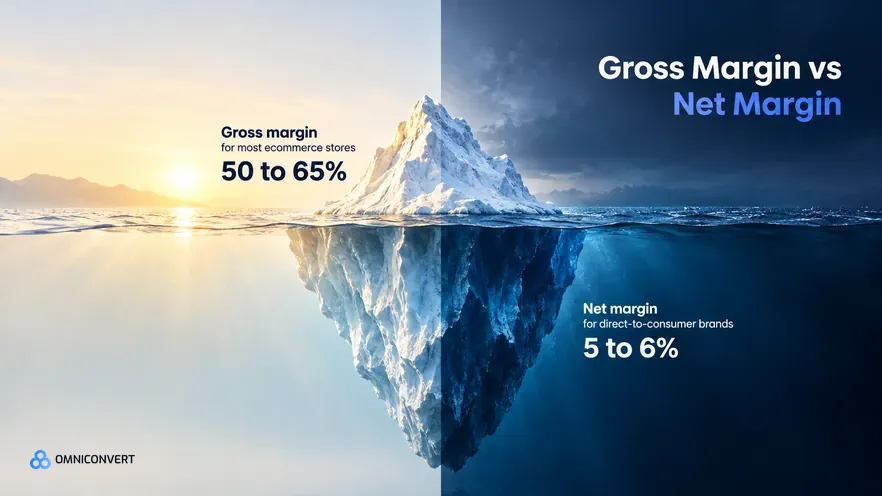
- Gross margin subtracts only cost of goods sold and runs about 50 to 65% in ecommerce; net margin subtracts everything and has a median closer to 5 to 6% for direct-to-consumer brands.
- Gross margin lies by omission: it ignores the variable costs that scale with every order, so a reported 65% can fall to roughly 52% once discounts, returns, and free-shipping subsidies are counted.
- Net margin is accurate but lagging: it is a monthly, blended number that cannot tell you which SKU, channel, or campaign is losing money on the next order.
- Contribution margin, revenue minus all variable costs per order, is the true-profit metric that decides whether you can scale a single order; brands usually need 33 to 51% to fund paid acquisition.
- Returns are the most underpriced margin destroyer: at a roughly 20% return rate, reverse logistics and processing can erase the gross margin on a whole category.
Margin is the share of revenue a business keeps after a defined set of costs, and the definition of that set is where most ecommerce operators get misled. Gross margin keeps only cost of goods out of the picture and runs about 50 to 65% across online stores; net margin removes everything and, for direct-to-consumer brands, sits at a median closer to 5 to 6%. Across the CROBenchmark dataset of 7,000+ websites in 15+ industries, the stores that scaled paid acquisition profitably were the ones measuring profit per order, not the headline percentages [CROBenchmark Report 2026, Omniconvert].
Nexus by Omniconvert is the AI eCommerce growth engine that calculates contribution margin and true profit at the order, SKU, and channel level. This guide defines gross margin and net margin, shows why the gap between them is wider than the textbook suggests, and explains why the metric that actually decides whether you can scale, contribution margin, appears on neither line of a standard P&L.
What is the difference between gross margin and net margin?
Gross margin is defined as revenue minus cost of goods sold, divided by revenue. It answers one narrow question: after paying for the product itself, how much of each dollar of sales is left to cover everything else? A store selling a $100 item that costs $35 to source has a 65% gross margin.
Net margin is defined as net profit divided by revenue, where net profit is what remains after every cost, cost of goods, operating expenses, marketing and acquisition, payment and platform fees, shipping, returns, and tax. It answers the only question an owner ultimately cares about: did the business make money? The two formulas are simple:
- Gross margin % = (Revenue − COGS) ÷ Revenue × 100
- Net margin % = (Revenue − all costs) ÷ Revenue × 100
The trap is treating these as two views of the same truth. They are not. Gross margin tells you whether the product is viable; net margin tells you whether the business is. A store can have an excellent gross margin and a terrible net margin at the same time, and the space between them is where most ecommerce profit quietly disappears.
Why is the textbook gap between gross and net margin bigger than it looks?
Picture the same $100 order with a 65% headline gross margin. Now apply what actually happens in a real store: a 10% discount code, a 20% chance the item comes back, and free shipping the brand absorbs at $8. The discount cuts revenue, the return probability charges a fraction of the reverse-logistics cost to every order, and the shipping subsidy is a straight deduction. By the time those three land, the effective margin on that order is closer to 52%, and none of it appears in the gross-margin line.
| Line | Per $100 order | Running margin |
|---|---|---|
| Revenue | $100.00 | — |
| Cost of goods sold | −$35.00 | 65% |
| Discount (10% code) | −$10.00 | ~58% |
| Free-shipping subsidy | −$8.00 | ~54% |
| Returns allocation (20% rate) | −$2.50 | ~52% |
The lesson is not the exact figure, which varies by category, but the direction: every variable cost gross margin ignores moves the real number down, and they all scale with volume. Selling more units does not dilute these costs the way it dilutes fixed overhead, so the "textbook gap" widens precisely when you grow.
Why does gross margin hide costs?
Think of margin as an iceberg. Gross margin is the tip above the waterline, the part that is easy to see and comfortable to report. Below the surface sit the costs that actually sink stores: a 2 to 3% payment-processor fee on every transaction, marketplace or platform commissions, the acquisition cost of the ad that won the customer, the discount that closed the sale, and the shipping the brand ate to hit a free-shipping threshold. Gross margin sees none of it.
This is why the metric flatters. It was designed for a manufacturer asking whether a product is priced above its production cost, a genuinely useful question. But in ecommerce the costs that decide profitability are overwhelmingly the variable ones gross margin omits. A brand can raise gross margin, by sourcing cheaper or lifting price, and still lose more on each incremental order because acquisition and fulfillment costs climbed faster. Watching gross margin alone is watching the tip of the iceberg and steering into the rest of it.
Nexus by Omniconvert nets COGS, shipping, fees, discounts, and returns out of every order, so you see the profit under the waterline, not just the tip.
See how it works →Why does net margin arrive too late?
Net margin has the opposite problem to gross margin: it hides nothing, but it arrives too late and too coarse to act on. It is a lagging, aggregate metric, produced after the accounting period ends and blended across everything you sell. A 6% net margin might be a healthy 15% product subsidizing a −4% one, and the single number will never tell you which is which.
For DTC brands the median net margin lands around 5 to 6%, with a typical range of 3 to 10% and top-tier operators above 20% [G2, 2026]. That thin band is exactly why timing matters: at 5% net, a single unprofitable channel scaled for a month can wipe out the quarter, and you will only see it in the rear-view mirror. Net margin is the right scorecard for the business as a whole. It is the wrong instrument for the decision you have to make today about a specific SKU, campaign, or channel.
Which metric actually governs ecommerce profit?
Between the flattering gross line and the lagging net line sits the number that actually governs scaling decisions: contribution margin is defined as revenue minus all variable costs on a single order. It matters because it answers the one question gross and net margin cannot, whether selling one more unit adds profit or subtracts it. Unlike gross margin, it counts fees, shipping, discounts, and returns; unlike net margin, it is available per order, per SKU, and per channel, in real time rather than after the books close.
This is the leaky-bucket principle from unit economics: never pour acquisition spend into a funnel whose per-unit economics are negative, because more traffic and more conversions just mean more losses. A SKU with a healthy gross margin but a negative contribution margin gets worse the more you sell it. Operators generally need a contribution margin in the 33 to 51% range to fund paid ads and still net a profit, which is why contribution margin, not gross margin, is the real gate on ad spend [Omniconvert, 2026].
In our CVO work with ecommerce brands through 2026, we consistently see teams discover that one or two of their best-selling products carry the worst contribution margins, because volume and discounting had masked the per-order math [Omniconvert, 2026]. The fix is never more traffic. It is repricing, re-bundling, or removing the SKU that leaks on every order.
This is the distinction between a vanity metric and an actionable metric. Gross margin and net margin are lagging and aggregate; contribution margin per order, SKU, and channel is leading and specific. Changing what you measure, from headline percentages to per-order true profit, is what turns the P&L from a report card into a steering wheel. AliveCor used Omniconvert to run a structured A/B testing programme and achieved +21% conversion rate, +5% revenue per visitor, and 94% statistical relevance across their experiments, gains that only translate to profit when each incremental order clears its variable costs [Omniconvert, AliveCor case study].
How much do returns cost your margins?
A return is not a neutral event that simply undoes a sale. It reverses the revenue and incurs fresh cost: reverse shipping, inspection, repackaging, restocking, and the share of items that come back unsellable. Estimates put the handling cost at roughly 8 to 18 dollars per returned item, higher in bulky or apparel categories. With average ecommerce return rates near 19 to 20% and apparel running 20 to 40%, this is not a rounding error [Richpanel, 2026].
The brands that plateau at a 5% net margin consistently share one pattern: they treat returns as a customer-service line item instead of a variable cost of every order. The benchmark gap closes fastest when operators model a returns allocation into per-order profitability as a first-class cost, not when they chase more traffic to outrun it. A category with a 25% gross margin and a 30% return rate can be net-negative on contribution before overhead is even considered, and no gross-margin report will ever show it.
Why does the same product have different true margins?
Gross margin treats a unit as a unit: same product, same cost of goods, same margin. But the moment you account for variable costs, the channel rewrites the math. Sell direct and you carry acquisition cost and your own fulfillment; sell through a marketplace and you trade those for referral fees, fulfillment fees, and storage, often 15% or more before shipping. The product is identical; the true profit is not.
This is why blended margin is dangerous for multi-channel brands. A store that averages DTC and marketplace performance into one net margin cannot see that it is subsidizing a thin-margin channel with a fat one, or scaling the wrong one. Contribution margin measured per channel restores the truth the average erased, and it frequently reverses which channel a brand thought was its most profitable.
How do you calculate true profit per order?
The calculation is not complicated; the discipline is in doing it per order rather than in aggregate. Work down the order:
-
Start with order revenueThe actual amount paid, after any discount code, not the list price.
-
Subtract cost of goods soldThe landed cost of the products in the order, including inbound freight and duties.
-
Subtract fulfillment and shippingPick, pack, and the shipping you actually paid, including any free-shipping subsidy you absorbed.
-
Subtract payment and platform feesProcessor fees of roughly 2 to 3%, plus any marketplace referral or fulfillment fees on that channel.
-
Subtract a returns allocationYour category return rate multiplied by the per-return handling cost, charged to every order so profitable orders carry their share.
What remains is contribution margin, your true profit on that order, the number that tells you whether to scale it. Subtract a fair allocation of fixed overhead, salaries, rent, software, and tax, and you arrive at net profit for the business. Do the first calculation per SKU and per channel and you will find winners and losers a blended margin buried, which is exactly the work ranking opportunities by true profit automates. Pair it with profit per visitor to connect per-order economics to traffic quality.
Gross vs net margin FAQs
Gross margin is revenue minus cost of goods sold, shown as a percentage of revenue, and it tells you whether a product is viable to sell. Net margin is what is left after every cost, operating expenses, marketing, payment fees, and tax, and it tells you whether the business itself is profitable. Gross margin is the widest, most flattering profit line; net margin is the narrowest and most honest. In ecommerce the two are often 50 percentage points apart.
Neither in isolation. Gross margin flatters you by ignoring the costs that vary with each order, and net margin is accurate but too lagging and too blended to steer a daily decision. For per-order calls on pricing, promotions, and ad spend, contribution margin matters most, because it isolates the true profit on the next unit sold. Net margin remains the final scorecard for the whole business, but you cannot run today's decisions on last month's blended number.
For most direct-to-consumer brands a realistic net profit margin sits between 3 and 10%, with a median closer to 5 to 6%. A net margin above 10% is strong, and 20% or higher is top-tier and usually reflects premium pricing or an efficient, low-return category. Anything consistently negative means the unit economics are broken, not just the overhead. Category matters: electronics run thin, while beauty and supplements can run far higher.
Contribution margin is net revenue minus every variable cost tied to an order, cost of goods, shipping, payment and platform fees, discounts, and returns. Standard profit-and-loss statements group costs by type, not by whether they vary with volume, so they never isolate it. That is why a store can show a healthy gross margin and a positive net margin overall while individual SKUs or channels quietly lose money on every incremental sale.
A return does two kinds of damage. It reverses the sale, removing the revenue, and it adds roughly 8 to 18 dollars per item in reverse shipping, inspection, processing, and restocking, sometimes more in bulky or apparel categories. At an ecommerce return rate near 20%, those costs compound fast and can erase the gross margin on an entire category. This is why returns must be modeled as a variable cost per order, not written off as a rounding error.
Nexus by Omniconvert ingests your transactional and cost data, then calculates contribution margin and true profit for every order, SKU, and channel, netting out COGS, shipping, fees, discounts, and returns rather than stopping at revenue or gross margin. It ranks growth opportunities by true profit, so budget flows to the segments and products that actually pay after all variable costs, not the ones that merely look busy in a revenue or ROAS report.
Gross margin flatters, net margin lags, and the metric that actually decides whether your next order makes money is contribution margin, revenue minus every variable cost. A brand can grow gross margin, grow revenue, and still lose money on each incremental sale when fees, discounts, and a 20% return rate go unpriced. Calculate true profit per order for your top ten SKUs this week, split by channel, and you will find at least one that looks healthy on the P&L and bleeds on every unit. That is the decision gross and net margin were never built to make, and it is the one Nexus by Omniconvert is built to surface. See opportunities ranked by true profit.
Measure true profit per order, not just gross and net margin
Nexus by Omniconvert calculates contribution margin and true profit for every order, SKU, and channel, netting out COGS, shipping, fees, discounts, and returns, then ranks your growth opportunities by the profit that survives all of them. Stop steering on a margin that flatters or one that lags.