ROAS vs Contribution Margin vs True Profit: Which to Use

- ROAS knows only two numbers, revenue and ad spend, so it cannot tell a 60%-margin product from a 20%-margin one.
- Contribution margin subtracts every variable cost of serving an order, which makes it smaller and more honest than gross margin.
- True profit is contribution margin minus marketing spend: the only one of the three that answers whether the order made money.
- Break-even ROAS equals 1 divided by your contribution margin percentage, which is why a good ROAS is a per-product number, not an account-wide one.
- A single account-wide ROAS target quietly funds your worst-margin products and starves your best ones.
- First-order true profit undervalues customers who come back, so read it beside predicted lifetime value rather than on its own.
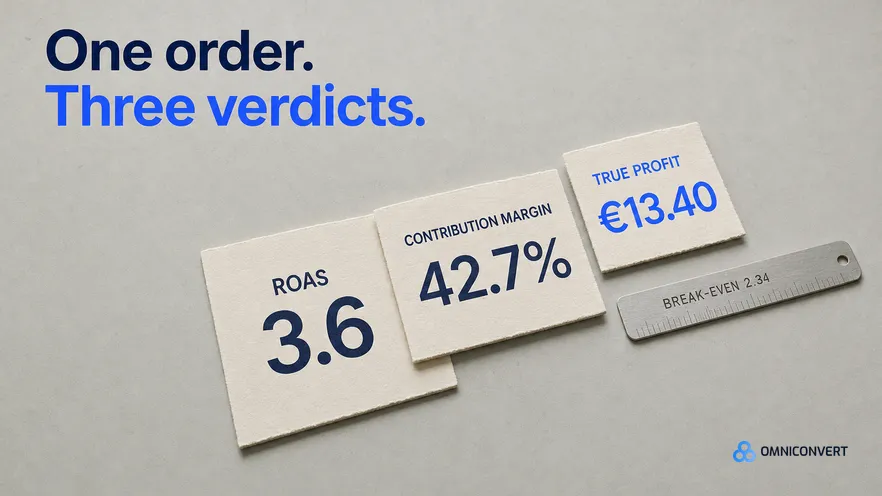
Three teams can look at the same order and reach three different verdicts. The media buyer sees a 3.6 ROAS and calls it a win. The merchandiser sees a 42.7% contribution margin and agrees. The founder sees €13.40 left over and asks why growth feels so expensive. None of them is wrong. They are answering different questions with different numbers, and the confusion costs real money when the ad budget gets set. Here is what each metric actually measures, worked on one order, and which one should govern spend.
What are ROAS, contribution margin, and true profit?
The important distinction is which costs each metric is blind to. ROAS is blind to all of them. Contribution margin sees the fulfilment costs but not the advertising. True profit sees both, which is why it is always the smallest of the three and the only one worth arguing about at the end of a month.
If true profit itself is the unfamiliar term here, the full definition, the include-exclude test for each cost line, and the three mistakes that inflate it are in what is true profit in eCommerce. The narrower input questions, such as how to provision returns or whether free shipping counts, are answered in the true profit FAQ.
One clarification worth making early, because it causes more errors than any other: contribution margin is not gross margin. Gross margin subtracts the cost of goods sold and stops. Contribution margin keeps going through payment fees, fulfilment, shipping and returns. It is always smaller, and it is the number that matters, because those costs scale with every extra order you win.
How do ROAS, contribution margin, and true profit compare?
| ROAS | Contribution margin | True profit | |
|---|---|---|---|
| What it measures | Revenue returned per unit of ad spend | What survives the variable costs of an order | What the order actually earned |
| Formula | Attributed revenue ÷ ad spend | Order value − variable costs | Contribution margin − marketing spend |
| Costs it ignores | All of them | Advertising, fixed overhead | Fixed overhead only |
| Expressed as | A ratio | Currency or % | Currency or % |
| Question it answers | Is this channel returning revenue? | Can this product fund the business? | Did we make money? |
| Where it breaks | When margins differ by product | When compared across channels without CAC | When used to judge one channel alone |
| Who lives in it | Media buyer | Merchandiser | Founder or CFO |
How can one order give three different answers?
Take a €100 product sold with a 10% discount, so the order value is €90. The numbers below are an illustrative example, not benchmark data; substitute your own costs and the method holds.
| Line | Amount | Running total |
|---|---|---|
| List price | €100.00 | — |
| Discount (10%) | −€10.00 | €90.00 order value |
| Cost of goods | −€35.00 | €55.00 |
| Payment fees | −€2.60 | €52.40 |
| Pick, pack and ship | −€8.00 | €44.40 |
| Returns provision | −€6.00 | €38.40 contribution margin |
| Advertising (CAC) | −€25.00 | €13.40 true profit |
Now read the same order three ways. ROAS is €90 ÷ €25, which is 3.6. Contribution margin is €38.40, which is 42.7% of order value. True profit is €13.40, which is 14.9%. Every one of those numbers is correct, and only the last one is the answer to "did we make money".
What can ROAS alone never tell you?
Contribution margin does something ROAS cannot do for itself: it sets the bar ROAS has to clear.
At a 42.7% contribution margin, break-even ROAS is 1 ÷ 0.427, or about 2.34. Anything above that earns money, so the 3.6 in our example is genuinely good. Change the margin and the verdict flips without the ROAS moving at all.
| Contribution margin | Break-even ROAS | Verdict on a 3.6 ROAS |
|---|---|---|
| 60% | 1.67 | Comfortably profitable |
| 42.7% | 2.34 | Profitable |
| 30% | 3.33 | Barely above water |
| 20% | 5.00 | Losing money on every order |
| 15% | 6.67 | Losing money badly |
This is the practical payoff of the whole comparison. If you run one ROAS target across an account that sells products at 60% and 20% margins, you are simultaneously starving the products that could take more budget and funding the ones that lose money. The target has to be derived per product group, from the margin of what that group sells.
Which number should govern ad spend?
The instinct to pick a single source of truth is the wrong instinct here. The three metrics are sequential, not competing.
The failure mode worth naming: teams that optimize on true profit alone starve their campaigns of signal, because the number arrives too late and too aggregated for a bidding algorithm to use. Teams that optimize on ROAS alone hit their target and lose money. The sequence above avoids both.
What do all three metrics still miss?
Here is the limit of the whole framework. Every metric on this page evaluates one transaction. A customer who buys once at 14.9% margin and a customer who buys four more times at the same margin look identical in all three columns on the day they first order.
That is why the brands that scale profitably read first-order true profit beside predicted lifetime value and the LTV:CAC ratio. A thin first order is an easy yes when the segment repeats, and an easy no when it does not. Without that view, you are forced to treat every buyer as a one-off, which means underbidding on the customers worth the most.
Omniconvert Commander (formerly Nexus) unifies purchase and behavior data into one customer view, segments customers by value, and predicts lifetime value, so first-order margin becomes a decision rather than a guess.
See how it works →How does the message, not just the margin, move the number?
AliveCor ran a structured A/B testing programme with Omniconvert and achieved a 21% lift in conversion rate, a 5% lift in revenue per visitor, and 94% statistical relevance across their experiments [Omniconvert, AliveCor case study]. Read that against the worked example above: revenue per visitor sits directly upstream of every one of the three metrics, so a lift there raises ROAS, contribution margin and true profit at once, without touching a single supplier cost.
ROAS vs contribution margin vs true profit FAQ
ROAS divides attributed revenue by ad spend, so it only knows two numbers and ignores what the order cost you to fulfil. True profit subtracts every variable cost, including product cost, payment fees, shipping, returns and the advertising itself.
A 3.6 ROAS can leave a healthy margin on one product and lose money on another, because ROAS never sees the difference between them.
No. Gross margin subtracts the cost of goods sold and stops there. Contribution margin subtracts every variable cost of serving that order: product cost, payment processing, pick and pack, shipping, and a provision for returns and discounts.
Contribution margin is always the smaller and more honest of the two, because it counts the costs that scale with each extra order.
There is no universal good ROAS, because the threshold is set by your contribution margin. Break-even ROAS equals 1 divided by your contribution margin percentage.
At a 42.7% contribution margin you break even at a ROAS of about 2.34, so 3.6 is profitable. At a 20% contribution margin, break-even is 5.0, and that same 3.6 loses money on every order.
Start with the order value after discounts. Subtract the cost of goods, payment fees, pick and pack, shipping and a returns provision to get contribution margin. Then subtract the advertising spend attributable to that order, usually your blended customer acquisition cost.
What is left is true profit before fixed overheads such as rent, salaries and software.
Bid on ROAS, judge on contribution margin. Ad platforms need a fast in-platform signal, and ROAS is the one they optimize toward reliably.
But set each campaign's ROAS target from the contribution margin of the products it sells, so a low-margin campaign carries a higher bar than a high-margin one. A single account-wide ROAS target quietly funds your worst products.
Omniconvert Commander unifies purchase and behavior data into one customer view, segments customers by value, and predicts lifetime value.
That moves the question from what an order earned today to what a customer is worth over time, so you can accept a thin first-order margin when the segment repeats, and refuse it when the segment does not.
Keep all three. ROAS steers the campaign because it is the signal the ad platforms optimize toward. Contribution margin sets the ROAS target, because break-even is a function of margin and nothing else. True profit settles the argument at the end of the month. The mistake that costs the most is not choosing the wrong metric, it is running one account-wide ROAS target across products whose margins are nothing alike. Derive the target per product, then read the result beside what those customers are worth over their lifetime rather than on their first order alone.
Judge the customer, not just the order
True profit tells you what an order earned today. It cannot tell you which buyers come back. Omniconvert Commander unifies purchase and behavior data into one customer view, segments by value, and predicts lifetime value, so a thin first order becomes an easy yes when the segment repeats and an easy no when it does not.