Electronics & Gadgets Ads, September 2026: Almost 1 in 4 Look the Same. Is Yours One of Them?

Scope: Electronics & Gadgets ads across every country the eCommerceBenchmark Ad Library tracks, 2,281 ads active in September 2026 from 72 brands. This cut has no per-country and no sub-category split. Where we say “the whole market”, we mean all industries and countries together, 68,341 ads in September 2026.
Picture a wall of gadget ads. Now picture almost every one of them showing the product up close, big and shiny.
That is not a joke. That is September in Electronics & Gadgets. Nearly one ad in four was staged the same way, and two out of three brands did it.
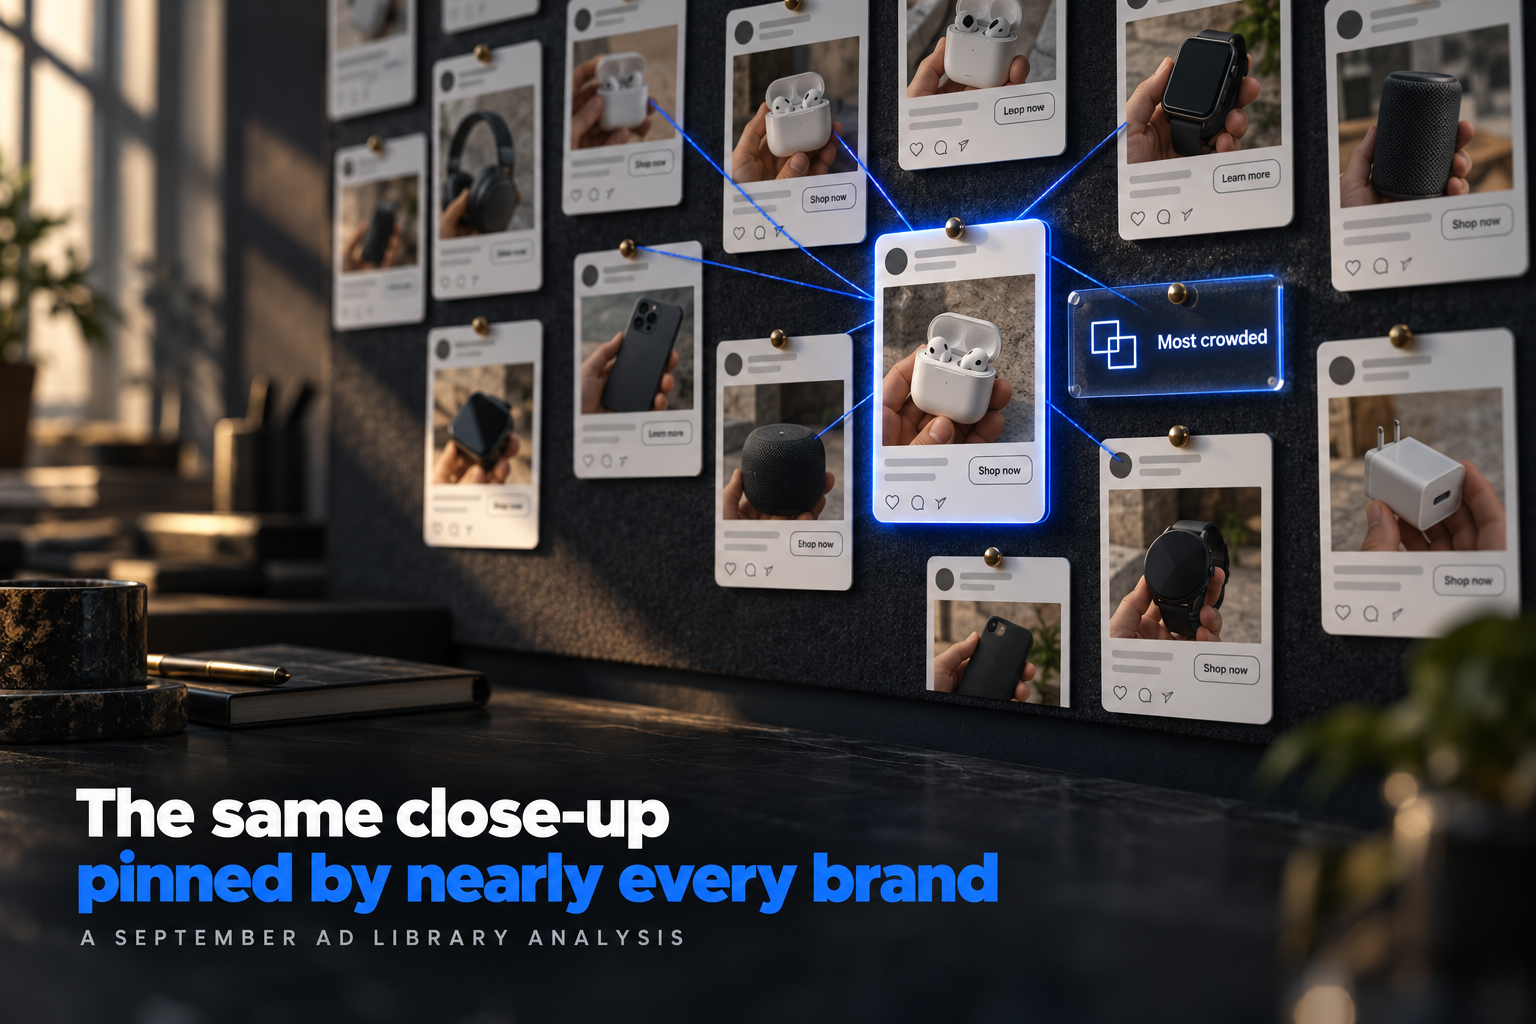
Electronics brands did not spread their staging out. One look carried 23.2% of the vertical's ads. It ran on 48 of the 72 brands tracked here, while the next look down ran on 23 [eCommerceBenchmark Ad Library, 2026]. In the whole market, that same look holds just 9.1% of ads. So how crowded is crowded? We'll show you.
- The shopper sees the same picture from almost everybody. When 48 of 72 brands stage the product the same way, the staging stops telling the shopper anything.
- Electronics is more crowded than the market. The close-up holds 23.2% here and 9.1% across all industries.
- The first line is where you can stand out. That is the part a shopper has not already seen from somebody else, and a short test can check it.
Here is what we will cover: the crowded lane, the thin tail behind it, two electronics ads in their own words, what moved since August, and the test a crowded lane is begging for. First, the lane.
Product Demo Close-Up: 23.2% of Ads, 48 of 72 Brands
A concept is defined as the way an ad is staged on screen, the thing a shopper sees before reading a word. Product Demo Close-Up is defined as a concept that fills the frame with the product itself, held close enough to read its detail. In Electronics & Gadgets, that one concept carried 23.2% of September's ads [eCommerceBenchmark Ad Library, 2026].
That is 529 ads inside the month. A share here counts every Electronics & Gadgets ad running in September, not only the ones launched in it.
The brand count matters more than the share. Of the 72 brands tracked in this vertical, 48 ran at least one ad staged that way. So this is not one heavy advertiser filling a row with hundreds of ads. It is most of the field, standing in the same place, like a crowd all rushing to the same food truck.
Anybody can argue with a share. The breadth figure is harder to argue with, because it does not care how many ads any single brand ran.
So the lane is packed. But what is in the other lanes? Not much, and that is the next surprise.
The Next Concept Down Runs 3.6%, on 23 Brands
Cinematic B-roll is second, at 3.6% of the month's ads. That comes to 82 ads from 23 brands [eCommerceBenchmark Ad Library, 2026]. The distance to first place is 19.6 points of share, and 25 brands.
Third is UGC Unboxing at 1.7% of the month's ads, on 39 ads from 11 brands. Side-by-Side Comparison is fourth at 1.3%, on 29 ads from 12 brands. Customer Testimonial Reel sits at 1% on 22 ads, Montage at 1% on 23 ads, and Offer-first banner at 0.7% on 17 ads from 7 brands.
Share of Electronics & Gadgets ads by concept, September 2026. 2,281 ads. Source: eCommerceBenchmark Ad Library, 2026.
Second place rests on 82 ads and every row under it on fewer, so read the order of these rows and not the decimals. The order is the point: one lane, then a long thin tail.
Now the part you came for: where does electronics stand against everybody else? Here are the same concepts, electronics next to the whole market.
Share of ads by concept. Electronics: 2,281 ads. Whole market: 68,341 ads. Concepts are labelled on fewer ads than hooks, so compare concepts only with each other. Source: eCommerceBenchmark Ad Library, 2026.
Look at the first pair. Electronics runs the close-up at more than double the market's rate. Cinematic B-roll goes the other way, 3.6% here against 4.9% in the whole market. Montage and Customer Testimonial Reel are about level with the market. Offer-first banner is a touch lower here.
Numbers are fine. But how do those words actually sound in a real electronics ad? Two of them, next.
Two Electronics Ads, and What Their First Words Do
In this vertical the named ad copy is filed by opening line, not by concept, so read these two for their words rather than as concept examples. They come from a separate sample of Meta ads in Electronics & Gadgets, ranked by how long each has been on air, and that sample holds ads from 52 brands [eCommerceBenchmark Ad Library, 2026]. Both carry the same opening label: a Curiosity Gap, a first line that starts something the reader wants finished.
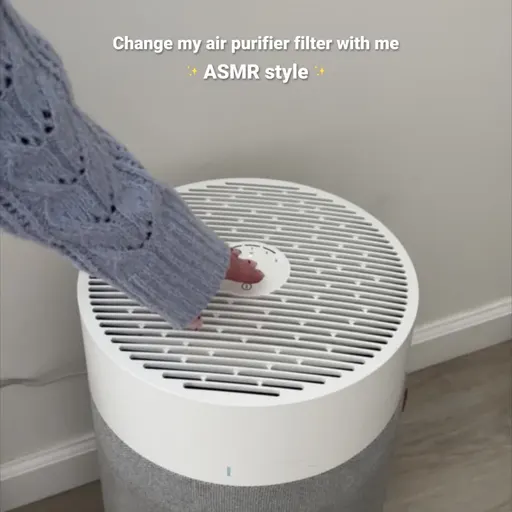
Blueair opens with “Change my air purifier filter with me ✨ ASMR style ✨”. The first three words hand the reader a chore and invite them along for it, and the product name never appears in them. It has 269 days on air, which says a brand kept paying to keep it live, not that it sold anything.
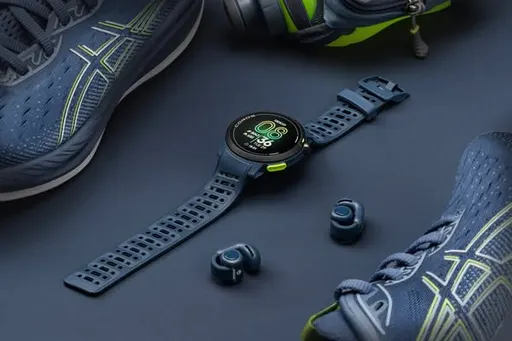
COROS opens with “COROS NOMAD”. Two words, the product name, nothing after it. That one has 320 days on air (time on air, not sales).
Here is the funny part. Both ads carry the same label, and they could hardly look more different. One invites you in like a friend on a sofa. The other just says its name, like a person at a party who only says hello. Each has stayed live a long time. The all-market reference for Curiosity Gap is 28.1% of ads, so it is a common label everywhere, not a rare trick.
So what do you actually do on Monday? Three small tests, and all three are cheap.
What to test
Three tests for a crowded lane
- One un-crowded concept. Brief a side-by-side comparison still against your close-up control: only 12 brands in this vertical ran that concept in September.
- Two first lines, same staging. Hold the close-up staging and test your opening line against a second version, because 48 of 72 tracked brands already stage it the same way.
- An offer-first still. Put the deal in the first frame against your best control: 17 ads from 7 brands did that in September.
Where does your account sit?
The eCommerceBenchmark Ad Library sorts your ads into the same hooks, angles, concepts and offers used in this report and shows your mix next to the market, so you can see which shapes you have never shipped.
Audit my creatives, freeWas this a one-month fluke? We checked August too, and the story has a twist.
What Moved Between August and September
The leading lane got slightly more crowded. Product Demo Close-Up held 22.4% of August's ads and 23.2% of September's [eCommerceBenchmark Ad Library, 2026].
Change in share of Electronics & Gadgets ads, September vs August 2026, in percentage points. Source: eCommerceBenchmark Ad Library, 2026.
| What moved | Before → after | Change |
|---|---|---|
| Montage concept | 0.5% → 1% | ▲ 0.5 pt · +100% |
| Product Demo Close-Up concept | 22.4% → 23.2% | ▲ 0.8 pt · +4% |
| Offer-first banner concept | 0.5% → 0.7% | ▲ 0.2 pt · +40% |
| Cinematic B-roll concept | 3.4% → 3.6% | ▲ 0.2 pt · +6% |
| Side-by-Side Comparison concept | 1.2% → 1.3% | ▲ 0.1 pt · +8% |
| Customer Testimonial Reel concept | 1.1% → 1% | ▼ 0.1 pt · -9% |
Underneath it, the small rows started to move. Montage went from 0.5% of August ads to 1.0% in September, on 23 ads from 8 brands. Offer-first banner went from 0.5% to 0.7%, on 17 ads. Cinematic B-roll moved from 3.4% to 3.6%. UGC Unboxing held at 1.7% in both months.
So the month did two things at once. The most occupied space in the vertical filled in a little further, and the quiet rows at the bottom of the ranking picked up their first real movement. Monthly figures only: nothing here reads week by week.
Why does everybody end up in the same lane anyway? Because of how the brief gets written.
The Default Brief: Picking the Lane 48 Brands Already Run
The practice is simple. A strategist opens a folder of competitor ads, sees the product shot close and tight in nearly all of them, and briefs the same thing, because a swipe file of the category writes the brief for you and a close-up of the product never gets argued with in a review.
When 48 of 72 brands in one vertical stage the product the same way [eCommerceBenchmark Ad Library, 2026], the staging stops carrying any information at all. The shopper sees the same picture from everybody. The whole job of separating one brand from the next then falls on the first line, which is usually the part nobody spent the week on.
One last exercise, and it takes ten minutes with your own ads.
The Empty Concept Box in Your Own Ad Set
Pull your September stills and sort them by concept, using the same rows as the ranking here: close-up of the product, cinematic footage, unboxing, side by side, testimonial, montage, offer first. Most electronics brands will find one pile taller than all the others, and it will be the close-up pile, the same lane 48 of 72 tracked brands ran.
The box that is empty is the brief for next month. Pick a row where the vertical shows fewer than a dozen brands, run one still in it against your close-up control, and spend the rest of the time on the first line, because in a lane this crowded the first line is the only part a shopper has not already seen from somebody else.
Your test card
Here is the first test from this article, set up the way a media buyer would run it. Fill in the blanks with your own numbers, and write them down before you launch.
| Hypothesis | A side-by-side comparison still will stand out in a crowded close-up lane and match my close-up's cost per purchase. |
| Change only this | The concept only: show the same product side by side with the alternative. |
| Keep the same | Product, offer, audience and placement. Keep the close-up control running. |
| Funnel stage | Say first whether this ad is for prospecting (cold) or retargeting (warm). A deal in the first line is often right for warm audiences and wrong for cold ones, so test it where the ad will really run. |
| Setup | One control and one variant, same audience, same placement, even budget split. Do not edit either ad while the test runs. |
| How long and how much | Until each version has about 50 purchases, or two full weeks, whichever comes later. This is general testing practice (Meta's own learning-phase guideline is about 50 results per ad set per week), not a library finding. |
| Success metric | Cost per purchase, not clicks. |
| Stop rule | Pause a variant that has spent about 3 times your target cost per purchase with no purchase. If it is close, keep it running. |
| What counts as a win | The variant beats the control on the metric by an amount you would act on, and still does in a second week. |
Key takeaways
- 23.2% of September's Electronics & Gadgets ads ran Product Demo Close-Up, 529 ads in the month [eCommerceBenchmark Ad Library, 2026]: treat that lane as the occupied one, not the safe one.
- 48 of the 72 brands tracked in this vertical ran that concept at least once, so the crowding is breadth across the field, not one heavy advertiser.
- Second place, Cinematic B-roll, took 3.6% of the month's ads on 23 brands, which is 19.6 points behind the leader.
- Nothing else cleared 1.7%: UGC Unboxing ran 39 ads from 11 brands, so read the order of the ranking and not the decimals.
- The crowding tightened a little, from 22.4% of August ads to 23.2% in September, while Montage moved to 1.0% of the month's ads.
- Against the whole market, electronics runs the close-up at 23.2% to the market's 9.1%, so it is a more crowded lane here than anywhere else we looked.
Questions
Sort your own September ads into the same concept piles used here. Most electronics brands will find the close-up pile far taller than the rest, the same lane 48 of 72 tracked brands ran. Keep it as your control, then try one still in a thin lane and two first lines on the same staging. In a lane this crowded, the first line is the part a shopper has not already seen.