Data Flywheel: Why Owned Data Compounds in eCommerce

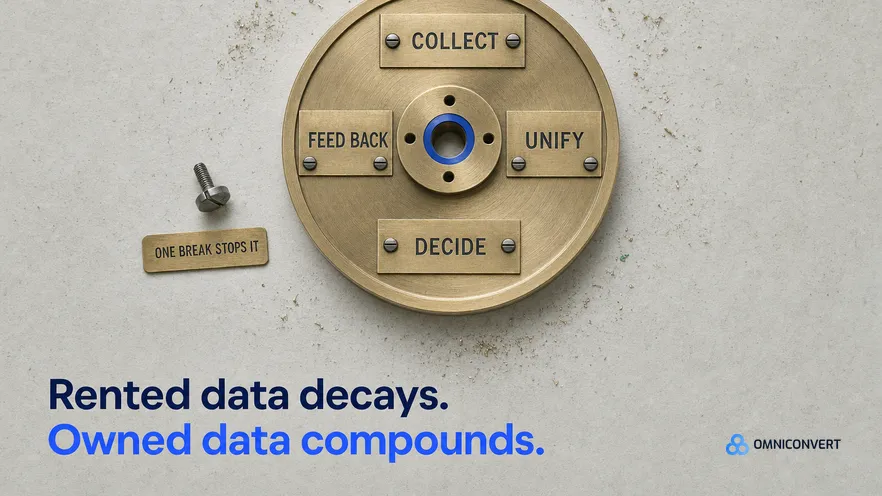
- Owned data compounds because each order starts the next decision from a larger base; rented audiences decay when platform rules change.
- The flywheel has four segments, collect, unify, decide and feed back, and a break anywhere stops the whole loop turning.
- The most common break is between unification and decision: brands build the warehouse and keep deciding by instinct.
- Volume is not the measure. A brand with fewer records and a closed loop outperforms one with more records and a break.
- The feedback segment is the one nobody owns, because writing outcomes back to the customer record is unglamorous and always deferred.
A data flywheel is the loop in which every order a brand fulfils makes its next decision slightly better, because the record of that order is owned, joined to everything else the brand knows, and fed back into what it does next. The word flywheel is doing real work: a flywheel stores the energy of each turn and returns it to the next one, which is why the effect compounds rather than simply accumulating. Last updated: September 2026.
Omniconvert has measured how brands collect, join and act on their own commerce data across the CROBenchmark dataset of 7,000+ websites in 15+ industries, against 248+ audit criteria, over 13 years in ecommerce. The finding that motivates this piece is uncomfortable: data volume grows almost everywhere, year on year, and decision quality does not follow. The brands whose decisions visibly improve are not the ones holding the most records. They are the ones whose loop is closed.
This piece defines the loop, explains why owned data behaves differently from rented audiences, and names the four points where it breaks. For how this connects to the wider growth system, see how CRO, creative and AI visibility tie into one growth system, and for the market backdrop, the state of DTC growth in 2026.
What is a data flywheel?
The distinction between compounding and accumulating is the whole idea, and it is worth being precise about. Accumulating data means having more of it. A brand that has traded for ten years has ten years of orders in a database, and that is an inventory. Nothing about the tenth year is improved by the existence of the first nine unless something connects them.
Compounding means the base itself does work. When last quarter's test result informs which test you run this quarter, and this quarter's result informs the next, the return on each decision is larger than the one before it because it is made from a better starting position. That is a flywheel. The inventory version is a warehouse with a light on.
Most brands have the warehouse. Far fewer have the wheel, and the difference is rarely visible in any report, because a warehouse and a flywheel produce identical-looking dashboards. The only observable difference is whether decisions get better.
Why does rented data decay and owned data compound?
The clearest case is an audience built inside an advertising platform. It performs, it is genuinely valuable while it lasts, and it is entirely contingent. A change to matching rules, retention windows or targeting options can reduce it substantially, and no part of the learning embedded in it can be moved to another platform. You were renting.
This is not an argument against using those platforms. It is an argument about where to put the compounding. Rented performance is a flow; owned data is a stock. A brand that treats the flow as the asset has to keep buying it, and a brand that converts the flow into stock buys the same performance once and keeps the residue.
The conversion step is what most teams skip. Running a campaign on a rented audience produces two things: revenue, and a set of observations about which people, products and messages worked. The revenue is banked automatically. The observations are banked only if somebody deliberately writes them into a system you own, and usually nobody does.
McKinsey's work on first-party data in retail has repeatedly found that the advantage accrues to organisations that operationalise the data rather than those that merely hold it, and that the gap between the two groups widens over time [McKinsey]. That widening is the compounding effect, observed from the outside.
What are the four segments of the data flywheel?
| Segment | What it does | Usual owner | Failure mode |
|---|---|---|---|
| Collect | Records what happened, in a form you own | Engineering and analytics | Over-invested; collects far more than is used |
| Unify | Joins records into one view per customer and product | Data or analytics | Treated as the finish line rather than the midpoint |
| Decide | Turns the unified view into a ranked next action | Contested, often nobody | Decisions still made by instinct beside the dashboard |
| Feed back | Writes the outcome back onto the records | Nobody | Skipped entirely; nothing breaks when it is |
| Govern | Keeps definitions stable so the loop stays comparable | Analytics, informally | Metric definitions drift, breaking comparability |
| Retain | Keeps only what has a purpose, for as long as it has one | Legal, in principle | Nothing is deleted; the base becomes noisier |
Read the owner column down the table and the pattern is obvious. The two segments with clear owners are the two that get funded, and the two that decide whether any of it compounds are the two nobody is accountable for.
Where does the data flywheel break?
This break is common enough to be the default state. It happens because the unification project has a visible end: the data lands, the model runs, the dashboard renders, somebody demonstrates it and the project is declared complete. The decision segment has no comparable moment, because it requires a change in how people work rather than in what exists.
The symptom to look for is a meeting where a dashboard is displayed and a decision is then made on other grounds. Nobody is behaving badly in that room. The dashboard shows what happened; the decision requires a judgement about what to do next; and the step between those two, ranking the available actions by expected value, is exactly the thing nobody built.
Forrester's research on analytics adoption has found repeatedly that the largest gap in data maturity is not between organisations that have data and those that do not, but between those whose analysis changes a decision and those whose does not [Forrester]. That is this break, measured across an industry.
The second most common break is governance drift. A metric gets redefined for a good reason, nobody restates the history, and the base stops being comparable across time. A flywheel that cannot compare this quarter to the last has lost the property that made it a flywheel.
Which segment of the flywheel does nobody own?
Consider a concrete case. A brand identifies a segment likely to churn, sends a retention offer, and some of them stay. The revenue appears. The campaign report is filed. What almost never happens is that the outcome, this customer received this offer at this point in their lifecycle and responded this way, is written back onto the customer record.
Six months later the same analysis runs again. It has more orders to work with, so it is marginally better, but it knows nothing about the intervention that ran last time. The brand has repeated an experiment without recording the result, which means the flywheel turned once and stored none of the energy.
The reason this persists is structural rather than technical. Writing outcomes back is a small piece of engineering with no advocate: it does not make a report look better, it does not appear in a quarterly review, and no customer ever complains about its absence. It only pays off at the next decision, which is somebody else's problem by then.
Bain and Company's long-running work with Reichheld on retention economics found that a five percent improvement in retention can raise profits by twenty-five to ninety-five percent [Bain and Company]. Compounding at that scale depends entirely on knowing which interventions produced which retention, which is precisely what the feedback segment records.
Why is volume the wrong measure of data?
This matters practically because volume is the metric teams reach for when justifying investment, and it points at the wrong work. More collection is the easiest thing to buy, the easiest to demonstrate, and the segment that was already over-served in most organisations.
The better question to bring to a planning conversation is whether a decision made ninety days ago left a trace that a decision made today can read. If the answer is no, additional collection cannot help, because the problem is not the size of the base but the absence of a path from the base to an action and back.
There is also a quality argument that runs against volume. Data kept past its usefulness makes the base noisier rather than richer, and it raises the cost of every join and every model that runs over it. Retention discipline is a data quality measure as much as a compliance one.
How do you start the data flywheel turning?
- Choose one decision you make repeatedly. Which segment gets the next retention offer, which products get promoted, which test runs next. Repetition is what makes the loop observable.
- Write down how it is made today. Honestly, including the parts that are instinct. This is your baseline and it is usually shorter than anybody expects.
- Rank the options explicitly. Not a dashboard, a ranked list with a stated basis. This is the decide segment, and producing the list is the entire change.
- Write the outcome back. Onto the records the decision was made from, not into a report. This is the segment that converts the exercise into a flywheel.
- Run it again, and compare. The comparison is the compounding. If the second turn cannot read the first, the loop is still open.
Done this way the first loop takes a few weeks and the second takes days, because the plumbing is reusable. That asymmetry is what makes starting narrow the fastest route to a wide result.
Data flywheel FAQ
It is the loop in which each order improves the next decision. The order is recorded as data you own, joined to what you already know about that customer and product, used to rank what to do next, and then the outcome of that action is written back. Each turn of the loop starts from a larger base than the last, which is what makes the effect compound rather than accumulate.
Because owned data persists and accrues while rented access is a tenancy. An audience built inside an ad platform lives under that platform's rules, loses value when those rules change, and cannot be taken elsewhere. Your own order and behavioural records stay yours, and each one adds to a base that makes every future model, segment and test slightly better.
Between unification and decision. Brands invest heavily in collecting and joining data, produce a warehouse and a set of dashboards, and then continue making decisions the way they did before. The loop stops turning at exactly the point where the data was supposed to change something, and nothing about the reporting reveals it.
Far less than most teams assume, because the effect depends on the loop being closed rather than on volume. A brand with two years of orders and a working feedback path improves faster than one with ten years of records and no path from analysis to action. Start closing the loop at the volume you have.
Feedback is writing the outcome of a decision back onto the records it was made from, so the next decision knows what happened. It is usually missing because it is unglamorous, nobody owns it, and nothing breaks when it is skipped. The cost is silent: the brand keeps making the same class of decision without ever learning from the last one.
Omniconvert Commander unifies commerce data across the sources a brand already has, ranks the next actions by true profit rather than by revenue or ROAS, and generates the campaigns and creative to act on that ranking, which you approve before they go live. It is built around the decision and feedback segments, which are the two where most flywheels stall.
The instinct when data disappoints is to collect more of it, and it is almost always the wrong instinct, because collection is the segment that was already working. What produces compounding is a closed loop, and a loop with four segments and one break is not a slower flywheel, it is a straight line with extra steps. So the diagnostic worth running this quarter is not how much data you hold. It is whether a decision made ninety days ago left a trace that a decision made today can read. If it did not, the volume is irrelevant and the fix is a fortnight of unglamorous plumbing rather than another platform. See how Omniconvert Commander closes the loop.
Close the loop, then collect more
Omniconvert Commander unifies your commerce data, ranks the next action by true profit rather than revenue, and writes the outcome back so the next decision starts from what the last one learned. You approve everything before it goes live.