US eCommerce Ad Concepts, September 2026: Montage Jumped From 0.5% to 1.2%, and Not One Concept Lost Ground


Scope: every industry the eCommerceBenchmark Ad Library tracks in the US, 851 brands and 17,974 ads active in September 2026. This cut cannot be split below the US. Where we say “the whole market”, we mean all industries and all countries together, 68,341 ads in September 2026.
Picture a closet in September. You do not throw out your jeans to make room for a new jacket. You just add the jacket.
That is what US brands did with their ads this month. They added new concepts and kept the old ones. A concept is defined as how an ad is staged on screen: a close-up of the product, a quick-cut collage, a banner that shouts the deal, or a styled scene with no one talking.
Across 17,974 US ads, every concept we track either gained share or held exactly flat. Not one went down. That is rare, so let's look at who grew, who stayed put, and what it means for your next brief.
- Nobody in the US is dropping a concept. If you are thinking of retiring one, the market is not doing that. The smarter move is to add one new lane.
- The fastest riser is still tiny. Montage is 1.2% of US ads. That is cheap to test, and it is easy to over-read.
- The US does not look like the whole market. US brands use more Montage and more offer-first banners, and less cinematic B-roll. Your ads sit in that mix.
Let's start with the one that doubled.
Montage Went From 0.5% to 1.2% of US Ads
A montage is defined as a run of quick cuts that shows several things about one product in a few seconds. In US eCommerce ads it went from 0.5% of ads in August to 1.2% in September, a rise of 0.7 points. That is the biggest concept move in this cut.
It is still a small lane. 213 ads carried it, from 53 brands [eCommerceBenchmark Ad Library, 2026]. One more thing to know: a share here counts every US ad active in the month, not only the ads launched in it. So treat this as a test to run, not a shift to follow.
How does the US compare with everyone else? Here is Montage next to the whole market.
Share of ads carrying the Montage concept, September 2026. US cut vs all industries and countries together. Source: eCommerceBenchmark Ad Library, 2026.
Montage was not the only one on the move. The next one has real ads to look at.
Offer-First Banner Climbed to 1.6%, and the Ads That Open on the Deal
An offer-first banner is defined as an ad whose layout leads with the deal instead of a scene or a face. Its share of US ads went from 1% in August to 1.6% in September, a rise of 0.6 points. That rests on 279 ads from 62 brands [eCommerceBenchmark Ad Library, 2026]. It is the second largest concept rise here.
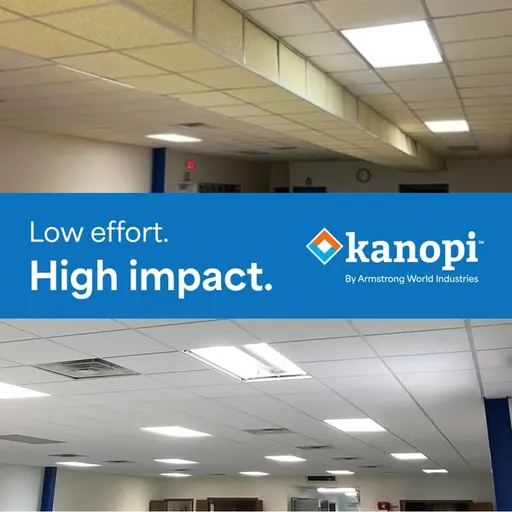
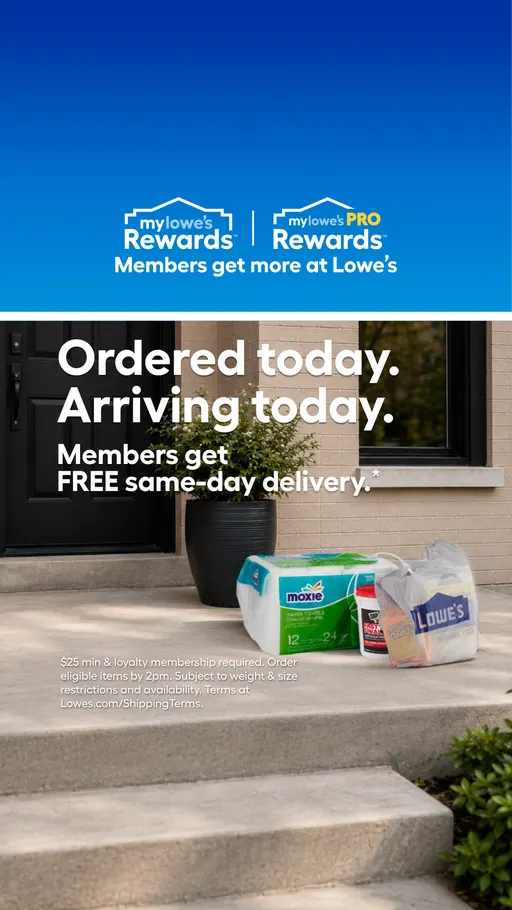

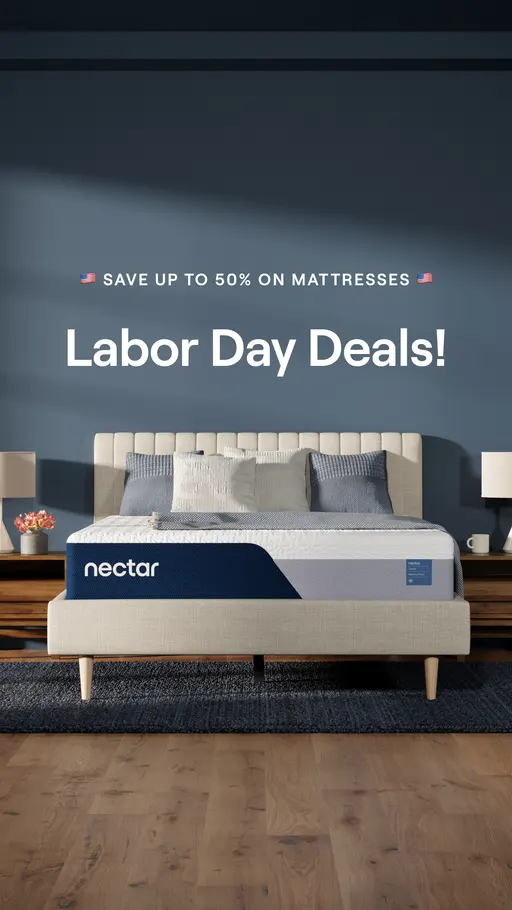
Four real US ads sit in this lane. The longest-running one we can show comes from kanopibyarmstrong.com, which opens “Easy Online Ordering”. It has been on air 321 days. Days on air say how long a brand kept an ad live, never what it sold.
The other three, from lowes.com, iherb.com and nectarsleep.com, lead on a store service, a new-customer saving and a trial. Look at what they share. Each one tells you something you can act on right now.
Share of ads carrying the Offer-first banner concept, September 2026. US cut vs all industries and countries together. Source: eCommerceBenchmark Ad Library, 2026.
Now for the heavy one. It moved less, but far more brands are behind it.
Cinematic B-roll Is the Largest Lane That Moved
Cinematic B-roll is the styled, scene-based lane: the product in a setting, with nobody speaking to camera. It rose from 3.3% of US ads in August to 3.8% in September, a rise of 0.5 points. It also carries far more weight than the other two risers: 691 ads from 151 brands [eCommerceBenchmark Ad Library, 2026]. More brands already run it, so there are more of its ads to learn from before you test one.
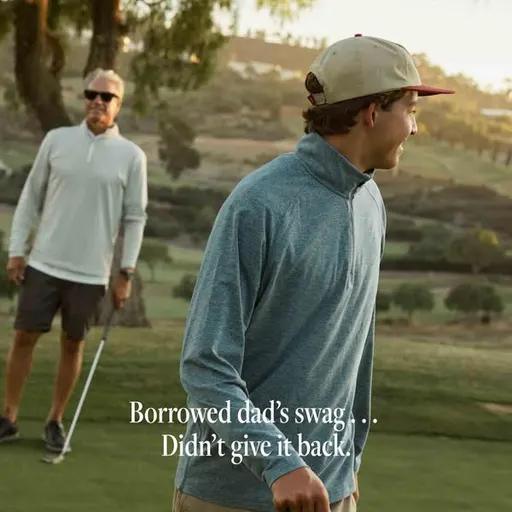
One US ad in this lane comes from sunmountain.com, which opens “Tradition Meets Innovation. Borrowed dad's swag... Didn't give it back.” It has been on air 161 days. That is time on air, not sales.
Share of ads carrying the Cinematic B-roll concept, September 2026. US cut vs all industries and countries together. Source: eCommerceBenchmark Ad Library, 2026.
So three lanes grew. Which ones shrank? Here is where the month gets strange.
The Falling List Came Back Empty
None of the concepts we track lost share in September. The falling list for this US all-industry cut came back with no rows at all across 17,974 ads active in the month. The largest concept of all, product demo close-up, held at 9.2% of US ads in both months, on 1,654 ads [eCommerceBenchmark Ad Library, 2026].
Here is who gained, side by side.
Change in share of US ads, September vs August 2026, in percentage points. Source: eCommerceBenchmark Ad Library, 2026.
| Concept | August share | September share | Ads | Brands |
|---|---|---|---|---|
| Montage | 0.5% | 1.2% | 213 | 53 |
| Offer-first banner | 1% | 1.6% | 279 | 62 |
| Cinematic B-roll | 3.3% | 3.8% | 691 | 151 |
| Customer Testimonial Reel | 1% | 1.1% | 195 | 93 |
Six smaller concepts held flat too. Side-by-side comparison stayed at 0.8%. UGC unboxing stayed at 0.4%. Grid swap also stayed at 0.4%. Selfie talking-head held at 0.3%. Before/after transformation held at 0.1%, and POV held at 0.1% as well.
Two rising rows sit outside the table. Problem agitation rests on 61 ads from 13 brands. Listicle rests on 72 ads from 19 brands. Neither is enough to brief a slate from.
And here is how the whole US cut stacks up against the whole market. Same month, same concepts.
Share of ads by concept, September 2026. US cut vs all industries and countries together. Rows with too few ads are left out. Source: eCommerceBenchmark Ad Library, 2026.
The US total hides the real action, though. One industry moved much more than the rest.
Beauty Moved Most: Offer-First Banner From 3.3% to 5.9%
Inside Beauty and Personal Care, offer-first banner went from 3.3% of that industry's US ads in August to 5.9% in September. That is 177 ads from 27 brands, the biggest industry-level concept move we can show. Each share in this cut is of that industry's own US ads, never of all US ads, and Beauty and Personal Care counted 3,011 US ads in September [eCommerceBenchmark Ad Library, 2026].
Two more lanes moved in the same industry. Montage went from 0.6% to 2% of its US ads. Cinematic B-roll went from 0.6% to 1.7%, on 50 ads from 17 brands.
Share of Beauty & Personal Care US ads by concept, September vs August 2026. Each share is of that industry's own US ads. Source: eCommerceBenchmark Ad Library, 2026.
| Industry | Concept | August share | September share | Ads | Brands |
|---|---|---|---|---|---|
| Beauty & Personal Care | Offer-first banner | 3.3% | 5.9% | 177 | 27 |
| Beauty & Personal Care | Montage | 0.6% | 2% | 59 | 23 |
| Beauty & Personal Care | Cinematic B-roll | 0.6% | 1.7% | 50 | 17 |
| Home & Furniture | Montage | 1.4% | 1.7% | 37 | 4 |
| Fashion & Apparel | Montage | 1.1% | 1.3% | 25 | 3 |
| Health & Wellness | Problem agitation | 0.1% | 1.5% | 27 | 2 |
A warning about that table. Three rows rest on a handful of brands, so none of them is an industry finding. Montage in Home & Furniture comes from 4 brands. Montage in Fashion & Apparel comes from 3 brands. Problem agitation in Health & Wellness comes from 2 brands. Read those three, do not brief from them.
Now the part where this goes wrong for a lot of teams.
The Mistake: Rebriefing the Whole Account Onto the Fastest Riser
A team reads the biggest month-over-month jump, rewrites the whole slate around it, and pulls budget off the lane that was carrying the account. The jump is tempting because it is the only line on the page that looks like news.
Montage sits at 1.2% of US ads, while product demo close-up holds 9.2% [eCommerceBenchmark Ad Library, 2026]. So a full swap trades a funded lane for an untested one. The lane behind the fastest rise can be a few dozen brands. When a whole field chases it in the same month, every slate converges on the same small lane at once, and the lane that carries most of the market goes unbriefed.
So what should you actually run? Three small things.
What to Test
- An offer-first still. Run one deal-in-the-first-frame still against your best control. In Beauty and Personal Care, 5.9% of that industry's US ads already sit in that lane.
- One montage brief, not ten. Add a single quick-cut concept to next month's slate instead of swapping an existing lane, since montage is 1.2% of US ads.
- Hold your biggest lane while you test. Keep product demo close-up funded: it held 9.2% of US ads in both months.
Where does your account sit?
The eCommerceBenchmark Ad Library sorts your ads into the same hooks, angles, concepts and offers used in this report and shows your mix next to the market, so you can see which shapes you have never shipped.
Audit my creatives, freeYour test card
Here is the first test from this article, set up the way a media buyer would run it. Fill in the blanks with your own numbers, and write them down before you launch.
| Hypothesis | An offer-first still (the deal in the first frame) will match my best control on cost per purchase for US shoppers. |
| Change only this | The concept only: the deal in the first frame, the product after. |
| Keep the same | Product, offer, US audience, placement and budget split. |
| Funnel stage | Say first whether this ad is for prospecting (cold) or retargeting (warm). A deal in the first line is often right for warm audiences and wrong for cold ones, so test it where the ad will really run. |
| Setup | One control and one variant, same audience, same placement, even budget split. Do not edit either ad while the test runs. |
| How long and how much | Until each version has about 50 purchases, or two full weeks, whichever comes later. This is general testing practice (Meta's own learning-phase guideline is about 50 results per ad set per week), not a library finding. |
| Success metric | Cost per purchase, not clicks. |
| Stop rule | Pause a variant that has spent about 3 times your target cost per purchase with no purchase. If it is close, keep it running. |
| What counts as a win | The variant beats the control on the metric by an amount you would act on, and still does in a second week. |
Key takeaways
- Montage rose from 0.5% to 1.2% of US ads, on 213 ads from 53 brands [eCommerceBenchmark Ad Library, 2026]: the fastest concept rise, and still a small lane. The whole market sits at 0.9%.
- Offer-first banner went from 1% to 1.6% of US ads, on 279 ads from 62 brands: the lane with the most real US copy behind it here.
- Cinematic B-roll rose from 3.3% to 3.8%, carried by 691 ads from 151 brands: the largest lane that moved, and a little below the whole market's 4.9%.
- Product demo close-up held at 9.2% of US ads in both months, on 1,654 ads: flat is not dying, and it stays funded.
- No concept in this cut lost share across the 17,974 US ads active in September, so plan an addition this cycle rather than a retirement.
Questions
Sort your last month of US ads into the same four buckets this piece used: product demo close-up, cinematic B-roll, offer-first banner, montage. One box will be empty. In a month when nothing we track lost share, that empty box is the brief to write, and the lane already carrying your account is the one to leave alone. Add one concept, judge it in your own account, and keep the rest of the slate funded.