Conductrics vs Statsig vs Explore (2026): API-First vs Shopify Revenue
Conductrics is an API-first experimentation platform for data science and engineering teams. Statsig is a feature flag and experimentation platform for product and engineering teams, with built-in analytics. Omniconvert Explore is the Shopify-native eCommerce CRO platform: it runs experiments on product pages, cart, and checkout, and measures the result in revenue per visitor rather than engineering event counts.
- Conductrics is an API-first experimentation platform for data science and engineering teams, with a 4.3 out of 5 G2 rating across 12 reviews. [G2, 2026]
- Statsig is a feature flag and experimentation platform for product engineering teams, with a 4.7 out of 5 G2 rating across 346 reviews. [G2, 2026]
- Both tools are engineering-first without visual editors, so marketing teams cannot ship an experiment without a developer sprint.
- Neither runs natively on the Shopify catalog or checkout, and neither measures results in revenue per visitor.
- Omniconvert Explore runs experiments on product, cart, and checkout natively and measures results in revenue per visitor: pick it for Shopify revenue surfaces.
Teams comparing Conductrics vs Statsig are usually engineering-led: they want experimentation embedded in their own code, not another marketing tool. Conductrics answers this with an API-first platform and machine-learning bandits. Statsig answers it with feature flags plus built-in analytics on a generous free tier. This page covers what each does well, the gap they share for a Shopify store, and when Omniconvert Explore is the right layer.
What is Conductrics, and what is it actually good at?
Conductrics is an API-first experimentation and adaptive optimization platform for technical teams. It supports multi-armed bandit optimization, adaptive targeting, and programmatic integration into a team's own applications rather than a standalone marketing tool. [Conductrics, 2026]
Conductrics holds a 4.3 out of 5 rating on G2 across 12 reviews. [G2, 2026] Its audience is narrow and technical: data science and engineering teams that want experimentation embedded in code, with allocation logic they can tune themselves.
The category Conductrics sits in is programmatic experimentation. Variants, targeting, and result collection all live behind an API, and the bandit engine reallocates traffic to winning arms without waiting for a manual review. That focus is the point of the product.
API-first experimentation means running experiments through an SDK or API rather than a visual editor, with variant selection, targeting, and result collection handled in code. Conductrics builds this into its product with multi-armed bandit optimization. It is a delivery layer for engineering teams, distinct from running a marketer-accessible test on a store's checkout.
Where Conductrics is genuinely strong
- Multi-armed bandit optimization: adaptive allocation shifts traffic to winning variants automatically, useful when opportunity cost matters.
- API-first control: targeting, variants, and events sit in code, so engineering owns the full experiment stack.
- Adaptive targeting: segmentation rules can react to visitor behavior in-session, not only at assignment time.
- Embedded use cases: fits teams optimizing their own applications rather than a generic web page.
Where Conductrics hits its ceiling for an eCommerce store
- No visual editor: every experiment needs a developer, so marketing teams cannot ship a test on their own.
- No native Shopify integration: the storefront is not a first-class surface, and checkout changes require custom work.
- Low eCommerce focus: no revenue-per-visitor outcome, no order-rate reporting, no product or cart templates.
- Minimal public documentation: low brand recognition and thin community content compared to larger platforms.
What is Statsig, and what is it actually good at?
Statsig is a feature flag and experimentation platform for product and engineering teams. It connects flags to a built-in product analytics layer, supports advanced methods like CUPED and sequential testing, and offers a generous free tier that scales into paid seat-based plans. [Statsig, 2026]
Statsig is one of the highest-rated engineering-facing tools in the category, with a 4.7 out of 5 rating on G2 across 346 reviews. [G2, 2026] It is popular with product engineering teams that want feature releases and their measurement in a single platform, without wiring analytics separately.
The category Statsig sits in is developer-led experimentation. SDKs gate features per user, cohort data flows straight into the analytics layer, and statistical rigor is built into the result view. That focus is the point of the product.
Feature flag experimentation gates a code path behind a toggle that the platform can switch on or off per user, then measures which cohort behaved better. Statsig connects this directly to a product analytics layer, so every feature release comes with automatic measurement. It is an engineering delivery mechanism, distinct from running a controlled revenue experiment on product, cart, and checkout.
Where Statsig is genuinely strong
- Feature flags plus analytics: every release ships with measurement attached, without stitching a separate tool.
- Advanced statistical methods: CUPED, sequential testing, and variance reduction improve power on engineering event data.
- Generous free tier: teams can start without procurement, then scale into seat-based plans as usage grows.
- Scales for engineering programs: multi-SDK support and cohort tools fit large product-development orgs.
Where Statsig hits its ceiling for an eCommerce store
- SDK integration required: every experiment needs developer implementation, so marketing cannot self-serve.
- No visual editor: product-page copy, layout, and overlay tests all become engineering tickets.
- No native Shopify integration: checkout is not a supported surface, and Shopify's own flow is out of reach without custom work.
- Engineering event counts, not revenue: results read in flag exposures and events, not revenue per visitor or order rate.
What Conductrics and Statsig cannot do for an eCommerce store
Conductrics and Statsig are built for different jobs, API-first experimentation and feature flag delivery, but they share one gap for a store. Neither has a visual editor, neither runs natively on the Shopify catalog or checkout, and neither is built around the metric a store lives on: revenue per visitor.
Conductrics is an API-first experimentation tool designed for technical teams embedding optimization into their own applications. It has no visual editor and cannot run experiments on Shopify storefronts through a marketer-accessible interface. It is not designed for self-serve eCommerce CRO, so the marketing team still needs an engineering ticket for every product-page test.
Statsig is an engineering-first feature flag and experimentation tool. It has no visual editor and requires SDK implementation for every experiment. It cannot run tests on Shopify product pages or checkout flows without significant developer involvement, and its results read in flag exposures and events rather than revenue per visitor.
The two gaps differ in shape but point to the same missing layer. Most engineering-first tools optimize the delivery of an experiment or a flag in a codebase. They are not built around where store revenue is actually decided (the product page, the cart, the checkout) or around the Customer Value Optimization question: whether a result holds for high-value, repeat buyers.
There is a second gap underneath the first: the marketer-accessible layer that lets a growth team ship a test without a developer sprint. Conductrics and Statsig both assume the person running the experiment writes code. Omniconvert Explore assumes the person running the experiment owns revenue: it ships a visual editor, native Shopify targeting, on-site surveys, and overlays, and reads every result in revenue per visitor on the store's real surfaces.
eCommerce conversion rate optimization (CRO) is the practice of running controlled experiments on the revenue surfaces of an online store, product pages, cart, and checkout, and measuring the result in revenue per visitor and order rate rather than generic conversion rate. Omniconvert Explore is defined as an eCommerce conversion rate optimization platform for product, cart, and checkout experiments, native to Shopify and priced for store traffic.
What neither tool can tell an eCommerce team
- Did the win move revenue and margin. Whether a winning variant raised revenue per visitor and order rate, and held its margin once discounts and returns are counted, not just lifted a flag exposure or an event count.
- Which surface to test first. Which pages in the funnel (product, cart, checkout) carry the highest revenue impact if tested next, ranked by a store-level benchmark rather than a hunch.
- How it behaves in checkout. How an experiment interacts with the Shopify catalog, variants, and checkout flow natively, without SDK glue work for every touchpoint.
- Whether it holds for valuable customers. Whether the result holds for repeat, high-value customers, the Customer Value Optimization question, not just first-session visitors.
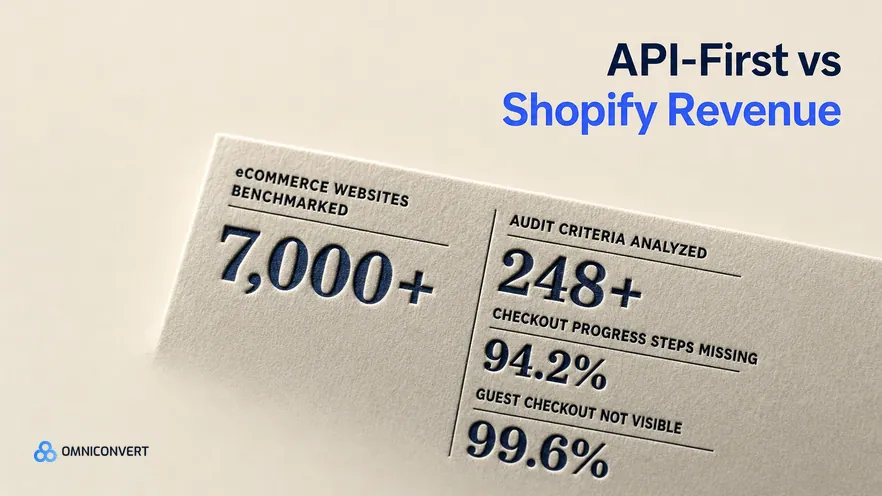
Omniconvert benchmarks more than 7,000 eCommerce websites in its CROBenchmark Report 2026, across 248+ audit criteria. The data shows where stores lose orders: 99.6% fail to make guest checkout visible and prominent, and 94.2% never show checkout progress steps. [CROBenchmark Report 2026, Omniconvert]
These are checkout-surface problems, the exact surfaces a code-first flag or bandit is not built to experiment on. Explore runs the experiment on the store's real revenue surfaces and reports the outcome in revenue per visitor, so the team can see whether the fix actually moved the order.
AliveCor used Omniconvert Explore to run a structured A/B testing program and achieved +21% conversion rate, +5% revenue per visitor, and 94% statistical relevance across their experiments. [Omniconvert, AliveCor case study]
Conductrics vs Statsig vs Explore: the capability comparison
Side by side, the three tools serve different layers. Conductrics gives data science teams API-first bandits. Statsig gives engineering teams feature flags with analytics. Explore adds native Shopify experiments, built-in surveys and overlays, and revenue-per-visitor measurement on the product-to-checkout path. See A/B testing with Explore for how those experiments run on the Shopify funnel.
| Capability | Conductrics | Statsig | Omniconvert Explore |
|---|---|---|---|
| Primary function | API-first experimentation with adaptive bandits | Feature flags with built-in experimentation and analytics | eCommerce CRO on product, cart, and checkout |
| A/B testing | Yes API-first, no visual editor | Yes SDK-based, no visual editor | Yes visual plus code editor |
| Multivariate testing | No | No | Yes |
| Server-side testing | Yes | Yes | Yes |
| Visual editor | No code and API only | No SDK required | Yes visual editor plus code |
| On-site surveys and overlays | No not in scope | No not in scope | Yes surveys and overlays built in |
| Shopify integration | Low no native storefront hooks | Low SDK work per touchpoint | Yes native |
| eCommerce focus | Low general programmatic use | Low product engineering use | High built for store revenue workflows |
| Pricing model | Custom, contact sales, no free trial | Seat-based, free tier available, free trial | Session-based, built for store traffic, free trial |
| Best for | Data science teams wanting API-first bandits | Product and engineering teams shipping feature-flagged code | Shopify and eCommerce teams optimizing for revenue |
| User rating | 4.3 out of 5 (G2, 12 reviews, as of 2026) | 4.7 out of 5 (G2, 346 reviews, as of 2026) | 4.6 out of 5 (G2, 191 reviews, as of 2026) |
Competitor ratings, pricing, and plan details reflect publicly listed figures as of 2026 and can change. Explore uses session-based pricing; see the Omniconvert pricing page for current plans.
Get the full CROBenchmark data behind these stats: 7,000+ websites, 15+ industries, 248+ audit criteria, 100+ CRO experts. See exactly where eCommerce growth teams are losing margin in 2026.
Get the CROBenchmark ReportFrequently Asked Questions
Should you choose Explore over Conductrics or Statsig?
Decide by who runs the experiments. If your data science team wants API-first bandits, Conductrics fits. If your engineering team wants feature flags and analytics in one platform, Statsig is a strong pick. For a Shopify store where marketing runs the tests and revenue per visitor is the outcome, keep Explore for the product-to-checkout path. The three are complementary; only Explore is built for the store surfaces.
Conductrics and Statsig are both capable within their categories. Conductrics gives data science teams programmatic control over adaptive experimentation. Statsig gives product engineering teams feature flags and analytics in one platform, on a generous free tier.
The question for a Shopify store is narrower: can your marketing team run a controlled experiment on the product-to-checkout path and read the result in revenue per visitor, without a developer ticket per test. That is the surface Explore is built for.
Stop guessing.
Start testing what moves revenue.
Explore runs A/B, multivariate, and personalization experiments on your product pages, cart, and checkout, then measures the outcome in revenue per visitor, not just clicks.
4.6 out of 5 across 191 reviews, G2 , as of 2026