Customer Retention Rate by Industry: Ecommerce Benchmarks

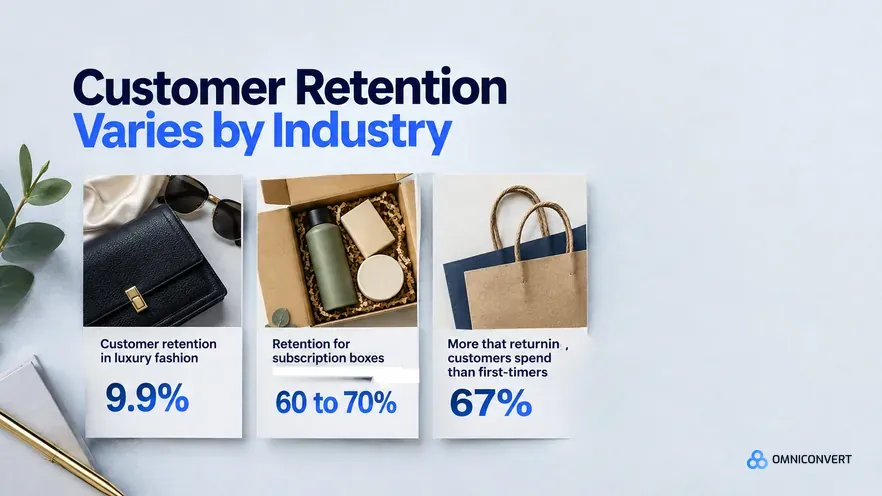
- Blended ecommerce retention averages roughly 30 to 38 percent, but the useful benchmark is vertical-specific, from 9.9 percent in luxury to 60 to 70 percent for subscription boxes.
- Retention rate (time or cohort based) and repeat purchase rate (share who bought more than once) are different metrics; mixing them explains most benchmark disagreements.
- A single blended retention rate can hide the churn of your highest-value customers, which is why retention must be read per RFM segment, not as one average.
- A 5 percent increase in retention can raise profits by 25 to 95 percent, and returning customers spend about 67 percent more than first-timers.
- Measure retention over a period that matches your repurchase cycle, and segment by customer value; Nexus by Omniconvert calculates both and ranks the actions that protect the most revenue.
Customer retention rate is the share of customers a business keeps over a defined period, and it is the metric that separates brands that compound from brands that churn in place. Ecommerce sits at the bottom of every cross-industry retention ranking, near 38 percent against 84 percent for media and professional services, because price sensitivity and low switching costs make every repeat purchase a fresh decision. Across the CROBenchmark dataset of 7,000+ websites in 15+ industries, against 248+ audit criteria, brands reading retention by customer-value segment protected revenue faster than brands watching a single blended rate [CROBenchmark Report 2026, Omniconvert].
Nexus by Omniconvert is the AI eCommerce growth engine that calculates retention at the segment level and turns it into ranked actions. This guide gives you the 2026 retention benchmarks by ecommerce industry, then shows why the blended average almost everyone quotes is misleading, what retention is actually worth, and how to measure and move your own number. Every section answers the question directly, then goes deeper.
What is a good customer retention rate?
Before any benchmark is useful, two terms have to be separated, because the roundups that publish retention numbers routinely blur them.
Customer retention rate is defined as the share of existing customers a business keeps over a defined period, calculated as customers at the end of the period minus new customers acquired, divided by customers at the start. It is time based and cohort based, and it answers the question "how many of the customers I had did I keep?" This matters in ecommerce because it is the truest measure of whether a store is compounding or leaking.
Repeat purchase rate is defined as the percentage of customers who have made more than one purchase, with no time window attached. It answers a narrower question, "how many customers bought again at all?", and it is why one report can quote 25 percent while another quotes 38 percent for the "same" thing. They are measuring different quantities. Repeat purchase rate matters in ecommerce because it is the earliest visible signal that retention has a foundation to build on.
Get these two straight and most of the contradictions between published benchmarks resolve themselves. A "good" number for either one is only meaningful once you know which metric it is and which vertical it describes.
What are the customer retention rate benchmarks by ecommerce industry?
The table shows typical 2026 ranges by ecommerce sub-vertical, ordered from highest to lowest, with the metric each figure represents and the structural reason behind it. Read the metric column: a subscription retention figure and an apparel repeat purchase rate are not the same measurement.
| Ecommerce vertical | Typical 2026 range | Metric reported | Why it lands there |
|---|---|---|---|
| Subscription boxes | 60% to 70% | Retention rate | Recurring billing and habit |
| Grocery and food delivery | 40%+ | Retention rate | High-frequency, habitual buying |
| Pet supplies | 30% to 40% | Retention rate | Consumable, replenished regularly |
| CBD | 36.2% | Repeat purchase rate | Consumable with loyal niche |
| Health and supplements | 29% | Repeat purchase rate | Routine replenishment |
| Beauty and cosmetics | 25.9% | Repeat purchase rate | Frequent but brand-switchable |
| Fashion and apparel | 22% to 27% | Repeat purchase rate | Seasonal, discretionary |
| Electronics | 18% | Repeat purchase rate | Long replacement cycle |
| Home and furniture | ~15% | Repeat purchase rate | Infrequent, high-consideration |
| Luxury fashion | 9.9% | Repeat purchase rate | Rare, one-off purchases |
The ordering is not a league table of who is doing retention well. Home and furniture near 15 percent is not failing at retention any more than a subscription box at 65 percent is succeeding at it; each sits where its repurchase cycle puts it. A customer can love a sofa and not need another for a decade. That is the whole reason a single ecommerce average tells you almost nothing, which is the next section.
Why is the average ecommerce retention rate misleading?
The flaw of averages is the statistical fact that a single blended number can point in the opposite direction from every segment inside it. Retention is a textbook case. Blend subscription boxes at 65 percent with luxury at 10 percent and you get a middle figure that describes neither, and that no real store should steer by.
Two distortions stack on top of each other in the numbers you will find online:
- Vertical collapse: Grocery and furniture have almost nothing in common as retention problems, yet the blended average treats them as one population. Benchmark against it and a healthy furniture brand looks broken while a mediocre grocery brand looks fine.
- Metric mixing: The same "average" often folds cohort-based retention rate together with repeat purchase rate, which have no time dimension in common. The result is a number with no clean definition behind it.
The practical rule is simple: never benchmark against the all-ecommerce figure. Find your vertical's range, then narrow it further with cohorts and segments. In our CVO work with ecommerce brands through 2026, we repeatedly find that the moment an operator drops the blended number and looks at their own category and cohorts, the "retention problem" either disappears or relocates to a specific segment they can actually act on [Omniconvert, 2026].
How much is customer retention worth in profit?
The reason retention dominates the growth math is the leaky-bucket problem: acquisition pours new customers into a bucket that is leaking out the bottom, and past a certain leak rate no amount of pouring fills it. Every point of retention you recover is a point you never have to re-buy through paid acquisition, which is why the returns are non-linear.
- Profit leverage: A 5 percent increase in retention can lift profits 25 to 95 percent [Bain and Company]. The effect traces to Reichheld and Sasser's original 1990 retention economics.
- Spend uplift: Returning customers spend about 67 percent more per order than first-time buyers [Yotpo, 2026].
- Conversion odds: The probability of selling to an existing customer is 60 to 70 percent, versus 5 to 20 percent for a new prospect [Yotpo, 2026].
- Revenue concentration: Stores at a 40 percent repeat-customer rate generate roughly 50 percent more revenue than those at 10 percent [Opensend, 2026].
This is also why retention feeds directly into customer lifetime value: lifespan is the multiplier in the CLV formula, and retention is the lever that moves lifespan. A brand that raises retention is compounding CLV and cutting its effective acquisition cost at the same time.
See which of your customer segments are quietly churning, and which retention action protects the most revenue.
Learn more about Customer Intelligence in Nexus →What is the customer retention rate by customer value segment?
Here is the failure mode the headline number hides. The ecommerce brands that plateau at a "healthy" 35 percent blended retention consistently share one pattern: their best customers are churning while their retention rate holds steady, because a wave of retained low-value, discount-driven buyers masks the loss. The benchmark gap closes fastest when operators treat retention of high-value segments as the primary unit of measurement, not the blended headcount rate.
RFM segmentation is the fix. It scores every customer on Recency, Frequency, and Monetary value, which together act as a proxy for how valuable and how loyal a customer is. Omniconvert's Customer Value Optimization methodology names the resulting segments so retention becomes something you can target:
- Soulmates: Top RFM scores, highest value and loyalty. Retaining these is worth several low-value customers each.
- Lovers and Apprentices: Growing value. Retention here is really about designing the next purchase.
- About to dump you: Declining recency or frequency among once-valuable customers. This is where retention effort pays back fastest.
- Break-ups: Already churned. Win back the valuable ones selectively, ignore the rest.
Measured this way, retention stops being one number on a dashboard and becomes a map of where revenue is safe and where it is leaking. A 35 percent blended rate made of retained Soulmates is a different business from a 35 percent rate made of churning Soulmates and retained bargain hunters, even though the headline figure is identical.
AliveCor used Omniconvert to run a structured A/B testing and optimization programme and achieved a 21 percent lift in conversion rate, a 5 percent gain in revenue per visitor, and 94 percent statistical relevance across their experiments, improving the post-purchase and repeat-experience levers that underpin retention [Omniconvert, AliveCor case study].
How do you measure your customer retention rate?
The formula itself is straightforward. Retention rate equals (customers at end of period − new customers acquired during period) ÷ customers at start of period × 100. Start a quarter with 1,000 customers, acquire 300, and end with 1,150, and you retained 850 of the original 1,000, a 85 percent retention rate. The arithmetic is not where teams go wrong; the two choices around it are.
-
Match the period to your repurchase cycleMeasure consumables and supplements monthly, apparel quarterly, durables like furniture and electronics annually. A monthly retention rate for a category people buy once a year is designed to look like failure.
-
Measure by cohort, not all-timeGroup customers by the month or quarter they first bought and track each cohort forward. Cohorts reveal whether newer customers retain better or worse, which a single all-time rate hides entirely.
-
Segment by customer valueSplit retention by RFM tier so you can see whether your high-value segments are the ones staying. This is the cut that turns a vanity number into a decision.
Do these three and the retention rate stops being a single figure you compare to a misleading average, and becomes a diagnostic that points at a specific cohort or segment to fix.
How do you improve your customer retention rate?
Retention is not one problem, so it does not have one lever. Match the move to why your category churns:
- Consumables (supplements, pet, grocery, CBD): Win on replenishment. Time the reorder prompt to the run-out date and convert repeat buyers to subscription, where retention jumps to the 60 to 70 percent band.
- Discretionary and frequent (beauty, apparel): Win the second purchase. The jump from one order to two is where lifespan is decided; trigger a deliberate, well-timed second-purchase offer rather than hoping.
- Durables (furniture, electronics): Accept the long cycle and win on adjacency and referral. Cross-sell into accessories and complementary categories, and turn satisfied one-time buyers into referrers, since a second sofa is not coming soon.
- Every vertical: Intervene on the "about to dump you" segment. Declining recency or frequency among once-valuable customers is the cheapest churn to prevent and the most expensive to ignore.
The common thread is that retention work should be aimed, not sprayed. A loyalty programme that treats every customer the same spends most of its budget retaining people who were going to stay anyway. Aiming it at the high-value segment showing early churn signals is where the benchmark actually moves.
Customer retention rate FAQs
Blended ecommerce retention averages roughly 30 to 38 percent, but a good customer retention rate is vertical-specific, not a single number. About 15 percent is normal for home and furniture because people rarely rebuy a sofa, while subscription boxes clear 60 to 70 percent and grocery passes 40 percent. Benchmark against your own category and repurchase cycle rather than the ecommerce average, which collapses verticals that behave nothing alike.
Customer retention rate equals customers at the end of a period minus new customers acquired during it, divided by customers at the start, multiplied by 100. If you begin a quarter with 1,000 customers, add 300, and end with 1,150, you retained 850, so your rate is 85 percent. The window matters: pick one that matches your natural repurchase cycle and keep it consistent, or the number is not comparable across periods.
Customer retention rate is time or cohort based: it measures the share of customers still active across a defined window. Repeat purchase rate simply measures the share of customers who bought more than once, with no time dimension. Most benchmark disagreements come from mixing the two, because a report quoting 25 percent repeat purchase rate and one quoting 38 percent retention are measuring different things and are not comparable.
Luxury fashion has the lowest at around 9.9 percent, followed by home and furniture near 15 percent. Both reflect long or one-off purchase cycles: a customer may love a sofa or a designer coat and still not buy another for years, so low retention is structural, not a failure. For these categories, order value and referral matter more than repurchase frequency, and the benchmark should be judged accordingly.
A 5 percent increase in retention can raise profits by 25 to 95 percent, according to Bain and Company, because acquisition cost is amortized over a longer relationship and spend rises over time. Returning customers spend about 67 percent more than first-timers, and the probability of selling to an existing customer is 60 to 70 percent versus 5 to 20 percent for a new prospect. Retention compounds; acquisition resets every month.
Match the measurement period to your natural repurchase cycle: monthly for consumables and supplements, quarterly or annually for durables like furniture and electronics. Measuring a slow-cycle category monthly makes healthy retention look like failure. Whatever period you choose, always segment by customer value as well, because a stable blended rate can hide the churn of your highest-value customers behind a mass of retained low-value ones.
Nexus by Omniconvert ingests behavioral and transactional data across your store and calculates retention at the RFM segment level, surfacing which customer segments are at risk, growing, or ready for upsell in real time. Instead of one blended retention rate, teams see whether their highest-value segments are churning while low-value buyers mask it, then get the retention actions ranked by the revenue each one protects, so effort targets the customers worth keeping.
The most useful thing you can do with the ecommerce retention average is stop comparing yourself to it. A blended 30 to 38 percent tells a furniture brand it is failing and a subscription brand it is winning, when the opposite may be true. Find your category's range, measure over a period that matches how often your customers actually rebuy, then split the number by customer value, because a healthy average can hide the quiet churn of the segment that funds everything. That last cut is where retention stops being a report and starts being a decision. See your retention by segment in Nexus.
Measure retention by segment and act on it with Nexus
Nexus by Omniconvert calculates customer retention at the RFM segment level, surfaces which of your highest-value segments are quietly churning, and ranks the retention actions by the revenue each one protects. Stop benchmarking against a blended average and start acting on the segments that fund your growth.