The eCommerce Ad Report, September 2026: Over Half of Ads Never Mention a Deal. Here's What They Say Instead

Scope: all industries and every country the eCommerceBenchmark Ad Library tracks. 68,341 decomposed ads from 2,573 brands, live in September 2026 and compared with August 2026. No split by country or industry.
Imagine walking into a shop where nobody tells you the price. Not on the sign. Not on the shelf. Nowhere.
That is what most eCommerce ads looked like in September.
We read every ad in the library for the month: 68,341 of them, from 2,573 brands. We sorted each one by how it opens, what it offers, who it talks to, and how it looks. The top of the charts barely moved since August. But one number should make you stop and check your own ads.
- Most ads don't say what the deal is. If yours does, you're doing something most of the market isn't. If yours doesn't, your first line has to do all the selling.
- The big lanes didn't move. So last month's crowding is this month's crowding. Your brief can't count on the market changing for you.
- The risers are tiny. They're cheap to test, but too small to build a month on.
We'll get to it. First, how ads open.
How ads open: the tease still wins
A hook is defined as the opening line of an ad, the words a shopper reads before anything else. Here are the biggest hooks of the month.
Share of September 2026 ads by opening hook, top eight of twelve. Source: eCommerceBenchmark Ad Library, 2026.
The Curiosity Gap wins by a mile, with about 19,000 ads. In August it was nearly the same. It keeps the payoff for the next line, like a magician who says “watch closely” and shows you nothing yet. Urgency / FOMO holds second place at 7.9%, and Authority is third at 6.4%.
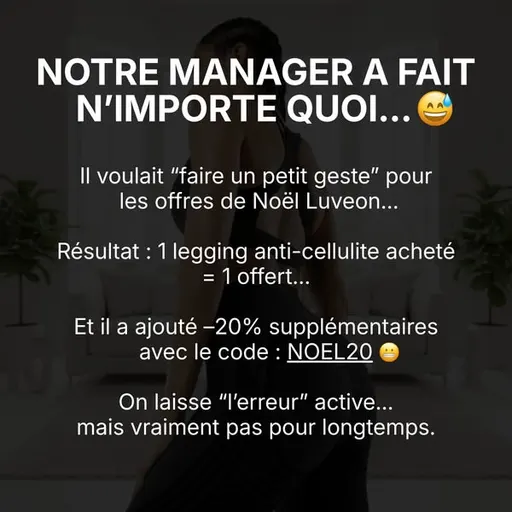

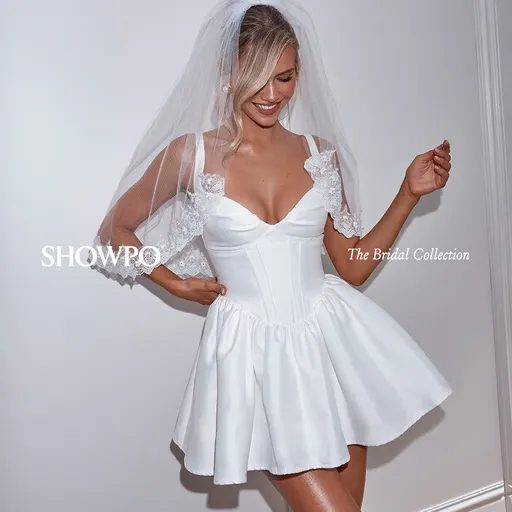
Look at the first one. luveon.com says “our manager has gone and done something silly”, which names nothing a shopper can price. You'll want to know what. That is the whole trick. All three cards work that way in their first three words.
So the opening tease is easy to spot. But what does the ad actually offer once you read on? That's where it gets strange.
57.3% of ads never mention a deal
Here is the number that should change your brief.
Share of September 2026 ads by the offer named in their words. Source: eCommerceBenchmark Ad Library, 2026.
Price? Oh, you'll find it on the page. Surprise!
That's the shop with no price tags again. For more than half of ads, the first line has to sell the whole thing, because the deal isn't in the words. A shopper meets a mood and a product name, then has to work out on the page what it costs.
Now see where the deal does show up. Look at the headline line under each ad. That is where it usually hides.
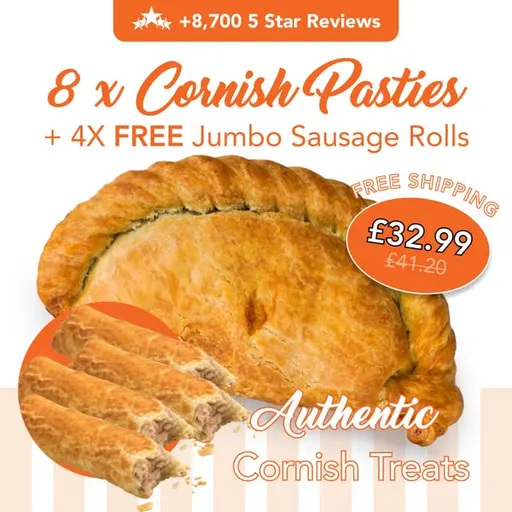
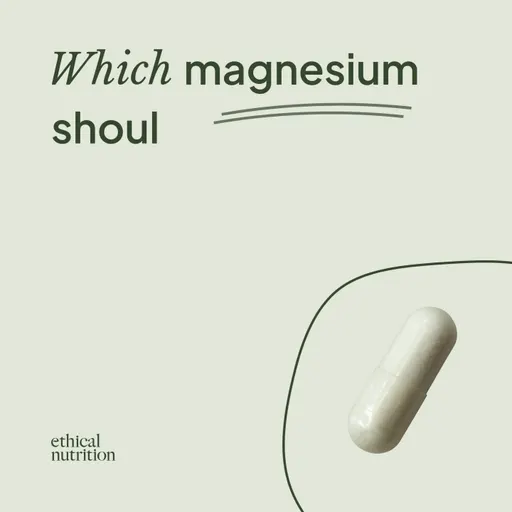
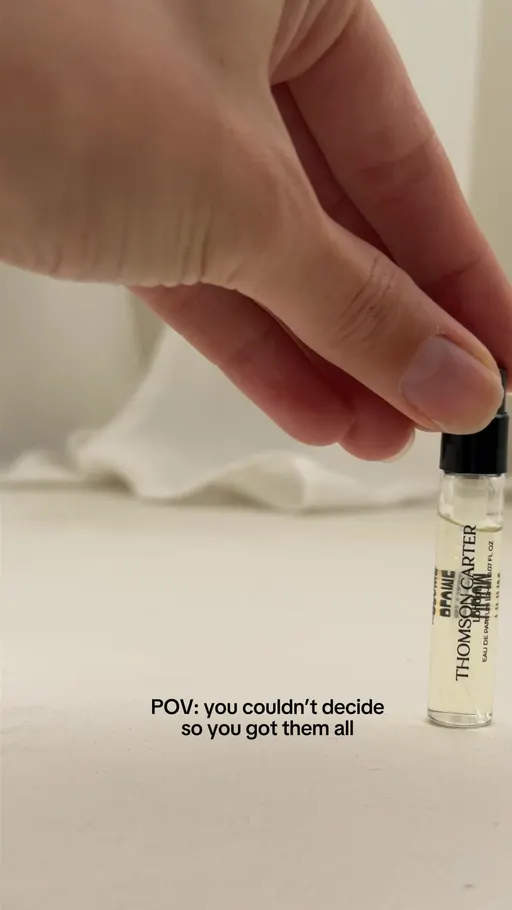
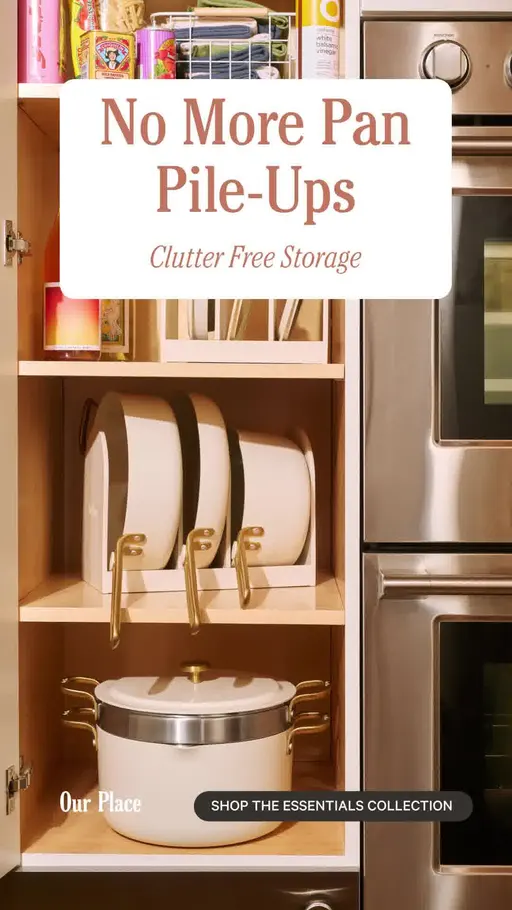
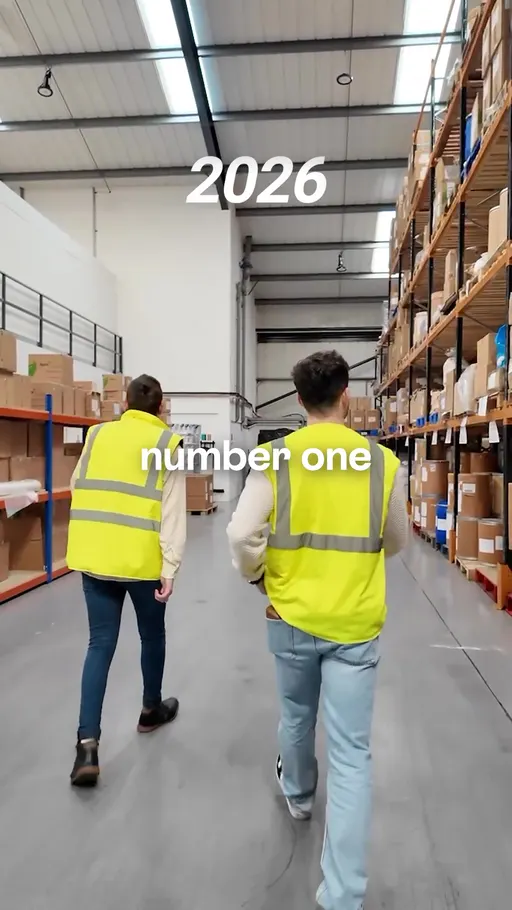

Read each opening line next to its headline. ethical-nutrition.com asks “which magnesium should you choose?” and then puts the saving in the headline: up to 40% off a bundle. alyve.health opens on a person's story and saves “free UK shipping” for the headline. thomsoncarter.com and masterofmalt.com name no deal at all.
So who are these ads talking to? That's the next question.
The angles: who ads are talking to
An angle is the reason an ad gives you to buy. Here are September's biggest angles.
Share of September 2026 ads by angle. Source: eCommerceBenchmark Ad Library, 2026.
Identity says “this is for people like you”, and it runs on about a quarter of all ads. That's a crowded room. Two angles sit right behind it, and they are the ones worth a closer look: Problem-aware and Objection crusher. Both move you from “who you are” to “what's bugging you”.
Problem-aware: it names the headache
A Problem-aware ad opens on a problem the shopper already has. It is the second-biggest angle at 11.9% of ads, and it sat at exactly 11.9% in August too. Nothing moved, so the lane isn't opening up or closing. Your competition in it is the same size as last month.
Here is the good news. Fewer brands write in this lane than in Identity, and its ads stayed up longer in the sample. A well-named problem is a better place to start, if you have one.
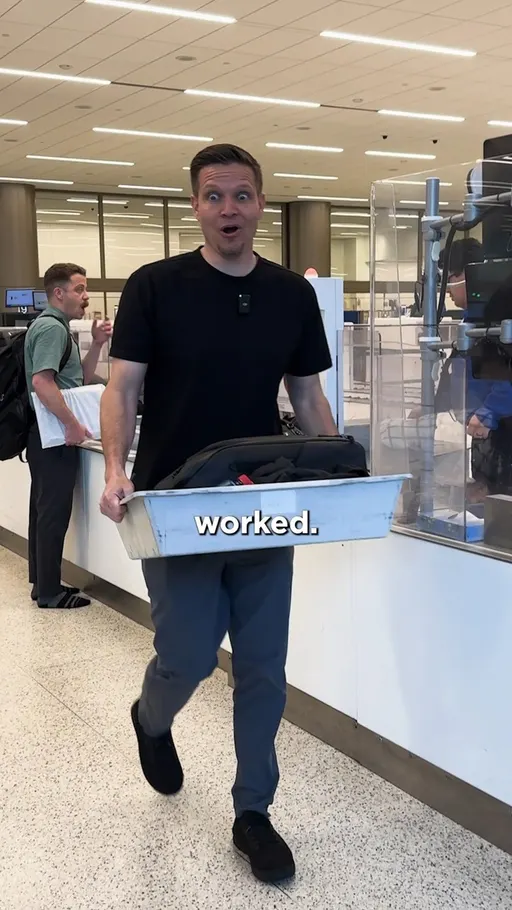
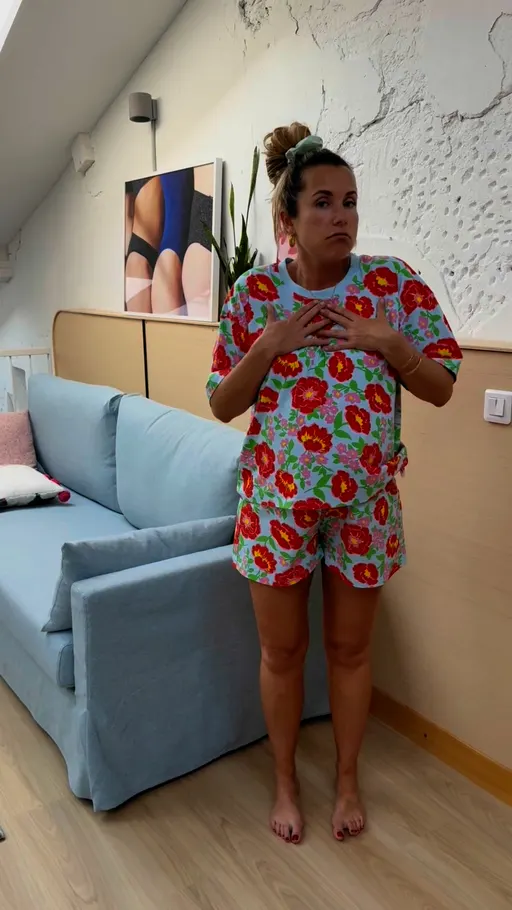

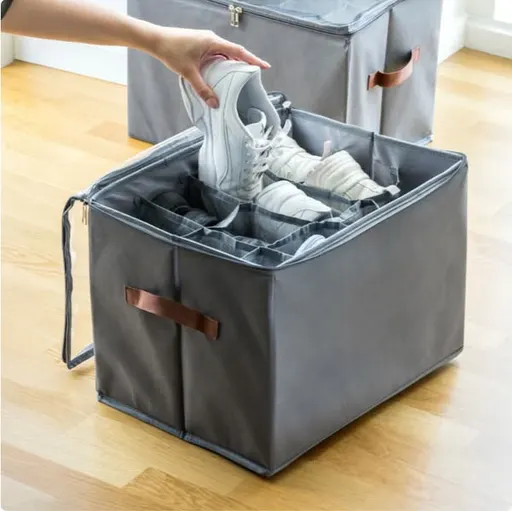
nomatic.com asks one question and stops: “Take water through TSA??” wearejolies.com does the same in French, asking whether its pyjamas are comfortable when pregnant. ambientlounge.eu names the strain of owning a big dog, in Japanese. viamaja.dk names the mess and the price in one breath: shoe storage boxes, two for only 99 kr.
That's the headache. Now the doubt. It's a different thing: the headache is “my feet hurt”, the doubt is “but is it worth the money?”
Objection crusher: it answers the doubt first
An Objection crusher is an angle that answers the shopper's main doubt before the shopper raises it. It sits on 9.4% of ads, about 6,400 of them, the same share as in August.
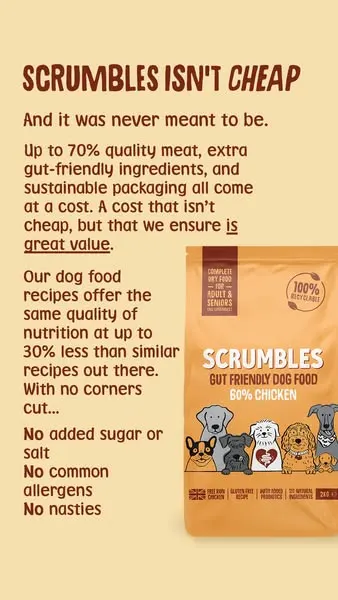

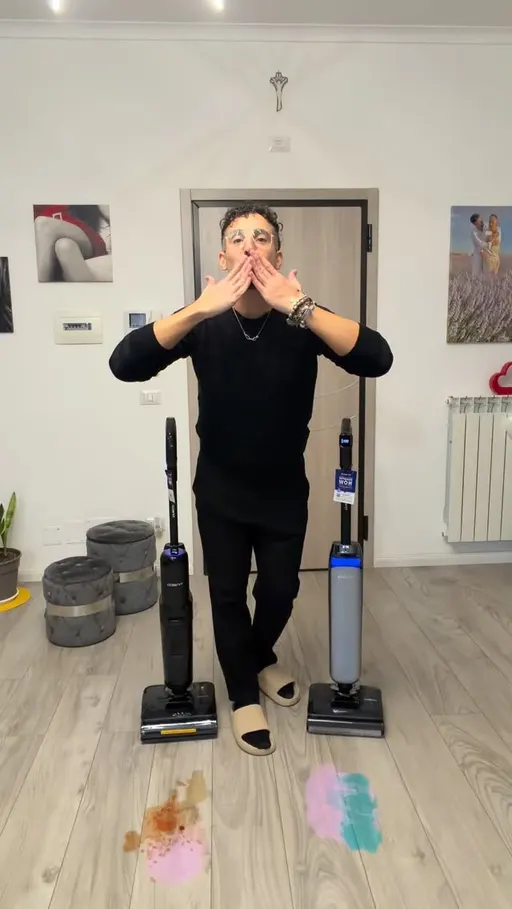
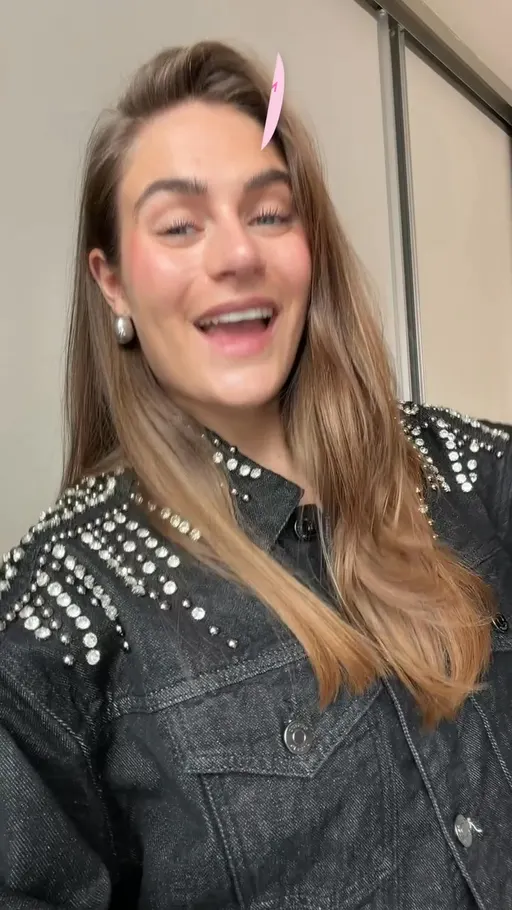
These four open on the doubt, not on the product. scrumbles.co.uk names the price worry in three words: “SCRUMBLES ISN'T CHEAP”. mollyogmy.dk puts the saving in the opener, a 15% discount for signing up to its newsletter. Two others put the saving in the headline, right beside the opening line, where a shopper meets it.
Doubts are one way to open. A cold, hard number is another. And almost nobody does it.
A number opens just 1.8% of ads
The Shocking Statement leads with a figure. It opens only 1.8% of ads. That makes it the narrowest lane among the six biggest hooks. Empty lane, open road? Maybe. Here are four ads that put a number in their first words.
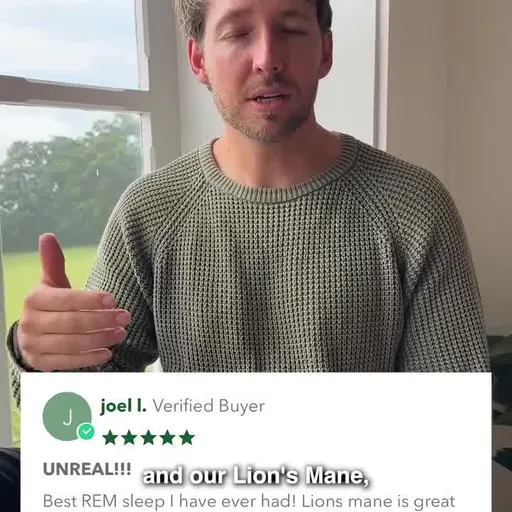
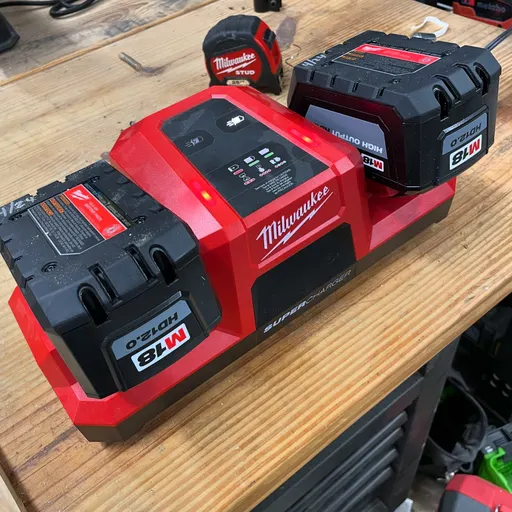

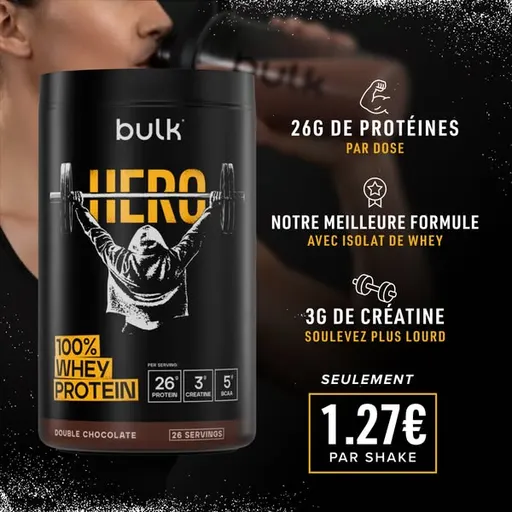
A count of people wearing a device. A charging speed. A share of men in an age range. The protein in one serving. All four commit in the first three words and leave the product name for later.
Ready to try it? Here are three tests built from the data.
Three tests to run next month
- An offer in the first three words. Run one ad whose opening line names the deal, against your current control. More than half of ads name no offer at all.
- A price-doubt opener. Lead with the objection you hear in replies, against a feature-led control.
- A number-led first line. Put one figure from your own product page in the opening words, against a mood-led control.
Skip the spreadsheet
The eCommerceBenchmark Ad Library sorts your ads into the same hooks, angles, concepts and offers used in this report, and shows your mix next to the market, so you can see which shapes you have never shipped.
Audit my creatives, freeTests are good. But what is actually moving? Not what you'd think.
What moved since August (spoiler: not much)
Nothing at the top of any ranking moved far. The risers all come off small bases. Here is every row that moved by a fifth of a point or more.
Change in share of ads, September vs August 2026, in percentage points. Concept rows rest on fewer ads, so compare them only with each other. Source: eCommerceBenchmark Ad Library, 2026.
Three looks (Cinematic B-roll, Montage, Offer-first banner) added share. The Curiosity Gap and Authority each gave a little back. The biggest concept, Product Demo Close-Up, held at 9.1% in both months.
The full rankings: hooks, angles, concepts and offers
For the curious, here is every ranking with both months side by side. Use them like worksheets. Write your own count beside each row, and see where you're really competing.
| Hook | September | August |
|---|---|---|
| Curiosity Gap | 28.1% | 28.5% |
| Urgency / FOMO | 7.9% | 7.9% |
| Authority | 6.4% | 6.7% |
| Relatability | 4.2% | 4.1% |
| Direct Question | 3.5% | 3.5% |
| Shocking Statement | 1.8% | 1.9% |
| Bold Claim | 1.2% | 0.8% |
| Newness | 1.1% | 0.7% |
| Angle | September | August |
|---|---|---|
| Identity | 25.7% | 25.4% |
| Problem-aware | 11.9% | 11.9% |
| Objection crusher | 9.4% | 9.4% |
| Social proof | 4.3% | 4.3% |
| Mechanism | 3.4% | 3.3% |
| Solution-aware | 2.8% | 2.4% |
| Comparison | 0.9% | 0.8% |
Concepts next, which is how an ad looks. Fewer ads carry a concept than a hook or angle, so read concept shares only against each other.
Share of September 2026 ads by concept. Source: eCommerceBenchmark Ad Library, 2026.
| Concept | September | August |
|---|---|---|
| Product Demo Close-Up | 9.1% | 9.1% |
| Cinematic B-roll | 4.9% | 4.6% |
| Offer-first banner | 1.1% | 0.9% |
| Customer Testimonial Reel | 1% | 0.9% |
| Montage | 0.9% | 0.6% |
| Side-by-Side Comparison | 0.7% | 0.7% |
| Offer | September | August |
|---|---|---|
| No offer (brand ad) | 57.3% | 57.3% |
| Discount | 15.7% | 15.5% |
| Free shipping | 4.6% | 4.7% |
| Bundle | 2.7% | 2.6% |
See how little the top of each ranking moved. Which brings us to a mistake that costs a lot.
The mistake: writing a brand ad and leaving the price to the page
Teams write a mood-led first line because “the offer is on the page anyway”. The ad then does no qualifying at all. (For a cold audience, a mood-led opener can be the right call. The mistake is doing it everywhere, including for people who already know you.) When a big part of the market does it at once, 39,140 ads in a single month arrive with nothing a shopper can price. The page has to carry the whole sale to traffic that was never told what it was clicking.
Not sure that's you? Check. It takes five minutes.
Your test card
Here is the first test from this article, set up the way a media buyer would run it. Fill in the blanks with your own numbers, and write them down before you launch.
| Hypothesis | A first line that names the deal will cost less per purchase than my mood-led opener, for people who already know my brand (retargeting). |
| Change only this | The first line only: name the deal in the first three words. |
| Keep the same | Picture, body, button, headline, audience and placement. |
| Funnel stage | Say first whether this ad is for prospecting (cold) or retargeting (warm). A deal in the first line is often right for warm audiences and wrong for cold ones, so test it where the ad will really run. |
| Setup | One control and one variant, same audience, same placement, even budget split. Do not edit either ad while the test runs. |
| How long and how much | Until each version has about 50 purchases, or two full weeks, whichever comes later. This is general testing practice (Meta's own learning-phase guideline is about 50 results per ad set per week), not a library finding. |
| Success metric | Cost per purchase, not clicks. |
| Stop rule | Pause a variant that has spent about 3 times your target cost per purchase with no purchase. If it is close, keep it running. |
| What counts as a win | The variant beats the control on the metric by an amount you would act on, and still does in a second week. |
Key takeaways
- The Curiosity Gap opened 28.1% of all ads in the month, about 19,000 of them [eCommerceBenchmark Ad Library, 2026]. Sort your own first lines into the same buckets before you brief more.
- 57.3% of ads name no offer at all. If your ad names no deal, the opening line is the whole sell.
- Identity is the angle on about a quarter of ads, 17,556 of them. It's a crowded lane, so say who the product is for in plainer words than the market does.
- Problem-aware is the second-biggest angle at 11.9% of ads, flat since August. Fewer brands write there than in Identity, so a well-named headache is a good place to start.
- Only 1.8% of ads open on a number. Few brands use the narrowest lane.
- Product Demo Close-Up held 9.1% of ads in both months. Compare concepts only with each other, because those rows rest on fewer ads.
- Newness and Bold Claim are the risers, but off small bases. Brief one new thing, don't swing the whole month.
Questions
Take your own last month and sort each ad four ways: the hook it opens on, the angle it argues, the concept it is staged as, and the offer in its words. Most teams find the offer column almost empty, and the hook column full of the same two lines. That empty box is next month's test, and it costs one ad to find out.