Zero New Faces in the Top Ten eCommerce Ad Concepts, September 2026 (But Montage Quietly Stole Fifth Place at 0.9% of All Ads)


Scope: every industry and country the eCommerceBenchmark Ad Library tracks, 68,341 ads classified by concept in September 2026 from 2,573 brands. This cut has no per-country or per-industry split.
Plot twist: nothing happened. And that is the story.
Every month we check for new faces at the top of the concept list. In September 2026 we looked, and looked again. Nobody new walked in. Nobody walked out. The ten biggest concepts are the same ten that ran in August.
But one pair did swap seats, like two kids at the back of a school bus. Let's see who, and why you should care.
- There is no new concept to chase. The list is the same ten as last month, so you can stop waiting for a shiny new thing to brief against.
- The list is a checklist. Sort your own ads into these ten boxes and look for the empty one. That empty box is next month's brief.
- The one mover is a small box. Montage is 0.9% of all ads. It is worth one test, not a whole new plan.
First question: did anyone really not enter?
No Concept Entered or Left the Ten
A creative concept is defined as the way an ad is staged on screen, such as a close-up on the product, a customer giving a verdict, or a run of quick cuts. No concept is new to the library's classification this month, because the September cut against August carries no rows at all [eCommerceBenchmark Ad Library, 2026]. There is no box on this list your account could not have had an ad in last month.
One thing to know. The shares here count every ad running in the month, not only the ads launched in it. So this is a picture of the whole market, not only of fresh ideas.
The top of the list did not move. Product Demo Close-Up held 9.1% of all ads in both months, and Cinematic B-roll held second place.
The bottom of the ten is where an exit would show, and it did not. Selfie talking-head held 0.4% of all ads in both months. UGC Unboxing held 0.4% in both months as well. Neither one pushed the other out.
Last month's places come from last month's shares of the same fifteen rows, which is the only ranking this cut gives. Read that way, the ten is not a scoreboard. It is a checklist of the boxes the market is filling, and the useful question is which of them you have nothing in.
So who swapped seats? It was a small move, but it is the only one, so let's look closely.
Montage Rose to Fifth, Side-by-Side Comparison Held at 0.7%
Montage is defined as a concept that puts several short looks at the product into one ad instead of holding one shot. Montage carried 0.9% of all ads in September 2026 against 0.6% in August, a rise of 0.3 points. It was already inside the ten in August, so this is a climb inside the ten, not an entry.
| What moved | Before → after | Change |
|---|---|---|
| Cinematic B-roll concept | 4.6% → 4.9% | ▲ 0.3 pt · +7% |
| Montage concept | 0.6% → 0.9% | ▲ 0.3 pt · +50% |
| Offer-first banner concept | 0.9% → 1.1% | ▲ 0.2 pt · +22% |
Here is the same move as a picture. The tall bars are September. The grey ones are August.
Share of all ads by concept, September against August 2026. Source: eCommerceBenchmark Ad Library, 2026.
Side-by-Side Comparison did not fall. It held 0.7% of all ads in both months, on 484 ads, and ended up sixth on September's order anyway. That is what a reshuffle looks like from the inside: one row rises, the row below keeps everything it had, and the place changes hands.
By brands, the row that slipped is the wider of the two. Side-by-Side Comparison ran across 262 brands. Montage ran across 173. So the one that went down in rank is the one more brands use.
Montage was not alone in moving. Cinematic B-roll went from 4.6% in August to 4.9% in September, the same 0.3 points, and stayed second. Offer-first banner went from 0.9% to 1.1%, on 737 ads. Three rows in the ten moved by at least 0.2 points, and only one of the three changed place.
One gap to name plainly: this cut carries no ad copy we can quote for Montage, so Montage is here as a share with its ad and brand counts, and no line of its own. The ads below come from the row directly above it.
Now for the fun part: the actual ads. We could not show a Montage ad, but we can show the row Montage just passed.
Customer Testimonial Reel, the Row Above at 1%
The row Montage did not pass is Customer Testimonial Reel, at 1% of all ads in September against 0.9% in August. That is 675 ads from 305 brands [eCommerceBenchmark Ad Library, 2026]. When fourth and fifth sit this close, these are the ads a planner is choosing between.


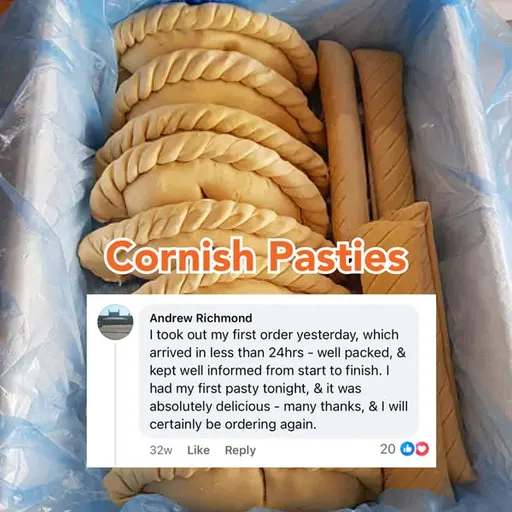
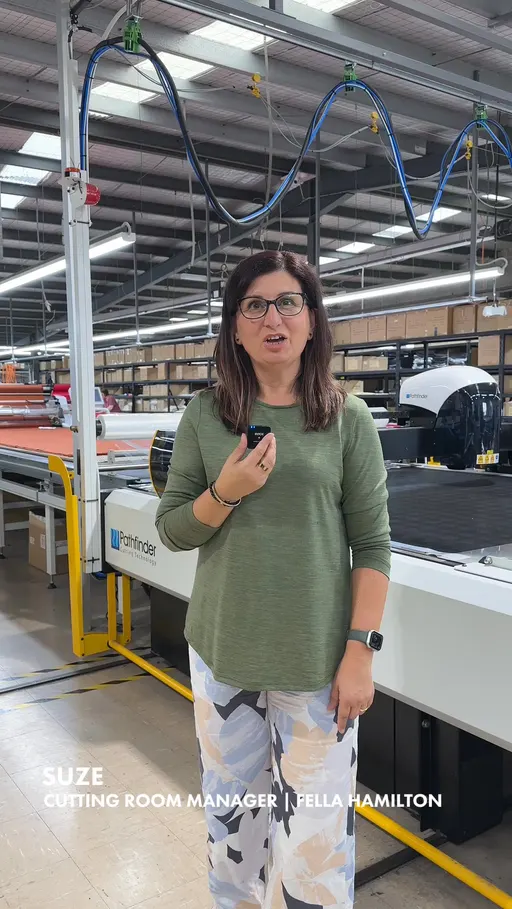
skolyx.se opens one of them with "High quality sneakers", and that ad has been on air 340 days. A long run only means a brand kept paying for the ad, not that it sold anything. The four cards above are the longest-running ones we can show in this concept: ethical-nutrition.com (443 days), skolyx.se (340 days), properpasty.co.uk (214 days) and fellahamilton.com.au (187 days).
Days on air for the four Customer Testimonial Reel ads shown. Days on air means how long a brand kept an ad live, never what it sold. Source: eCommerceBenchmark Ad Library, 2026.
Ready to turn all of that into something you can actually do on Monday?
What to Test
Three tests, one month each
- A quick-cut concept against your control. Run one ad built from several short looks at the product against your steadiest demo ad for a full month. Montage is 0.9% of all ads, so most accounts have nothing in that box.
- A customer verdict as the first line. Put a six-word customer verdict in the opening line and the brand and the ask in the headline, against your current control. Customer Testimonial Reel runs at 1% of all ads from 305 brands.
- A side-by-side still. Two states of the same product in one frame, against your single-product control. Side-by-Side Comparison held 0.7% of all ads in both months.
Where does your account sit?
The eCommerceBenchmark Ad Library sorts your ads into the same hooks, angles, concepts and offers used in this report and shows your mix next to the market, so you can see which shapes you have never shipped.
Audit my creatives, freeNow the whole list in one place, with both months side by side.
The Full Ten, September Against August
In September order with August printed beside it, one pair changes places and no other row changes rank. Product Demo Close-Up held 9.1% in both months. The only order change is Montage at 0.9% passing Side-by-Side Comparison, which held 0.7% [eCommerceBenchmark Ad Library, 2026].
Concept share of all ads, September 2026 with August beside it. Rows under 300 ads are left out: Selfie talking-head, Grid swap and Problem agitation. Source: eCommerceBenchmark Ad Library, 2026.
| Concept | September | August | Ads in September |
|---|---|---|---|
| Product Demo Close-Up | 9.1% | 9.1% | 6,208 |
| Cinematic B-roll | 4.9% | 4.6% | 3,326 |
| Offer-first banner | 1.1% | 0.9% | 737 |
| Customer Testimonial Reel | 1% | 0.9% | 675 |
| Montage | 0.9% | 0.6% | 634 |
| Side-by-Side Comparison | 0.7% | 0.7% | 484 |
| UGC Unboxing | 0.4% | 0.4% | 301 |
The last rows sat still too. Grid swap held 0.3% of all ads in both months, and Problem agitation sat at 0.1% in August and 0.2% in September. Printing both months is the point of the exercise: a row can lose a place without losing a single tenth of a point, and a mover list on its own never shows that.
How big is the first row next to the rest? Product Demo Close-Up is 9.1% of all ads, on 6,208 ads. Montage is 0.9%, on 634. Most of the ten are tiny lanes. That is why one small test can matter here.
One last thing before the wrap-up: a habit that quietly wastes a lot of ad months.
The Mistake: Briefing the Row That Moved
The common practice is to read the month's mover list, brief next month's creative to the row that rose, and then do the same thing again the month after. What you see in the account is one ad of everything, with no control held steady long enough to compare anything against.
When the whole field reads the same mover list at once, the fifth row, at 0.9% of all ads [eCommerceBenchmark Ad Library, 2026], fills with near-identical runs of short looks, and a shopper scrolling meets the same quick cuts on ad after ad. Everyone zigs together, and nobody stands out.
Your test card
Here is the first test from this article, set up the way a media buyer would run it. Fill in the blanks with your own numbers, and write them down before you launch.
| Hypothesis | One ad in a concept I never use (a quick-cut ad, or a customer verdict as the first line) will land close to my steadiest ad. |
| Change only this | The concept, or the first line, but not both at once. |
| Keep the same | Product, offer, audience, placement and budget split. Keep the steadiest ad running. |
| Funnel stage | Say first whether this ad is for prospecting (cold) or retargeting (warm). A deal in the first line is often right for warm audiences and wrong for cold ones, so test it where the ad will really run. |
| Setup | One control and one variant, same audience, same placement, even budget split. Do not edit either ad while the test runs. |
| How long and how much | Until each version has about 50 purchases, or two full weeks, whichever comes later. This is general testing practice (Meta's own learning-phase guideline is about 50 results per ad set per week), not a library finding. |
| Success metric | Cost per purchase, not clicks. |
| Stop rule | Pause a variant that has spent about 3 times your target cost per purchase with no purchase. If it is close, keep it running. |
| What counts as a win | The variant beats the control on the metric by an amount you would act on, and still does in a second week. |
Key takeaways
- No concept entered or left the market's top ten in September 2026: the month's new-concept cut carries no rows [eCommerceBenchmark Ad Library, 2026]. Read the order, not the roster.
- Montage carried 0.9% of all ads in September against 0.6% in August. That is 634 ads from 173 brands, and the one row in the ten that changed places.
- Side-by-Side Comparison held 0.7% of all ads in both months. It slipped to sixth on 484 ads without losing any share.
- Cinematic B-roll moved as much as Montage, 4.6% in August to 4.9% in September, and stayed second. Product Demo Close-Up held 9.1% in both months.
- Offer-first banner went from 0.9% to 1.1% of all ads. That is 737 ads, the third row in the ten to move by at least 0.2 points.
Questions
Nothing entered. Nothing left. One pair swapped at fifth, and Montage at 0.9% of all ads is the row that did it, past Side-by-Side Comparison at 0.7%. So stop waiting for a new concept to brief against. Take your last month of ads, sort them into these ten concept names, and find the box with nothing in it. That empty box is next month's brief, and the order above tells you how crowded the row already is.