Repeat Purchase Rate vs Retention Rate vs Churn Rate

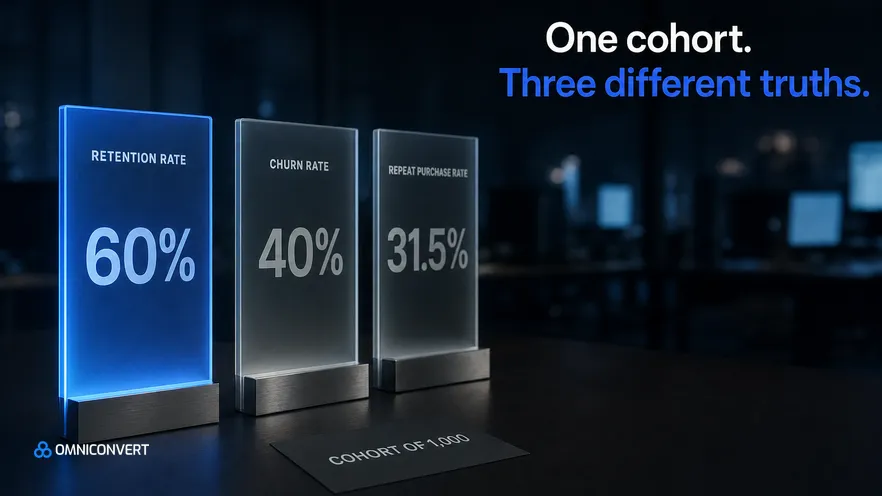
- Repeat purchase rate is lifetime-to-date. Retention rate is always period-bound. They will not agree.
- Retention rate = ((customers at end − new customers) ÷ customers at start) × 100. Skipping the subtraction breaks it.
- Churn and retention are exact complements only in contractual businesses. eCommerce is not one.
- Your churn number is mostly a consequence of the lapse window you picked.
- Set the window from your own first-to-second-order gap, not from a convention.
- All three count customers, not value. Segment by value before you read any of them.
Ask three people in the same company what their retention is and you will often get three numbers. They are usually all correct. Repeat purchase rate, retention rate and churn rate measure different things over different time frames, and one of them is not really a measurement at all until you make a decision that most teams make by accident. Here are the three formulas, one cohort run through all of them, and the definition trap that quietly sets your churn number for you.
What are repeat purchase rate, retention rate, and churn rate?
That last sentence is the one worth rereading. In a subscription business churn is an event you record. In eCommerce it is an inference you construct, and the construction is yours.
How do repeat purchase, retention, and churn compare?
| Repeat purchase rate | Retention rate | Churn rate | |
|---|---|---|---|
| Time frame | Lifetime to date | A defined period | A defined lapse window |
| Denominator | All customers | Customers at period start | Customers considered active |
| Question answered | Do they ever come back? | Is the base holding? | Who has gone quiet? |
| Depends on a choice | No | Period length | Lapse window, heavily |
| Good for | Product and post-purchase quality | Reporting and cohorts | Triggering action |
| Reacts to new customers | Dilutes it | Excluded by formula | Depends on definition |
The last row explains a common confusion. A strong acquisition month pushes repeat purchase rate down, because it adds a large group of people who have bought exactly once. Nothing has gone wrong. The metric simply moved for a reason unrelated to retention quality.
How does one cohort give three different readings?
What is the lapse window problem?
Run the same customer base through three different definitions of "lapsed" and you get three different churn rates:
| Lapse window | Counted as churned | What it is good for |
|---|---|---|
| 90 days | The most | Fast-cycle categories, early warning |
| 180 days | Fewer | Most mid-cycle eCommerce |
| 365 days | The fewest | Considered or seasonal purchases |
None of these is the correct answer in the abstract. The correct window comes from your own data: find the typical gap between a customer's first and second order, then set the lapse window at roughly two to three times that gap. A coffee brand might land on 90 days and a furniture brand on 18 months, and both would be right.
Two rules follow. State the window every time you state a churn figure, and never compare your churn to another company's without checking theirs. Most published churn comparisons quietly compare two different definitions.
Which metric should you use when?
| Question | Use | Why |
|---|---|---|
| Does our product earn a second order? | Repeat purchase rate | No period boundary to distort it |
| Did this quarter hold together? | Retention rate | Period-bound by construction |
| Who should get a win-back email today? | Churn, per customer | Only one that identifies individuals |
| Is the January cohort better than March? | Retention rate, by cohort | Cohorts are its native form |
| Are we losing our best customers? | None of them alone | All three count heads, not value |
What do all three metrics miss?
Lose a buyer who ordered twelve times at full price and lose a buyer who ordered once on a heavy discount, and all three metrics record the same thing: one customer gone. The financial difference between those two events can be an order of magnitude, and none of these numbers will ever show it.
This is why a retention dashboard can stay flat through a genuinely serious problem. If you lose high-value customers and replace them with discount-driven one-time buyers, headcount holds, the metrics hold, and the profit quietly does not.
Omniconvert Commander (formerly Nexus) unifies purchase and behavior data into one customer view, segments customers by RFM behavior and value, and predicts lifetime value, so retention can be read segment by segment instead of as one blended average.
See how it works →How do you move from averages to segments?
Split the same cohort by RFM segment and the flat average usually breaks into two opposite stories: a loyal group holding steady and a valuable group drifting away, or the reverse. Both are actionable. The blended number is not.
That is also the point at which retention work stops being reporting and becomes a plan, because a named segment can be given a specific offer, message and timing. A percentage cannot. The tactics themselves are covered in customer retention strategy and how to reduce churn.
Repeat purchase rate vs retention rate vs churn rate FAQ
Repeat purchase rate is the share of customers who have bought more than once. Retention rate is the share of customers present at the start of a period who are still active at the end of it.
Repeat purchase rate is a lifetime-to-date measure with no time window; retention rate is always tied to a specific period, so the two answer different questions and rarely match.
Retention rate = ((customers at end of period − new customers acquired during period) ÷ customers at start of period) × 100.
Subtracting new customers is the step teams most often skip, and skipping it turns a retention metric into a growth metric that can show above 100 percent.
In a contractual business such as a subscription, yes: a customer either renews or cancels, so churn and retention sum to 100 percent.
In ordinary eCommerce there is no cancellation event, so churn depends on a lapse window you define. Change the window and churn changes, while nothing about customer behavior has changed at all.
Base it on your own purchase cycle rather than a convention. Find the typical gap between first and second orders, then set the lapse window at roughly two to three times that gap.
A coffee brand and a mattress brand need completely different windows, and using the same one for both makes the numbers uncomparable.
Use repeat purchase rate to judge whether your product and post-purchase experience earn a second order at all. Use retention rate to track a defined period or cohort. Use churn to trigger action on individual customers who have gone quiet.
Reporting one number as retention health is what causes teams to celebrate and worry at the wrong times.
They count customers, not value. Losing one high-value repeat buyer and losing one discount-driven one-time buyer look identical in all three, even though the financial impact differs enormously.
Segmenting by value before reading any retention metric is what turns it into a decision rather than a report.
Omniconvert Commander unifies purchase and behavior data into one customer view, segments customers by RFM behavior and value, and predicts lifetime value.
That turns a single blended churn figure into named segments, so you can see which specific group is slipping away rather than only that the average moved.
Most retention dashboards show one number and call it retention. That is where the trouble starts, because the three metrics here answer genuinely different questions: has this customer base ever come back, is it holding together this quarter, and who has gone quiet recently enough to act on. A team can look healthy on one and ill on another for entirely legitimate reasons. Report all three, state the lapse window next to the churn figure every single time, and segment by customer value before drawing a conclusion from any of them.
See which segment is actually leaving
A blended churn number tells you something moved. Omniconvert Commander unifies purchase and behavior data into one customer view, segments customers by RFM behavior and value, and predicts lifetime value, so you can name the group that is slipping and act before it goes quiet.