How A/B Testing ROI Compounds: Real Numbers from E-commerce Teams

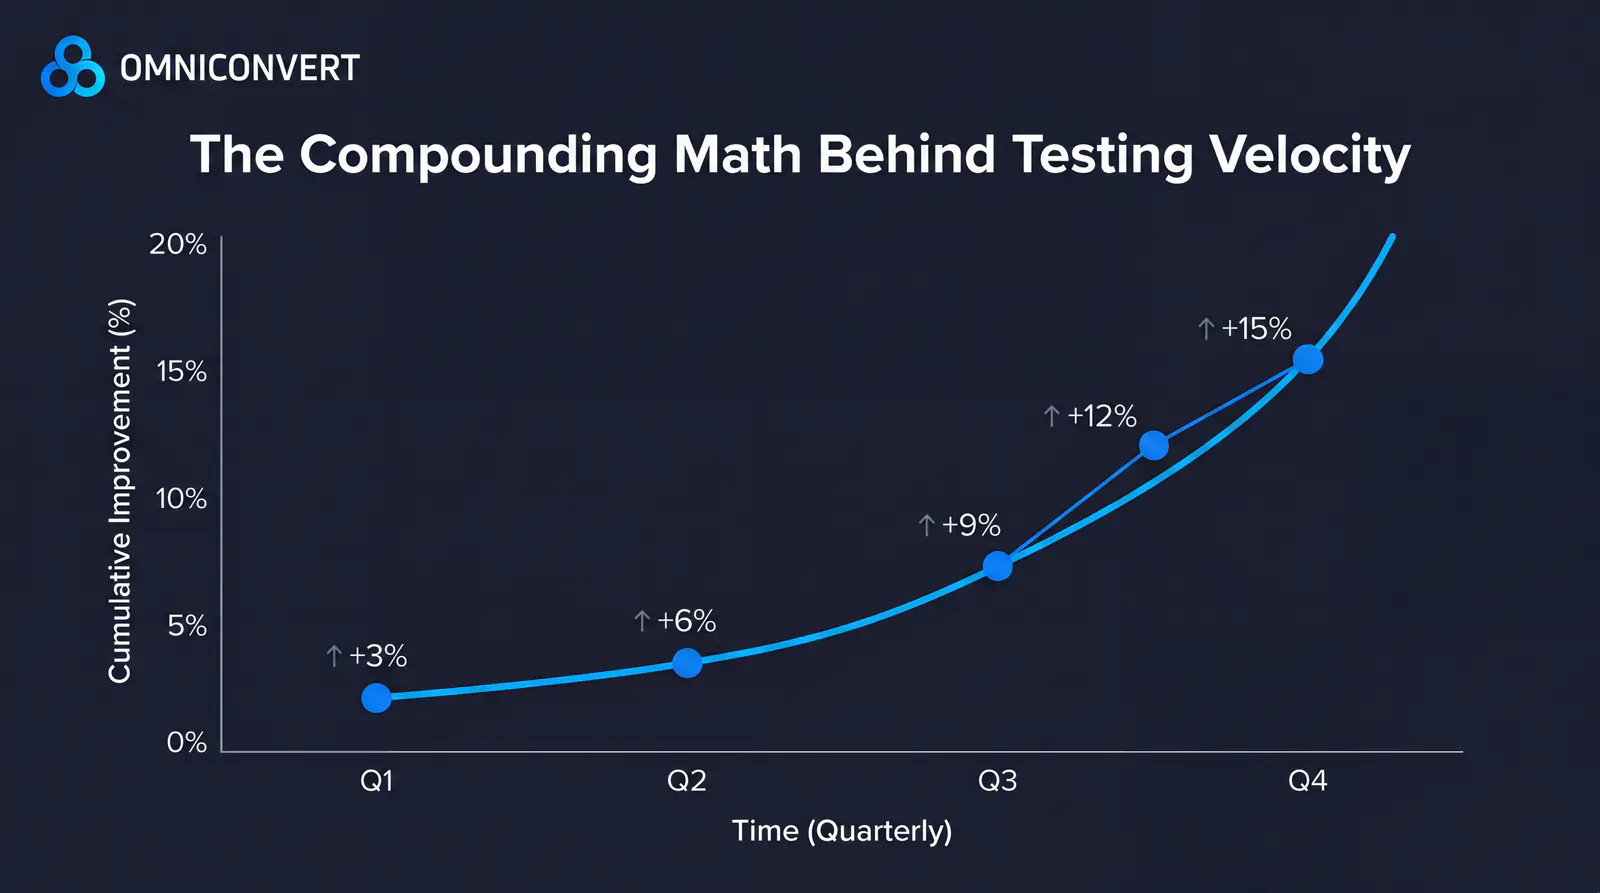
- Testing ROI compounds over time: each winning variation becomes the baseline for future experiments, creating exponential value from consistent testing velocity
- Setup speed directly impacts testing capacity — visual editors, code options, and native integrations remove friction that slows experimentation
- Data triangulation from multiple sources produces more confident decisions than relying on any single metric
- Risk mitigation value is substantial but often uncounted — failed tests prevent costly production mistakes
- Support quality acts as a multiplier on tool value, especially for teams with complex technical environments
Every test you run either makes money or teaches you how to make more. The question is whether your current testing velocity matches your growth ambitions.
Most e-commerce teams know A/B testing matters, but they struggle to quantify its actual business impact. Tests take too long to set up, results sit in dashboards without driving decisions, and the gap between "we should test that" and "we shipped a winner" keeps growing. Meanwhile, competitors who test faster compound their learnings and pull ahead.
This article breaks down how leading e-commerce teams measure and maximize A/B testing ROI, with specific workflows that turn testing from a nice-to-have into a measurable growth engine.
The Compounding Math Behind Testing Velocity
A/B testing ROI works like compound interest. Each winning variation you ship becomes the new baseline for your next test. Teams running 10 tests per month accumulate learnings faster than teams running 2, and that gap widens exponentially over time.
Consider the math: if each winning test lifts conversion by just 3%, and you ship 4 winners per quarter, you're looking at roughly 12% cumulative improvement annually. That's before factoring in the risk mitigation value of tests that prevent bad changes from reaching production.
The real question isn't whether to test. It's how to remove friction from your testing pipeline so you can run more experiments with less effort. Setup time, technical complexity, and result interpretation all create drag on your testing velocity.
High-performing e-commerce teams treat testing infrastructure as a growth multiplier. Every hour saved on setup is an hour that can go toward hypothesis development or result analysis. Every integration that simplifies data triangulation means faster, more confident decisions.
Setup Speed: From Idea to Live Test in Minutes

The fastest path to testing ROI is reducing the time between hypothesis and live experiment. When setup takes hours or requires developer involvement for every variation, testing becomes a bottleneck instead of an accelerator.
Modern testing workflows should support both technical and non-technical team members. Visual editors let marketers build variations without code, while code-based options give developers full control for complex implementations. This flexibility means the right person can execute the right test without handoffs.
Integration matters here too. When your testing tool connects directly to your analytics stack, you eliminate manual data reconciliation. GA4 integration, for example, lets you analyze test performance within your existing reporting workflows rather than building parallel dashboards.
Data Triangulation: Why One Source Isn't Enough
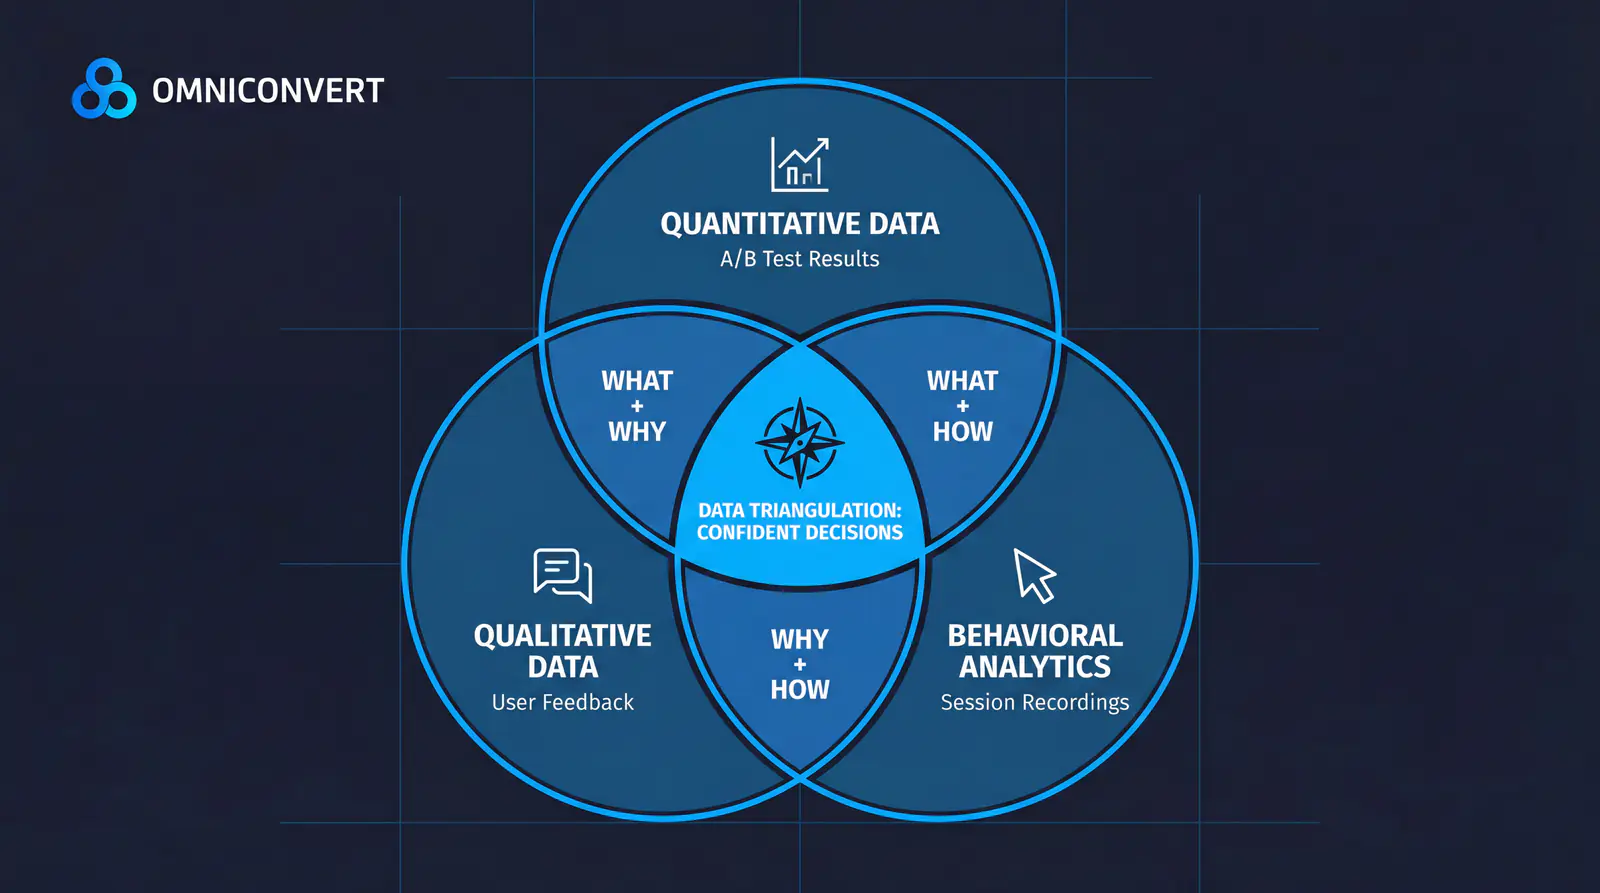
Quantitative data tells you what happened. Qualitative data tells you why. The most confident testing decisions come from triangulating multiple data sources rather than relying on a single metric.
Leading teams combine their testing platform's native tracking with behavioral analytics tools like Microsoft Clarity or Hotjar. When your A/B test shows Variation B outperformed the control by 8%, session recordings help you understand the behavioral difference that drove that lift.
This triangulation approach also protects against measurement errors. If your testing platform and your analytics tool both show the same winner, you can ship with confidence. If they disagree, you have a signal to investigate before making a permanent change.
The technical setup for this kind of data integration used to require significant developer time. Now, native integrations between testing platforms and analytics tools handle the plumbing automatically, letting you focus on interpretation rather than implementation.
Risk Mitigation: The Hidden ROI of Testing

Not every test produces a winner, and that's actually valuable. Tests that show no difference or negative results prevent you from shipping changes that would hurt conversion.
Consider a redesigned checkout flow that the design team loves but users find confusing. Without testing, that change ships to 100% of traffic immediately. With testing, you catch the problem on 20% of traffic and iterate before wider rollout.
This risk mitigation value rarely shows up in ROI calculations, but it's substantial. Every prevented regression is revenue you didn't lose. Every failed test is a hypothesis you can discard without damaging your conversion rate.
Teams that understand this dynamic run more tests, including tests on changes they're fairly confident about. The cost of a quick validation test is almost always lower than the cost of a production rollback or extended period of suboptimal performance.
Filter Flexibility and Segmentation Value

Aggregate test results hide important nuances. A test might show flat overall performance while actually winning big with mobile users and losing with desktop users. Without segmentation, you'd miss both insights.
Effective testing platforms let you filter results by device, traffic source, user segment, and custom parameters without charging premium pricing for basic functionality. This flexibility changes how you analyze results and what actions you take.
For example, a pricing page variation might resonate strongly with users from paid search but underperform with organic visitors. That's not a failed test. It's a signal to deploy the variation selectively or investigate why the segments respond differently.
The ability to export data via API also matters for teams with custom reporting needs. When test results flow into your existing BI tools, testing insights become part of your regular decision-making process rather than siloed in a separate platform.
Support Quality as a Testing Multiplier

Testing tools are only as valuable as your ability to use them correctly. Setup errors, tracking issues, and result interpretation mistakes all reduce the reliability of your experiments.
This is where support quality directly impacts ROI. Teams that can quickly resolve implementation questions run more valid tests. Teams stuck troubleshooting for days lose testing velocity and may ship decisions based on flawed data.
Custom-built websites with single-page application architectures or complex technical requirements present particular challenges. The learning curve for proper test implementation can be steep, and having responsive support during that ramp-up period determines whether teams achieve testing proficiency or abandon the effort.
Responsive support also helps teams push beyond basic A/B tests into more sophisticated experimentation. Multivariate tests, personalization campaigns, and complex targeting rules all require more setup expertise, and having reliable guidance accelerates the path to advanced capabilities.
Building a Testing Culture That Scales
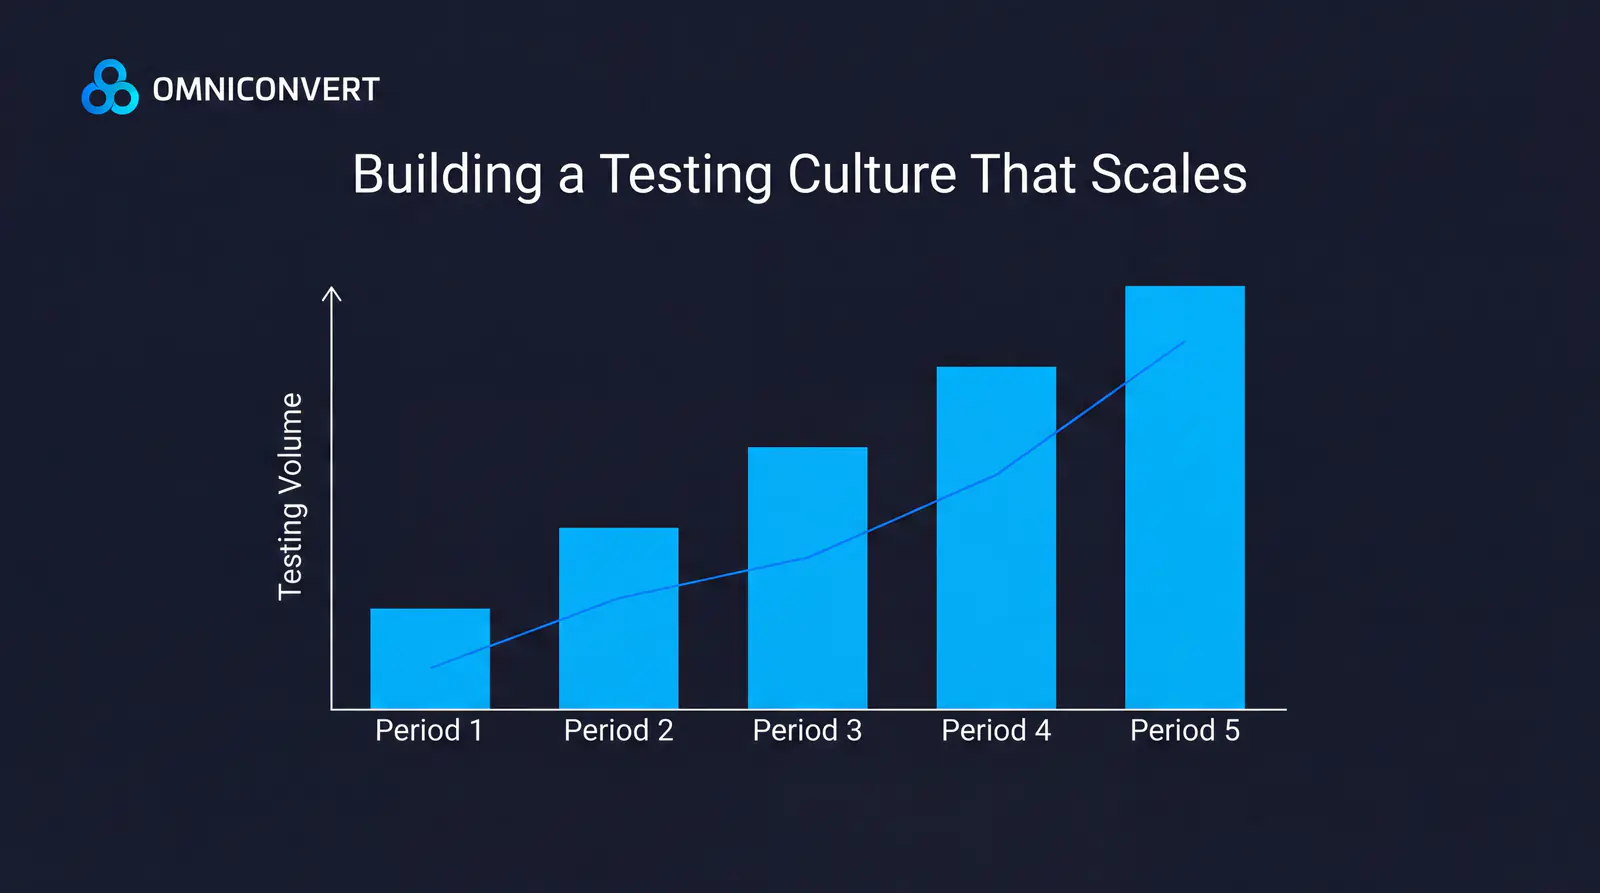
Tools and processes matter, but culture determines whether testing becomes central to your growth strategy or remains a sporadic activity. The teams that extract the most ROI from testing are the ones that test consistently, learn from every result, and iterate based on data.
Start by making testing the default rather than the exception. Before shipping any significant change, ask whether it should be tested first. Build the habit of hypothesis documentation so you capture learnings even from tests that don't produce clear winners.
Share results broadly across the organization. When product teams see how testing validated a design decision, they become advocates for the process. When leadership sees quantified lift from winning variations, testing budget becomes easier to justify.
Finally, measure your testing program itself. Track tests run per month, average test duration, win rate, and cumulative lift. These meta-metrics help you identify bottlenecks in your testing pipeline and demonstrate the program's value over time.
Frequently Asked Questions
A/B testing ROI works like compound interest. Each winning variation becomes the new baseline for the next test. If each winning test lifts conversion by 3% and you ship 4 winners per quarter, you accumulate roughly 12% cumulative annual improvement. Teams running more tests per month widen that gap exponentially over competitors running fewer.
Failed tests prevent you from shipping changes that hurt conversion. A redesigned checkout that users find confusing caught on 20% of traffic is far cheaper than a full production rollback. Every prevented regression is revenue you didn't lose — substantial ROI that rarely appears in standard test-win calculations.
Quantitative data tells you what happened; qualitative data tells you why. Combining your testing platform's native tracking with tools like Microsoft Clarity or Hotjar lets you validate results across sources. When both agree on a winner, you ship with confidence. When they disagree, it signals an investigation before a permanent change.
Device, traffic source, user segment, and custom parameter filters are essential. Aggregate results hide critical nuances — a test flat overall might be winning big on mobile and losing on desktop. Platforms that charge premium pricing for basic segmentation reduce your ability to extract full value from each experiment.
Support quality directly impacts how many valid tests you can run. Setup errors, tracking issues, and misinterpreted results all reduce experiment reliability. Teams that quickly resolve implementation questions maintain testing velocity; teams troubleshooting for days lose momentum and risk shipping decisions based on flawed data.
A/B testing ROI isn't just about individual test wins. It's about building a system that runs experiments efficiently, interprets results accurately, and ships improvements continuously. The teams pulling ahead in e-commerce are the ones who've removed friction from their testing workflows and made experimentation a core part of how they operate. Whether you're running 2 tests per month or 20, the path to better ROI starts with identifying and eliminating whatever's slowing you down.
Ready to compound your testing ROI?
Omniconvert Explore gives marketing teams a live editor, GA4-native tracking, and a support team that proactively guides every experiment — no developers required.