CAC Payback Period: How to Calculate It and What's Good

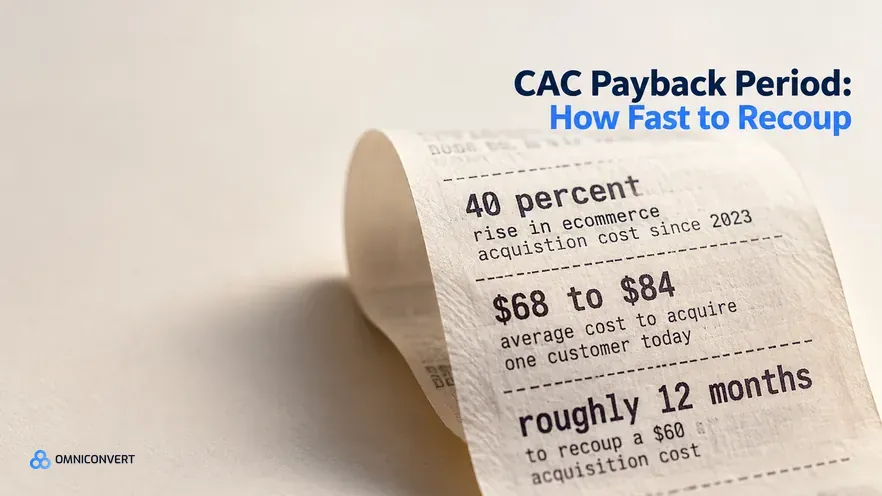
- The CAC payback period is how many months a customer's gross profit takes to repay acquisition cost: CAC divided by (AOV times gross margin times annual order frequency, divided by 12).
- Under 6 months is excellent and under 12 is healthy for most DTC; beyond 12 months you need exceptional retention, fat margins, or outside capital to survive.
- Payback beats LTV to CAC because it measures speed: two brands with the same 3 to 1 ratio grow at different rates if one recoups in 3 months and the other in 12.
- Ecommerce CAC is up about 40 percent since 2023, now roughly $68 to $84 per customer, which is why payback has stretched and retention has become the decisive lever.
- The cheapest way to shorten payback is retention: a second and third purchase spread the same acquisition cost across more gross profit without buying anyone new.
The CAC payback period is the number of months it takes the gross profit from a single customer to repay what you spent to acquire them. It is the metric that tells a direct-to-consumer brand whether scaling ad spend will compound cash or drain it. Across the CROBenchmark dataset of 7,000+ websites in 15+ industries, brands that tracked payback by cohort recovered acquisition cost faster than those watching a blended average, drawing on 13 years in conversion rate optimization [CROBenchmark Report 2026, Omniconvert].
Nexus by Omniconvert is the AI eCommerce growth engine that calculates payback by cohort and ranks the actions that shorten it. This guide covers what the payback period tells you, how to calculate it on gross profit, 2026 benchmarks by model and vertical, why it has got harder, why it is really a speed metric, the four levers that shorten it, and where most brands measure it wrong. Every section answers the question directly, then goes deeper.
What does the CAC payback period tell you?
Most acquisition metrics measure whether a customer is profitable. Payback measures when. That distinction is the whole point. A customer can be highly profitable over three years and still bankrupt a fast-growing brand if the profit arrives too slowly, because every dollar locked up in an unpaid-back customer is a dollar you cannot use to acquire the next one.
This is why payback beats the LTV to CAC ratio as an operating metric. LTV to CAC is a static verdict delivered at the end of the customer's life; payback is a clock that starts the moment you spend the acquisition dollar. Two brands can share an identical 3 to 1 ratio and live in completely different worlds, because one has its cash back in three months and the other waits a year. The ratio tells you the destination; payback tells you the speed of the trip, and speed is what you feel in the bank account.
How do you calculate CAC payback period?
The formula has two parts. First, work out how much gross profit a customer contributes each month. Then divide the acquisition cost by that monthly contribution:
- Monthly gross profit per customer: Average Order Value × Gross Margin % × Annual Order Frequency ÷ 12.
- Payback period (months): CAC ÷ Monthly Gross Profit per Customer.
The monthly gross-profit contribution is defined as the share of a customer's spending you actually keep in a given month after cost of goods, not the revenue they generate. It matters in ecommerce because only that retained margin can repay acquisition cost, so it, not revenue, is the number that drives the payback clock.
A worked example makes it concrete. Take a DTC brand with an average order value of $80, a 50 percent gross margin, a purchase frequency of 1.5 orders per year, and a customer acquisition cost of $60 [eightx, 2026]:
- Monthly contribution: $80 × 50% × 1.5 ÷ 12 = about $5 of gross profit per month.
- Payback period: $60 ÷ $5 = 12 months to recoup the acquisition cost.
- The lever hiding in plain sight: lift frequency to 3 orders a year and monthly contribution doubles to $10, cutting payback to 6 months, without spending a cent more on ads.
Two rules keep the number honest. Use gross profit, not revenue, because revenue you hand back to suppliers, shippers, and payment processors never repays anything. And use fully loaded CAC: total sales and marketing cost, including agency fees, creative, and tools, divided by new customers, not just media spend. A payback figure built on revenue and media-only CAC will always flatter you, and the flattery is expensive because it hides the month your cash is actually free again.
What is a good CAC payback period? 2026 benchmarks
The health thresholds are simple, and they are about cash, not vanity. Under 6 months is excellent: you recycle capital fast and can self-fund growth. Under 12 is healthy for most DTC. Past 12 months you are effectively financing your customers, which works only with strong retention, generous margins, or a funded balance sheet [move-the-needle, 2026].
The table below shows typical 2026 payback ranges by business model and vertical. Treat them as directional context for sanity-checking your own number, not as targets, because your margin and retention decide what is achievable.
| Business model / vertical | Typical payback (2026) | What drives the speed |
|---|---|---|
| Marketplace | 1 to 3 months | High frequency, low incremental CAC |
| Subscription | 3 to 9 months | Recurring revenue, retention |
| Pure DTC (blended) | 3 to 6 ideal, 6 to 12 realistic | Margin and repeat rate |
| Food and beverage | 1 to 3 months | Very high purchase frequency |
| Beauty and cosmetics | 2 to 4 months | Replenishment frequency |
| Supplements | 3 to 6 months | Subscription retention |
| Fashion and apparel | 3 to 6 months | Customer lifespan |
| Electronics | 6 to 12+ months | Low frequency, thin margin |
The pattern in the table is the lesson: speed tracks frequency. Categories people buy often, food, beverage, beauty, recoup in weeks; categories people buy rarely, electronics, take a year or more. That is not a coincidence you can wish away, but frequency is a lever you can pull, which is where the retention argument begins.
Why has CAC payback gotten harder?
Customer acquisition cost has climbed relentlessly: from around $9 in 2013 to $29 in 2022, and to an average of $68 to $84 per customer in 2026, an increase of roughly 40 percent since 2023 alone [ringly.io, 2026]. Three forces drive it: ad auctions crowded with more brands, the loss of deterministic tracking after iOS privacy changes, and rising creative costs as platforms reward volume.
The arithmetic is unforgiving. Payback is CAC divided by monthly contribution, so when CAC rises 40 percent and contribution holds flat, payback rises 40 percent too. A brand that recouped in 7 months in 2023 is looking at nearly 10 today on identical retention. The only durable defense is to raise the denominator, and email remains the cheapest acquisition channel at $8 to $15 per customer, far below paid social, which is why owned channels and repeat purchases have become the center of the payback conversation rather than a nice-to-have [ringly.io, 2026].
Why does CAC payback speed cap growth?
Here is the mental model that reframes the whole metric: velocity of money. In economics, the same currency can fund many transactions if it changes hands quickly; a dollar that circulates four times does the work of four dollars. Your acquisition budget behaves exactly the same way. A brand that recoups CAC in 3 months gets that dollar back and redeploys it into the next customer roughly four times a year. A brand that takes 12 months redeploys it once.
The consequence is stark. Give both brands the same $100,000 in starting acquisition capital and the same unit economics, and the fast-payback brand deploys $400,000 of acquisition over the year while the slow one deploys $100,000, purely because of recycling speed. Neither borrowed a cent. This is why payback, not the LTV to CAC ratio, is the metric that governs how fast you can grow without raising outside capital: the ratio tells you the trip is worth taking, but velocity tells you how many trips you can make.
See which cohorts recoup fast enough to reinvest, and which quietly tie up your cash.
Learn more about Customer Intelligence in Nexus →Which four levers shorten CAC payback, and why is retention cheapest?
Because payback is CAC divided by monthly gross-profit contribution, you shorten it by shrinking the numerator or growing the denominator. There are exactly four ways:
-
Raise average order valueUse bundles, curated kits, and free-shipping thresholds set just above your current AOV to lift each order without acquiring anyone new. Higher AOV raises monthly contribution directly.
-
Increase purchase frequencyDesign the second and third purchase deliberately, with well-timed replenishment and lifecycle flows. Frequency is the single fastest input to monthly contribution, as the worked example showed: doubling it halved payback.
-
Lift gross marginNegotiate cost of goods, trim discount depth, and steer demand toward higher-margin lines. Every margin point flows straight into the contribution that repays CAC.
-
Lower acquisition costShift spend toward owned channels like email at $8 to $15 per customer, and improve conversion so the same traffic yields more customers. Real, but it fights a market where CAC keeps climbing.
Retention is the lever that quietly powers two of the four, because it raises both frequency and lifespan at once. The math is decisive: acquire a customer for $70 and they buy once, and acquisition costs $70 per order; get them to three orders and the effective cost falls to about $23 per order on the same spend [zipchat, 2026]. This is the loyalty effect that Bain and Company quantified, that a 5 percent increase in retention can raise profits by 25 to 95 percent. Retention does not just improve payback; it is the cheapest lever you have, because you already paid to acquire the customer once.
In our Customer Value Optimization work with ecommerce brands through 2026, we consistently see the second purchase, not the first, decide whether acquisition ever pays back, because a one-and-done customer strands the entire acquisition cost on a single thin-margin order [Omniconvert, 2026].
Where do most DTC brands measure CAC payback wrong?
A wrong payback number is worse than none, because it drives confident bad decisions about how hard to scale. The errors that recur:
- Revenue instead of gross profit: Revenue-based payback ignores cost of goods and makes recovery look twice as fast as it is. Only margin repays CAC, so always use gross profit.
- Blended instead of cohort: A single blended payback averages your fast-recouping repeat buyers with your slow one-and-done customers, hiding which acquisition actually works. Group customers by acquisition month and track each cohort's cumulative contribution.
- Media-only CAC: Leaving out agency fees, creative, and tools understates the numerator. Use fully loaded sales and marketing cost per new customer.
- Ignoring the working-capital clock: A payback past 180 days can quietly starve a growing brand of cash even when the LTV to CAC ratio looks healthy. Watch the months, not just the ratio.
The community of brands that plateau at a 6 to 12 month blended payback almost always share one pattern: they optimize the acquisition cost of the first order and never engineer the second, so payback stays hostage to a single transaction. The gap closes fastest when operators treat repeat-purchase rate as the primary unit of measurement, not cost per acquisition, because frequency is the input that moves payback most and the one cheapest to influence.
AliveCor used Omniconvert to run a structured A/B testing programme and achieved a 21 percent lift in conversion rate, a 5 percent increase in revenue per visitor, and 94 percent statistical relevance across their experiments [Omniconvert, AliveCor case study]. Converting more of the traffic you already pay for lowers effective CAC and lifts revenue per visitor at once, which pulls the payback clock forward from both directions.
How do you make retention repay acquisition?
Knowing your payback period is not the same as shortening it. The brands that pull it in treat it as a loop rather than a quarterly report: they measure payback per cohort, segment customers by how quickly each recoups, predict which new customers are drifting toward one-and-done, and act on the second-purchase and retention moves that raise frequency before the cohort goes cold.
This is the Customer Value Optimization approach applied to the payback clock, and it is exactly what Nexus by Omniconvert automates. Nexus ingests behavioral and transactional data across your store, calculates payback on gross profit by cohort and segment, and flags which segments recoup fast and which never will. It then maps those segments to predicted lifetime value and ranks the retention and second-purchase actions that shorten payback most, so marketing budget recycles into the customers who actually pay it back rather than the ones who are simply cheapest to reach.
CAC payback period FAQ
Under 6 months is excellent and under 12 months is healthy for most direct-to-consumer brands. Beyond 12 months you need exceptional retention, fat margins, or outside capital to survive, because working capital is tied up in customers who have not yet paid you back. Benchmarks vary by model: marketplaces recoup in 1 to 3 months, subscription in 3 to 9, and pure DTC in 3 to 6 ideally, 6 to 12 realistically.
Divide customer acquisition cost by the monthly gross-profit contribution per customer: CAC divided by (average order value times gross margin percentage times annual order frequency, divided by 12). Use gross profit, not revenue, because revenue you cannot keep does not repay anything. For example, an $80 order at 50 percent margin bought 1.5 times a year contributes about $5 of gross profit a month, so a $60 CAC takes roughly 12 months to recoup.
LTV to CAC is a static ratio that tells you whether a customer is worth more than they cost; CAC payback period adds time, telling you how fast you recoup the cost and can reinvest it. Two brands with an identical 3 to 1 ratio can grow at very different speeds because one recoups in 3 months and recycles its ad dollar four times a year, while the other recoups in 12 and recycles it once.
Ecommerce customer acquisition cost has risen roughly 40 percent since 2023, driven by ad-platform inflation, the loss of iOS tracking signal, and more brands competing for the same attention. When it costs more to acquire the same customer, more gross profit is needed to break even, so payback stretches out. The average acquisition cost now sits around $68 to $84 per customer, up from about $9 a decade ago.
Four levers shorten it: raise average order value with bundles and free-shipping thresholds, increase purchase frequency, lift gross margin, or lower acquisition cost. Retention, which drives frequency and lifespan, is usually the cheapest, because a customer who buys three times instead of once spreads the same acquisition cost across more gross profit. Spending $70 to acquire a customer costs $70 per order at one order and about $23 per order at three.
Cohort. Blended averages combine channels, campaigns, and customer segments that pay back at very different speeds, hiding which acquisition actually recoups and when. Group customers by the month they were acquired and track each cohort's cumulative gross profit against its acquisition cost. Cohort payback shows whether newer customers are getting more or less profitable, which a single blended number completely conceals.
Nexus by Omniconvert ingests behavioral and transactional data across your store to calculate payback by cohort and segment, using gross profit rather than revenue, and flags which segments recoup fast and which never do. It then maps those segments to predicted lifetime value and ranks the retention and second-purchase actions that shorten payback, so marketing budget recycles into the customers who actually pay it back.
Calculate one number this week: your CAC payback period, on gross profit and by cohort, not blended revenue. If it is under 6 months, you can reinvest aggressively and compound. If it sits past 12, the problem is almost never traffic; it is retention and margin, and more ad spend only ties up more cash in customers who have not repaid you. Payback is the metric that decides whether scaling your acquisition compounds or bleeds, because it measures how fast the same marketing dollar comes back to be spent again. Shorten it by making retention repay acquisition, and growth stops depending on outside capital.
See your CAC payback by cohort and shorten it with Nexus
Nexus by Omniconvert calculates payback on gross profit by cohort and segment, flags which acquisition recoups and which never does, and ranks the retention and second-purchase actions that recycle your marketing dollar faster. Stop watching a blended number and start acting on the segments that pay you back.