10 Customer Retention Metrics for Business Growth
Article last updated:
Article first published:
- The 10 Customer Retention…
- 8. Time Between Purchases
- What is Customer Retentio…
- What is the Importance of…
- How to Measure Customer R…
- How to Reduce Churn Rate?
- Is Revenue Rate and Churn…
- How can Time Between Purc…
- What does the Product Ret…
- Does High Product Return…
- How can CRO improve Custo…
- What is the Difference be…
The 10 Customer Retention Metrics provide valuable insights into a business’s health and long-term sustainability. The 10 metrics guide strategies for improving customer retention, helping ensure consistent growth and profitability.
Customer retention is the ability of a business to keep its customers over a specific period. It focuses on delivering value and satisfaction to encourage loyalty and prevent customers from switching to competitors. Effective retention strategies help build long-lasting relationships and ensure steady revenue streams.
Maintaining existing customers is more cost-effective than acquiring new ones. Loyal customers make repeat purchases, contribute to a higher average order value (AOV), and act as brand advocates. Focusing on customer retention metrics helps businesses improve their offerings, build trust, and boost long-term profitability.
Tracking and analyzing the right metrics allows businesses to assess customer retention performance. These metrics provide valuable insights into customer satisfaction, loyalty, and purchasing behaviors. The retention rate and other related indicators reveal areas for improvement and help align business strategies with customer expectations.
The retention rate formula measures the percentage of customers retained over a period. The formula is shown below.
Retention Rate = ( Customers at Start of Period Customers at End of Period − New Customers ) × 100
A higher retention rate indicates effective retention strategies.
The 10 Customer Retention Metrics for Business Growth are listed below.
- Net Promoter Score (NPS): Measures customer loyalty by asking how likely customers are to recommend the business to others. Higher scores indicate stronger customer advocacy and satisfaction.
- Churn Rate: The Churn Rate represents the percentage of customers who stop doing business with a company over time. A lower churn rate reflects better user retention.
- Customer Lifetime Value (CLV): Estimates the total revenue a business earns from a customer during their relationship. Higher CLV indicates effective retention strategies and customer loyalty.
- Customer Retention Rate (CRR): Tracks the percentage of customers retained over a specific timeframe. The customer retention rate is crucial for measuring the effectiveness of retention efforts.
- Customer Satisfaction Score (CSAT): Evaluates customer satisfaction through surveys. A higher CSAT indicates customers are happy with products or services.
- Average Order Value (AOV): Calculates the average amount customers spend per transaction. An increasing AOV signals higher customer trust and satisfaction.
- Repeat Purchase Rate (RPR): Measures the proportion of customers making repeat purchases. A high RPR reflects strong user retention.
- Time Between Purchases: Tracks the average time between a customer's purchases. Shorter intervals indicate frequent engagement and stronger loyalty.
- Loyal Customer Rate: Identifies the percentage of customers who make frequent and repeat purchases. A higher rate highlights strong loyalty.
- Days Sales Outstanding (DSO): Monitors the average days to collect customer payment. Lower DSO reflects better financial health and customer reliability.
1. Net Promoter Score
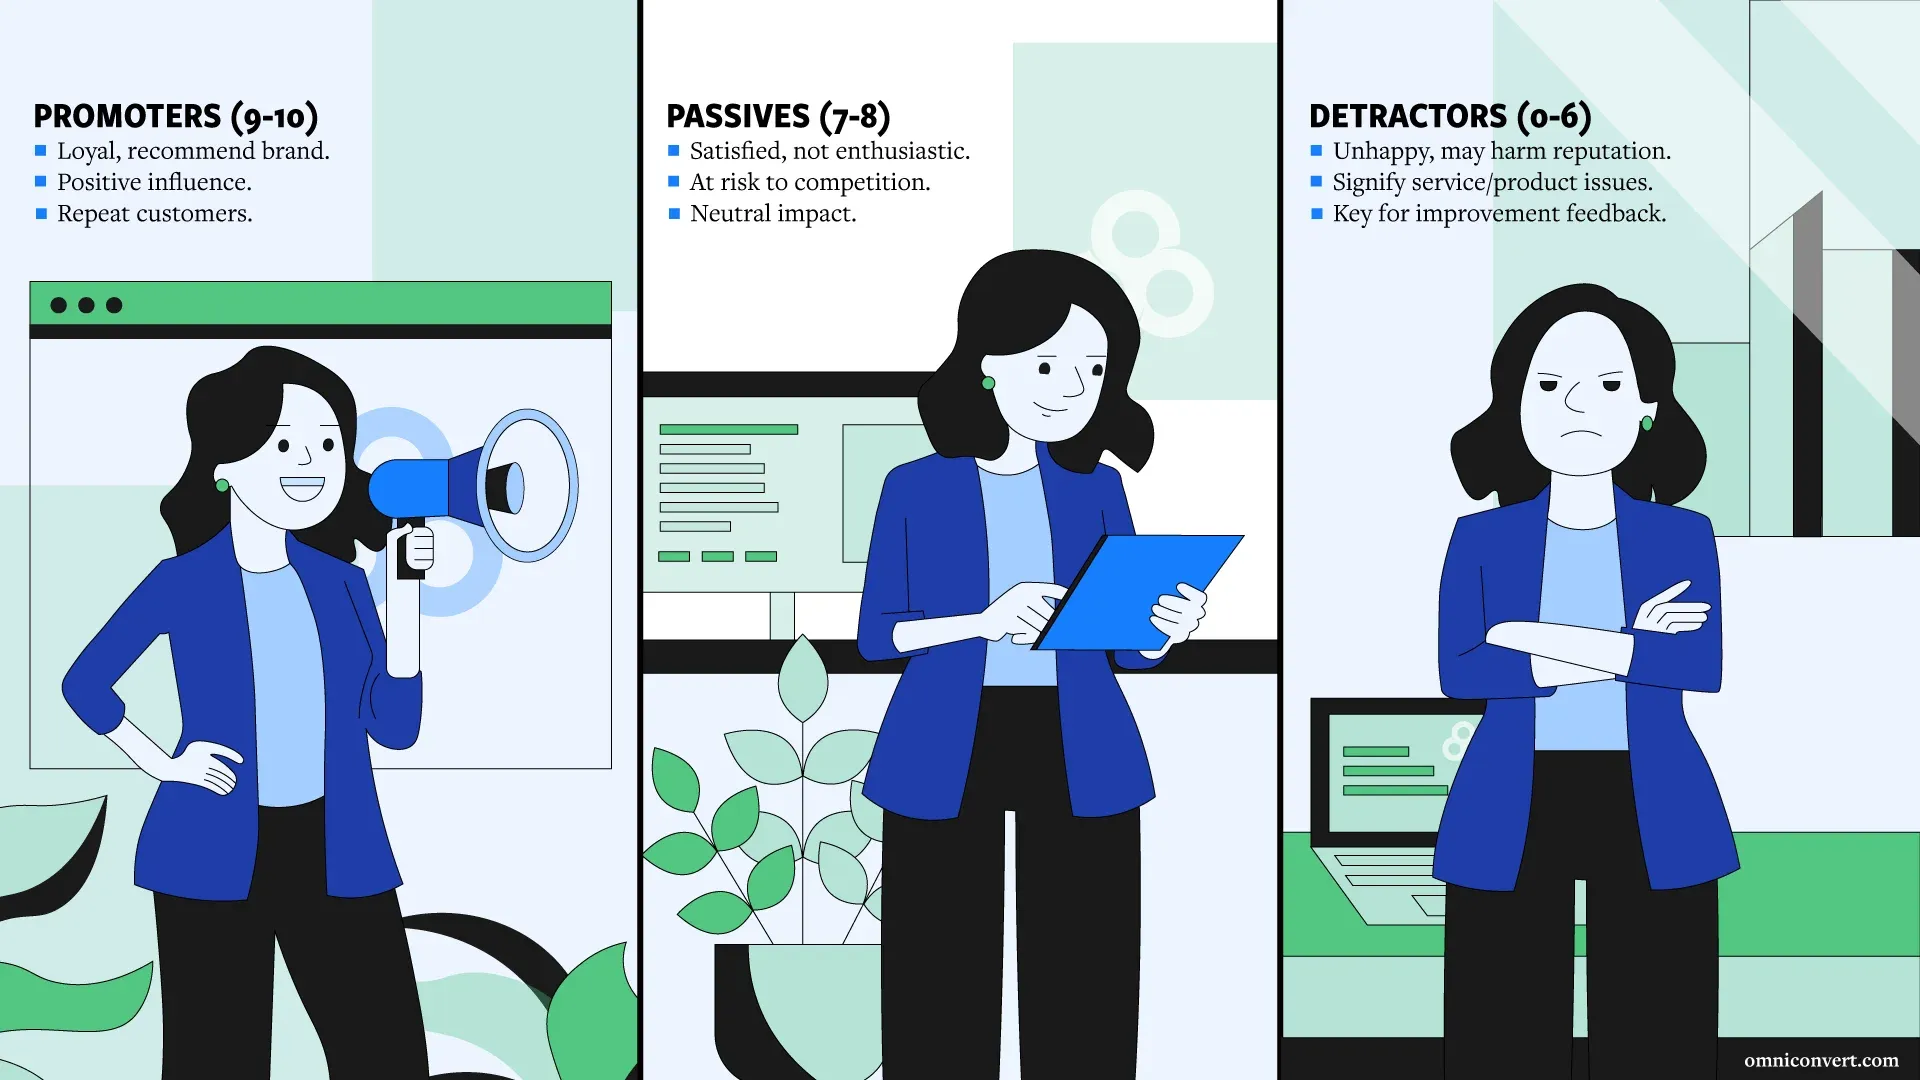
Net Promoter Score (NPS) measures how likely customers are to recommend a business, indicating their loyalty and satisfaction. The NPS survey asks, “On a scale of 0 to 10, how likely are you to recommend this product or service to a friend or colleague?” Customers are categorized as Promoters (scores 9–10), Passives (scores 7–8), or Detractors (scores 0–6) based on their responses.
NPS is important because it links customer sentiment directly to retention. A high NPS score means more Promoters than Detractors, indicating strong loyalty and satisfaction. Loyal customers make repeat purchases, advocate for the brand, and improve retention. A low NPS score highlights dissatisfaction and points to areas that need improvement, allowing businesses to take proactive steps to reduce churn.
The formula for calculating NPS is shown below.
NPS = % Promoters − % Detractors
For example, the percentages are calculated as follows if a survey of 200 customers shows 120 Promoters, 50 Passives, and 30 Detractors. The percentages are calculated as follows.
Promoters = 120 200 × 100 = 60 % Detractors = 30 200 × 100 = 15 % NPS = 60 % − 15 % = 45
An NPS of 45 demonstrates a strong base of loyal customers, but the presence of Detractors indicates room for improvement. Addressing the concerns of Detractors while maintaining Promoter satisfaction leads to an even higher score, enhancing the customer retention rate.
NPS helps improve user retention. Promoters stay loyal, spend more, and bring in new customers through recommendations. Regular monitoring of Net Promoter Score enables businesses to track trends, measure the impact of customer service initiatives, and ensure their strategies align with customer expectations. Improving NPS helps drive long-term business growth by building strong customer relationships and boosting retention.
2. Churn Rate
Churn Rate measures the percentage of customers who stop using a product, service, or subscription during a set period. Churn Rate provides insight into customer loss and shows how well a business retains its customers. High churn rates indicate dissatisfaction or unmet expectations, while low rates suggest effective customer retention strategies.
The churn rate is important because it highlights weaknesses in customer retention efforts. A high churn rate signals poor customer service, lack of product value, or strong competition. Monitoring the metrics helps businesses identify and address these problems, ensuring a better customer experience. Reducing churn directly impacts profitability, as retaining existing customers is more cost-effective than acquiring new ones. A business with a low churn rate enjoys higher user retention and stability.
The formula for calculating the churn rate is shown below.
Churn Rate = ( Customers Lost During a Period Total Customers at the Start of the Period ) × 100
For example, suppose a subscription service begins a month with 1,000 customers and loses 50 customers during the month. The churn rate is calculated as follows.
Churn Rate = 50 1000 × 100 = 5 %
A churn rate of 5% indicates that 5% of the customer base was lost during the period. Businesses lower churn rates by improving their offerings, enhancing customer support, or implementing loyalty programs.
The churn rate is key to understanding customer retention health. A low churn rate leads to a higher retention, directly impacting revenue and growth. Reducing churn helps businesses build stronger customer relationships, increase customer lifetime value (CLV), and create a more stable revenue stream. Regularly analyzing churn rates enables companies to align their strategies with customer needs, fostering long-term loyalty and satisfaction.
3. Customer Lifetime Value (CLV)
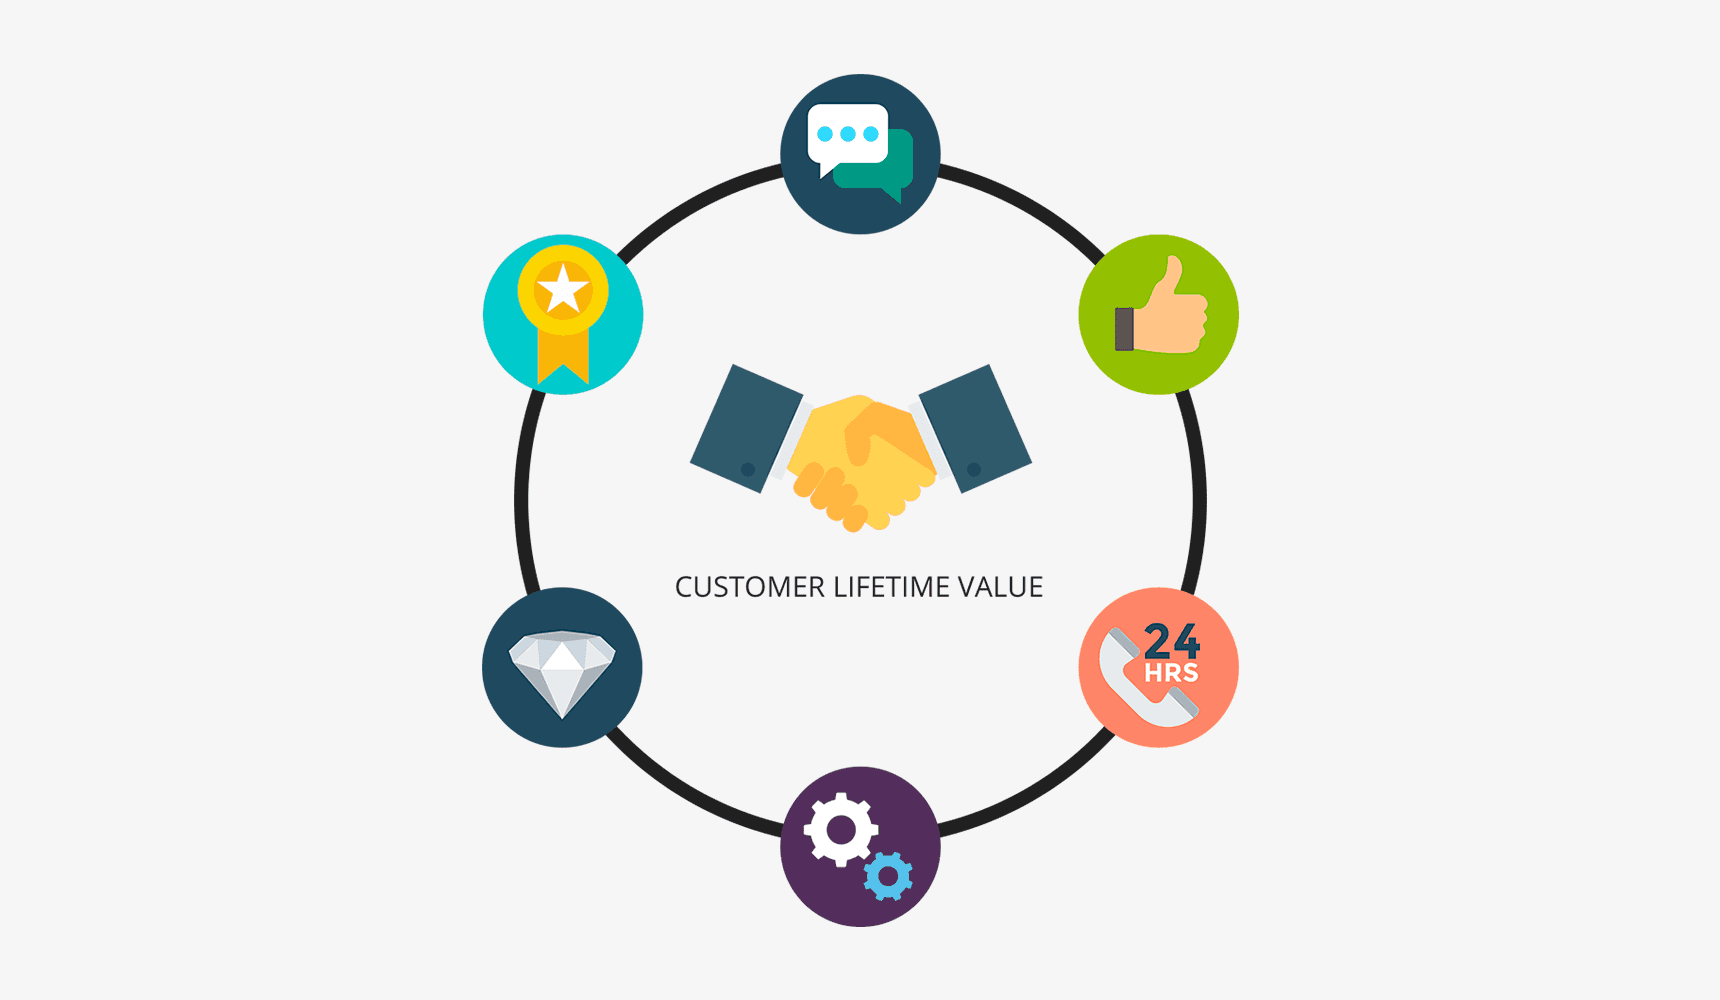
Customer Lifetime Value (CLV) is a metric that estimates the total revenue a business expects from a customer over their entire relationship. CLV considers factors like average purchase value, purchase frequency, and the anticipated length of the customer relationship. It provides a forward-looking view of the financial value each customer brings.
Customer Lifetime Value (CLV) is important because it helps guide decisions around customer retention. Businesses allocate resources to retain high-value customers by understanding their value over time. A higher CLV signals strong loyalty and high retention, while a low CLV points to potential churn risks. Tracking CLV allows businesses to focus on retention strategies that maximize profitability and support long-term growth.
The formula for calculating CLV is shown as follows.
CLV = Average Purchase Value × Purchase Frequency × Customer Lifespan
For example, consider a business where the Average Purchase Value is $50, the Purchase Frequency is 5 purchases per year, and the Customer Lifespan is 3 years. The CLV is calculated as follows.
CLV = 50 × 5 × 3 = 750
Each customer is expected to contribute $750 in revenue over their lifetime with the business. Increasing these factors, such as encouraging frequent purchases or extending the customer lifespan, enhances the Customer Lifetime Value (CLV).
CLV is crucial for measuring customer retention because it highlights the long-term financial impact of keeping customers. Businesses focusing on improving CLV see higher revenues as loyal customers make repeat purchases, refer others, and explore additional products or services. Regularly monitoring and optimizing CLV drives sustainable growth by encouraging customer-centric strategies and personalized experiences. Improving CLV strengthens customer retention, which boosts profitability and provides a competitive edge.
4. Customer Retention Rate (CRR)
Customer Retention Rate (CRR) measures the percentage of customers a business retains over a set period. CRR reflects the effectiveness of retention strategies and provides insights into customer loyalty and satisfaction. A high CRR signals strong customer engagement, while a low CRR points to areas that need improvement to reduce churn.
Customer Retention Rate (CRR) is important because it directly assesses customer retention efforts. Businesses with a high CRR enjoy steady revenue, lower acquisition costs, and a higher customer lifetime value (CLV). Tracking CRR helps companies understand customer behavior, address pain points, and implement strategies to build long-term relationships.
The formula for calculating CRR is shown below.
CRR = ( Customers at Start of Period Customers at End of Period − New Customers Acquired During Period ) × 100
For example, a company starts the quarter with 1,000 customers, gains 200 new customers, and ends with 1,050 customers, and the CRR is calculated as shown below.
CRR = ( 1050 − 200 1000 ) × 100 = ( 850 1000 ) × 100 = 85 %
A Customer Retention Rate (CRR) of 85% means the business retained 85% of its customers during the period. Maintaining or improving the percentage is key for sustained growth. CRR is a critical metric because it shows the success of retention strategies over time. A high CRR ensures a stable customer base and boosts financial performance by reducing churn and increasing repeat purchases. Businesses build loyalty, trust, and a foundation for long-term profitability by focusing on increasing CRR. Regularly analyzing CRR helps fine-tune retention efforts and align them with customer expectations, driving long-term success.
5. Customer Satisfaction Score (CSAT)
Customer Satisfaction Score (CSAT) measures customer satisfaction with a specific product, service, or interaction. CSAT is gathered through surveys where customers rate their satisfaction on a scale from 1 to 5 or 1 to 10, with higher scores indicating greater satisfaction. The CSAT score reflects how well a business meets or exceeds customer expectations during experiences such as after a purchase or support interaction.
Customer Satisfaction Score (CSAT) is crucial for measuring customer retention because it provides immediate feedback on customer perception. A high CSAT score indicates satisfied customers, leading to increased loyalty, repeat purchases, and a higher retention rate. A low CSAT score highlights issues in the customer experience, prompting businesses to take corrective actions before customers decide to leave or stop buying.
The formula for calculating CSAT is shown below.
CSAT = ( Total Number of Respondents Number of Satisfied Customers ) × 100
For example, a company surveys 200 customers after a service interaction and receives 150 responses with a satisfaction rating of 4 or 5 (on a scale of 1–5), and the CSAT is calculated as shown below.
CSAT = ( 150 200 ) × 100 = ( 150 200 ) × 100 = 75 %
A Customer Satisfaction Score (CSAT) score of 75% means that 75% of customers were satisfied with the interaction, while 25% were dissatisfied or neutral. Tracking CSAT scores allows businesses to identify strengths and weaknesses in their offerings.
A consistently high CSAT score signals customers are happy, reducing churn and encouraging repeat business. They improve the customer experience, enhance retention rates, and increase customer lifetime value (CLV) when businesses address areas of dissatisfaction. Businesses build stronger relationships, improve retention, and sustain long-term growth by regularly measuring and responding to CSAT feedback.
6. Average Order Value (AOV)
Average Order Value (AOV) calculates the average amount a customer spends per transaction. AOV is an essential metric for understanding customer spending habits and assessing the effectiveness of marketing and sales strategies in driving revenue. AOV helps businesses evaluate the financial impact of each sale and provides insights into customer behavior, including the success of cross-selling, upselling, and promotional efforts.
A higher AOV means customers are making larger, more frequent purchases, reflecting the success of retention strategies. Businesses increase revenue without the high costs of acquiring new customers by focusing on encouraging customers to spend more per transaction. AOV is a useful indicator of the success of loyalty programs or special offers to boost repeat purchases.
The formula for calculating AOV is shown below.
AOV = Number of Orders Total Revenue
For example, a business generates $10,000 in revenue from 200 orders, and the AOV is calculated below.
AOV = 10000 200 = 50
The average order value (AOV) for the business is $50. The business boosts revenue by increasing the AOV through bundle offers, product recommendations, or loyalty rewards.
7. Repeat Purchase Rate (RPR)
Repeat Purchase Rate (RPR) measures the percentage of customers who make more than one purchase within a set period. RPR reflects customer loyalty and satisfaction, showing how many return for additional transactions after their initial purchase. The metric is crucial for businesses relying on recurring revenue, such as subscription services, e-commerce stores, and retailers.
Repeat Purchase Rate (RPR) is crucial for measuring customer retention because it shows how well a business maintains loyalty and encourages repeat purchases. A high RPR indicates that customers are happy with their experience and are willing to return, signaling effective retention strategies. A low RPR suggests problems with product satisfaction, customer experience, or the value proposition, which can hurt retention.
The formula for calculating the Repeat Purchase Rate is shown below.
RPR = ( Total Number of Customers Number of Customers Who Made More Than One Purchase ) × 100
For example, a business has 1,000 customers, and 400 of them made at least one repeat purchase, and the RPR is calculated as shown below.
RPR = ( 1000 400 ) × 100 = 40 %
40% of the customers made more than one purchase, indicating a reasonable level of customer retention. Increasing the Repeat Purchase Rate (RPR) through strategies like loyalty programs, personalized offers, or enhanced customer service significantly improves customer retention rates and overall business profitability.
8. Time Between Purchases
Time Between Purchases measures the average time between two purchases made by the same customer. The metrics track how customers return for additional purchases, offering insight into their engagement and loyalty. Time Between Purchases is valuable for businesses that rely on repeat business, such as retailers or subscription-based services, as it helps identify customer behavior patterns and assess retention efforts.
Time Between Purchases is important for measuring customer retention because it shows how customers engage with the business. Shorter times between purchases suggest that customers are highly engaged, satisfied, and become loyal, long-term buyers. Longer gaps between purchases indicate declining interest or satisfaction, possibly due to poor customer experience, competition, or product fatigue. Understanding and optimizing this metric helps businesses improve retention strategies, enhance customer experience, and encourage frequent buying.
The formula for calculating the Time Between Purchases is shown below.
Time Between Purchases = Total Time Period Number of Repeat Purchases
For example, the time between purchases is 2 months if a customer makes their first purchase on January 1st and their second purchase on March 1st. The business analyzes customer behavior to optimize purchase frequency if 100 customers made 200 purchases over a year, and the average time between each purchase was 4 months.
9. Loyal Customer Rate
Loyal Customer Rate measures the percentage of customers who make repeat purchases over a specific period. The metric shows how well a business retains and engages customers. Loyal customers regularly return and consistently support the brand, making multiple purchases. The Loyal Customer Rate helps businesses understand customer retention performance, especially in competitive markets.
The Loyal Customer Rate is important for measuring customer retention because it shows how many customers are loyal rather than occasional buyers. A high rate indicates that customers are satisfied and continue purchasing, recommend the brand to others, and drive revenue growth. A lower rate suggests improving offerings, customer experience, or engagement strategies.
The formula for calculating the Loyal Customer Rate is shown below.
Loyal Customer Rate = ( Total Number of Customers Number of Loyal Customers ) × 100
For example, a business has 1,000 customers, and 250 make purchases regularly or at least thrice within a year. The Loyal Customer Rate is calculated below.
Loyal Customer Rate = ( 1000 250 ) × 100 = 25 %
25% of the customer base is considered loyal, having demonstrated a pattern of repeated engagement with the business. Increasing the Loyal Customer Rate involves implementing strategies that enhance customer satisfaction, such as loyalty programs, personalized experiences, or exceptional customer service.
Loyal customers contribute to lower churn rates and higher customer lifetime value (CLV). They make repeat purchases and act as brand advocates, driving long-term profitability. Monitoring loyalty levels helps businesses identify trends, track retention efforts, and improve customer retention strategies.
10. Days Sales Outstanding
Days Sales Outstanding (DSO) measures how long a business collects payment after a sale. The metric is used by businesses that offer credit terms, such as B2B companies, to track the efficiency of their receivables process. A low DSO means payments are collected quickly, while a high DSO indicates delays, harming cash flow and financial stability.
DSO is important for measuring customer retention because it reflects payment behavior and relationship management. Efficient collections and prompt payments show that customers are satisfied and engaged. A high DSO indicates dissatisfaction, potentially hurting retention. Businesses with a low DSO are better positioned financially to invest in customer service and retention strategies.
The formula for calculating DSO is shown below.
DSO = ( Total Credit Sales Accounts Receivable </mfrac ) × Number of Days in Period
For example, a business has $100,000 in accounts receivable, total credit sales of $500,000, and operates over 30 days. The DSO is calculated as shown below.
DSO = ( 500000 100000 ) × 30 = 6 days
Days Sales Outstanding (DSO) takes 6 days for the business to collect payments after a sale on average. A higher DSO indicates a longer collection period, which raises concerns regarding cash flow and customer satisfaction.
What is Customer Retention?
Customer Retention is the process of keeping customers engaged and satisfied over time. Customer Retention involves strategies to maintain loyalty, reduce churn, and encourage repeat purchases. Retaining customers is more cost-effective than acquiring new ones. Effective customer retention supports long-term business success and sustainability.
Customer retention fosters long-term relationships that benefit the customer and the business. It involves creating positive experiences, offering exceptional service, and delivering personalized value. Businesses implement loyalty programs or tailored offers to encourage customers to stay engaged and make repeat purchases.
Strong customer retention strategies increase customer lifetime value (CLV), increasing revenue over time. High retention rates lead to more referrals, as satisfied customers recommend the business to others. Word-of-mouth marketing helps attract new customers without high acquisition costs.
Customer retention is essential for sustainable business growth. Retaining customers builds a stable revenue base, reduces marketing expenses, and strengthens a company’s competitive edge. Businesses achieve higher satisfaction, greater loyalty, and better long-term returns by consistently improving retention.
What is the Importance of Customer Retention?
Customer retention is important because it reduces acquisition costs, increases lifetime customer value, enhances brand loyalty, and drives sustainable revenue growth by fostering long-term relationships with existing customers. Businesses reduce acquisition costs by focusing on customer retention, which improves the return on investment for marketing and sales efforts.
Customer retention boosts lifetime customer value (CLV), increasing revenue without constantly seeking new customers. Loyal customers make repeat purchases, upgrade to higher-value products, and engage in upselling or cross-selling. The steady, predictable revenue stream enhances financial stability and gives businesses a clearer picture of their long-term growth potential.
Customer retention strengthens brand loyalty. Loyal customers contribute revenue through repeat purchases and promote the brand to others, fueling organic growth. Loyalty reduces the impact of competitors and helps establish a strong market presence. A loyal customer base leads to higher retention rates, driving sustained growth and ongoing satisfaction.
Customer retention drives sustainable revenue growth by building long-term customer relationships. Businesses keep customers loyal over time by understanding customer needs, delivering exceptional service, and providing ongoing value. The approach creates a stable revenue base, helping companies navigate market changes and maintain a strong position for future growth.
Prioritizing customer retention helps businesses reduce acquisition costs, boost lifetime customer value, strengthen brand loyalty, and achieve sustainable growth. Focusing on keeping existing customers satisfied creates a foundation for long-term success and resilience.
How to Measure Customer Retention?
To measure customer retention, there are three steps to follow. First, choose the metrics that align with business goals. Customer retention can be measured using the formula: Customer Retention Rate (CRR) = [(Ending Customers - New Customers) / Beginning Customers] x 100. The CRR formula provides a clear percentage of customers retained over a specific time period. Repeat purchase rate, which tracks how often customers return to buy again, and churn rate, which shows how many customers have stopped engaging, are other important metrics.
Second, define the timeframe for analysis. Retention metrics are measured monthly, quarterly, or annually, depending on the business model. For example, a subscription service calculates CRR monthly to track ongoing loyalty, while a retail business might review it quarterly to identify seasonal trends.
Lastly, analyze the results and look for patterns. It indicates strong customer satisfaction and loyalty if the CRR is consistently high. It points to issues such as product dissatisfaction or poor customer service if the churn rate is rising. Identifying these patterns helps guide improvements to the retention strategy, such as enhancing customer support, offering loyalty programs, or personalizing the customer experience.
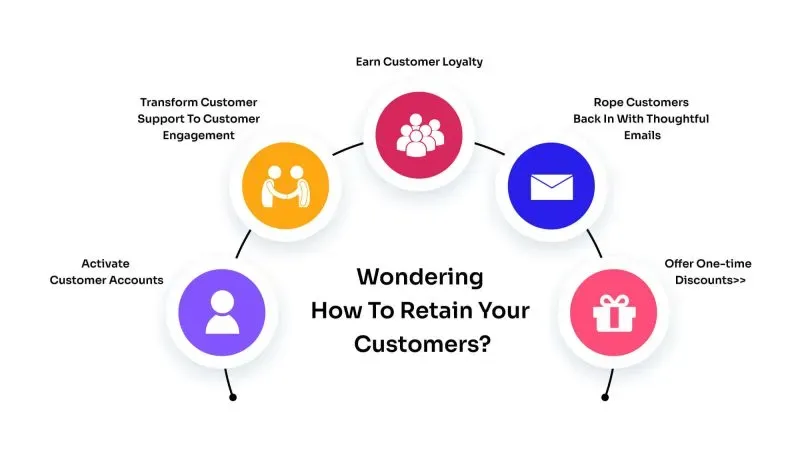
How to Reduce Churn Rate?
To reduce churn rate, enhance customer engagement through personalized communication, improve product/service quality, and implement proactive customer support.
First, personalized communication helps keep customers engaged. Tailoring messages based on individual preferences, purchase history, or browsing behavior shows customers that their needs are understood. For example, sending a personalized thank-you email after a purchase or offering customized product recommendations makes customers feel valued and stay.
Second, improving the quality of the product or service significantly reduces churn. Regularly gathering customer feedback and acting on it ensures that the offerings meet or exceed expectations. For instance, customers highlight a recurring issue and addressing it promptly demonstrates that the business is committed to providing a positive experience.
Lastly, proactive customer support helps catch issues before they lead to churn. Reaching out to customers who show dissatisfaction, such as customers with repeated complaints or long inactivity periods, helps resolve problems early. Offering loyalty programs or exclusive benefits also encourages customers to remain loyal over time.
Is Revenue Rate and Churn Rate the same?
No, revenue rate and churn rate are not the same. The revenue rate measures the money a business generates, while the churn rate measures the percentage of customers who leave.
The revenue rate reflects income over a specific period. It indicates the effectiveness of sales, pricing, and customer spending. A stable or increasing revenue rate shows strong financial performance and growth potential.
The churn rate focuses on customer loss. It shows how many customers stop using a product or service within a given timeframe. A high churn rate indicates dissatisfaction or disengagement, leading to lost revenue if not addressed.
How can Time Between Purchases Reveal Customer Patterns?
Time Between Purchases reveals customer engagement and loyalty patterns. Shorter intervals indicate frequent engagement, while longer intervals suggest seasonal or occasional purchases, guiding personalized marketing and retention efforts. Shorter intervals indicate frequent purchases, suggesting high satisfaction and loyalty, while longer intervals highlight occasional or seasonal buying habits.
For example, a customer who buys groceries every week demonstrates predictable engagement, allowing businesses to retain them through loyalty programs or personalized promotions. A customer who buys winter apparel once a year reflects seasonal patterns, prompting companies to target marketing efforts during specific seasons to remain relevant.
The metric helps identify potential churn risks. For example, the metric signals dissatisfaction if purchasing intervals start to lengthen. Businesses respond with re-engagement campaigns, special offers, or improvements to the customer experience.
Businesses adjust marketing, inventory planning, and retention strategies to meet customer needs by understanding these patterns. Regularly analyzing Time Between Purchases helps improve customer satisfaction, increase loyalty, and drive profitability.
What does the Product Return Rate Indicate?
The Product Return Rate indicates the percentage of products returned by customers, reflecting product quality, customer satisfaction, and alignment between customer expectations and product performance. The metric serves as a critical indicator of how well a product meets customer needs and whether issues need to be addressed to improve satisfaction and retention.
A high product return rate signals dissatisfaction, which results from poor quality, incorrect descriptions, or unmet expectations. For example, it indicates a need for better size guides or quality control if customers return clothing items due to sizing issues. High return rates harm customer trust and loyalty, reducing retention and damaging the brand’s reputation.
A low return rate suggests that products meet or exceed customer expectations. It indicates that the business consistently delivers quality and value. Low return rates boost customer confidence and satisfaction, encouraging repeat purchases and fostering loyalty. Businesses with consistently low return rates build stronger relationships and lower costs associated with returns.
Analyzing return rates helps identify trends and issues. For example, it points to design flaws, inaccurate descriptions, or misleading marketing if one product category has higher returns than others. Businesses reduce return rates and enhance customer satisfaction by addressing these problems.
Return rates highlight logistical or operational challenges. For instance, products damaged during shipping contribute to returns but do not reflect product quality. Businesses minimize these returns and improve the experience by refining packaging, shipping processes, and customer service.
Regularly monitoring the return rate gives businesses a clearer picture of customer needs and expectations. The data helps them improve product quality, refine descriptions, and strengthen customer service, resulting in higher satisfaction, lower costs, and stronger customer retention.
Does High Product Return Rate impact Customer Retention?
Yes, a high product return rate negatively impacts customer retention by indicating dissatisfaction, leading to decreased loyalty and trust in the brand. A high product return rate reflects unmet expectations, poor quality, or misalignment between product descriptions and actual performance when customers frequently return products. Experiences frustrate customers and reduce their confidence in the business, making them less likely to make repeat purchases.
A high return rate erodes trust in a brand. Customers see the company as unreliable, reducing their willingness to make future purchases when products fail to meet expectations. For example, customers feel misled and less likely to remain loyal if a product’s description is inaccurate.
Frequent returns inconvenience customers. Having to return items due to poor quality, incorrect sizing, or damage requires time and effort, leading to frustration. Customers facing these hassles switch to more dependable brands that offer a smoother shopping experience.
A high return rate increases operational costs. Processing returns, handling refunds, and restocking inventory strain resources. These expenses limit the company’s ability to invest in improvements such as enhancing product quality, streamlining user experiences, or building loyalty programs. The cycle makes it harder to retain customers in the long run.
Addressing a high return rate is critical for improving retention. Businesses achieve it by ensuring accurate product descriptions, enhancing quality control, and providing flexible return policies that create a positive customer experience. These steps help rebuild trust, reduce friction, and encourage long-term loyalty.
How can CRO improve Customer Retention Metrics?
CRO (Conversion Rate Optimization) can improve customer retention metrics by enhancing the user experience, increasing satisfaction, and encouraging repeat engagement. CRO helps ensure that customers find ongoing value by optimizing the customer journey, which fosters loyalty and long-term relationships.
Improving website usability is one way CRO impacts retention. A streamlined, intuitive website allows customers to easily navigate, find products, and complete purchases. Reducing friction points, such as complicated checkout steps or slow-loading pages creates a smoother experience that keeps customers coming back. Their satisfaction increases, directly improving retention rates when customers encounter fewer barriers.
CRO enhances engagement by delivering personalized experiences. Businesses tailor content, offers, and product recommendations through A/B testing and data analysis to meet customer preferences. For example, targeted discounts or personalized landing pages encourage repeat purchases and build loyalty. The level of personalization strengthens the bond between the business and its customers, resulting in improved user retention.
Another benefit of CRO is that it increases the perceived value of products or services. Businesses reassure customers they made the right choice by emphasizing unique selling points, addressing customer pain points, and highlighting benefits. The reinforcement improves conversion rates and solidifies trust and satisfaction, key factors in long-term retention.
CRO reduces churn by identifying and resolving drop-off points in the customer journey. Suppose customers abandon their carts or stop short of completing certain actions. CRO strategies pinpoint the cause and implement solutions, such as clearer calls to action or simplified processes. Resolving these issues makes the experience more engaging, encouraging customers to stay loyal.
CRO strengthens customer retention metrics by delivering a more satisfying, personalized, and seamless experience. Businesses foster stronger relationships, reduce churn, and achieve sustainable growth by improving usability, personalizing interactions, emphasizing value, and addressing friction points. CRO boosts conversions and lays the foundation for lasting customer loyalty.
What is the Difference between CRR and Churn Rate?
The difference between Customer Retention Rate (CRR) and Churn Rate lies in its focus and approach. CRR highlights the percentage of customers retained over a specific period, showcasing the effectiveness of retention strategies and customer loyalty. Churn Rate measures the percentage of customers lost during that same timeframe, drawing attention to potential causes of attrition.
CRR emphasizes success, focusing on customers who remain engaged and satisfied. A high CRR reflects strong customer relationships and effective management. The Churn Rate is a warning metric, indicating dissatisfaction or unmet expectations that lead customers to leave. A high churn rate suggests areas that require improvement to enhance retention.
Customer Retention Rate (CRR) and Churn Rate provide valuable insights but approach retention and loss from different angles. CRR is interpreted as a positive measure of loyalty, while Churn Rate identifies challenges and gaps. Businesses gain a more comprehensive understanding of their customer base by analyzing the metrics, allowing them to develop balanced strategies that reduce churn, build loyalty, and support sustainable growth.


If you liked this article, make it shine on your page :)