Why the Growth-Team Org Chart Is Changing

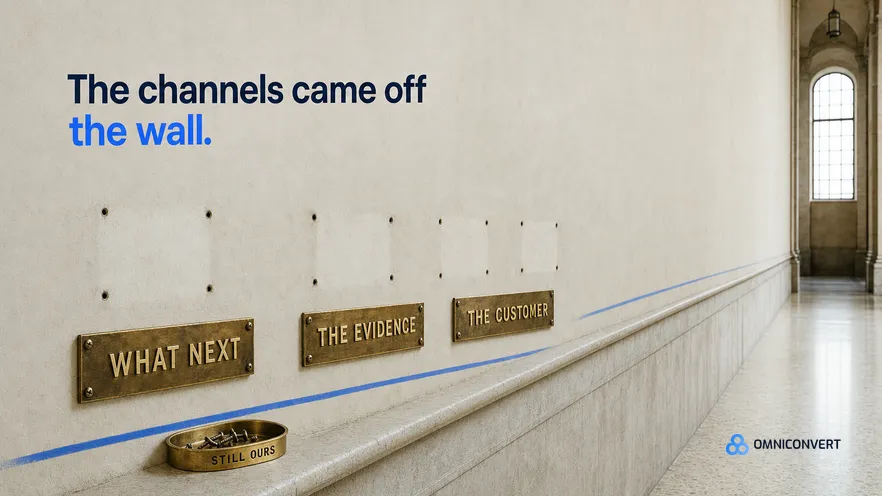
- The chart was built around assembly work: collecting, reconciling and preparing data for a decision somebody else made.
- The Human Middleware Problem is structural, not a performance issue. The bridging work is the job description.
- Three accountabilities survive: what to work on next, the evidence that settles arguments, and the customer relationship.
- Channel execution becomes a capability the team buys or automates, rather than the thing a role is named after.
- Change accountabilities before reporting lines. A reorganisation without new accountabilities reproduces the old chart.
Last updated: October 2026
A growth-team org chart is a description of how coordination work is divided, and for twenty years the coordination work was assembly. Numbers lived inside each channel's own system, so somebody had to go and get them, reconcile the definitions, and prepare them for a decision. Roles were named after channels because channels were where the data was. Omniconvert has worked alongside growth teams across the CROBenchmark dataset of 7,000+ websites in 15+ industries, against 248+ audit criteria, over 13 years in eCommerce, and the most consistent finding about how those teams spend their week is unflattering to the structure: eCommerce managers spend roughly three hours a day assembling data. That is not a productivity problem to be coached away. It is the job the chart was drawn to organise, and when that job compresses the chart stops describing anything useful.
What the growth-team org chart was actually built to optimise
Look at a typical growth organisation and ask what each boundary is for. A paid social specialist, a paid search specialist, an email and lifecycle owner, someone on organic, someone on analytics, perhaps a CRO person. The boundaries follow platforms.
That made sense, and it is worth saying why rather than treating it as an accident. Each platform had its own interface, its own metric definitions, its own quirks about attribution windows and audience logic. Expertise in one did not transfer to another. And critically, the only way to know what was happening in a channel was for a person who understood that channel to go and look.
So the chart solved a real problem: it put a knowledgeable human next to each data source. The cost, which nobody designed and everybody inherited, is that the resulting organisation has no natural owner for anything that crosses channels. Budget allocation across channels, whether a customer acquired on one surface is worth more than on another, which test to run next given finite traffic: each of those questions belongs to everybody and therefore to nobody.
That is the structural weakness the next section names, and the reason the arrangement held so long despite it is simply that the assembly work had to be done by somebody. The fuller argument for treating these as one system rather than a set of channels is in CRO, creative & AI visibility tie into one growth system.
The Human Middleware Problem
I have used the term human middleware for a few years because the alternative framing, that teams are inefficient, sends people looking for the wrong fix.
Consider what the three hours a day actually consists of. Exporting from one platform. Reconciling a metric that is defined differently in two places. Rebuilding a view somebody asked for last month. Chasing a discrepancy between what the ad platform claims and what the store recorded. Assembling the weekly deck. None of that is a judgement, and all of it requires judgement to do correctly, which is why it absorbs senior people rather than junior ones.
The important property of the problem is that it is created by the architecture, not by the people. If your customer data sits in one system, your orders in another, your ad performance in three more and your experiment results in a spreadsheet, then somebody has to be the integration layer. The organisation has implicitly hired humans to do what software should be doing, and then organised itself around those humans.
Which is why the usual responses fail. More headcount adds bridges. Better tooling inside each channel makes each export easier without removing the reconciliation. A new dashboard produces a view everybody distrusts, because the underlying definitions still disagree. The only fix that works is making the systems agree, which is a data problem dressed as an organisational one, and it is the argument for a single source of growth truth.
What changes when assembly stops being the job
This is where the argument gets practical, because the change is not that fewer people are needed. It is that a different thing is scarce.
When numbers arrive assembled and agreed, the week's work becomes the part the assembly was always in service of: deciding what to do next. And the striking thing about that work is how little of it is channel-specific. Deciding whether to spend the next increment on acquisition or on retention is not a paid social question. Deciding which of four plausible explanations for a conversion drop to test first is not an email question. Deciding whether a result is real is a statistics and judgement question.
So the scarce skill shifts from knowing a platform deeply to reasoning about a business under uncertainty, and that skill has no natural channel boundary. A chart that divides people by platform now divides them by something that has stopped being the hard part.
Two second-order effects follow, and both are visible in teams already going through this. The cost of a bad decision rises relative to the cost of execution, because execution got cheap and decisions did not, which argues for putting more senior attention on prioritisation than on production. And the volume of things that could be tried explodes, which makes the ranking problem, rather than the idea problem, the binding constraint on the whole programme.
The shape the new growth-team org chart takes
I want to be careful here, because prescribing a chart is exactly the mistake this article warns against. What follows is not a template. It is the three questions that have to have an owner, and the observation that none of them does on a channel-shaped chart.
The first is what the team works on next. On most teams this is decided by whoever holds budget, which means the answer is a function of last year's allocation rather than of this quarter's opportunity. Somebody has to own it across channels, and the ranking has to be against profit rather than against channel-level efficiency metrics, because a channel can be efficient while the thing it is selling makes no money.
The second is the evidence. Somebody has to own measurement and experimentation such that a disagreement about whether something worked has a settlement procedure. On a channel chart this role is usually called analytics and is positioned as a service function, which is precisely wrong: it needs the standing to decide, not just to report.
The third is the customer relationship end to end, including retention. This is the accountability most often missing entirely, because a channel chart divides a customer into the surfaces they touched. Bain and Reichheld's much-cited finding that a 5% improvement in retention can raise profits by 25% to 95% has been well known for decades, and it keeps going unexploited for a structural reason rather than an informational one: on a channel chart, nobody owns the second purchase.
The table sets out what moves where, and the final column is the useful one, because it names what breaks when the accountability has no owner.
| Accountability | Owner on a channel chart | What breaks without an owner |
|---|---|---|
| What we work on next | Whoever holds the largest budget | Priorities track last year's allocation |
| Whether a result is real | Nobody, or analytics without standing | Arguments are settled by seniority |
| The second purchase | Usually nobody | Retention stays a known unexploited gain |
| Cross-channel budget allocation | Negotiated between channel owners | Allocation defends positions, not returns |
| One agreed set of numbers | Whoever built the last dashboard | Every meeting reopens the definitions |
| Channel execution | Clearly owned, and defended | Rarely the constraint any more |
Read the last row against the others. Channel execution is the only accountability on that list with a clear owner, and it is the one least likely to be the thing limiting the business. That mismatch is the whole argument in one line.
How to get there without a reorganisation
Reorganisations are slow, politically expensive and frequently cosmetic. The useful version of this change does not need one, at least not first.
Start with prioritisation. Name one person accountable for what the team works on next, across channels, and give them a ranking method that is not channel budget. This single change surfaces every disagreement the old structure was suppressing, which is uncomfortable and is the point. Where the ranking needs to be against profit rather than against whichever channel reports the best efficiency, that is what Omniconvert Commander (formerly Nexus) was built to do: it unifies the commerce data, ranks the next experiment by True Profit, and generates campaigns and creative you approve before they go live.
Then move the evidence. Give one owner the authority to decide whether a result counts, and agree the standard in advance. Omniconvert Explore averages a 23.2% conversion uplift across 70,000+ experiments, and the reason a programme produces results like that is rarely the cleverness of the ideas. It is that the team stopped relitigating whether the last one worked. Baymard Institute's checkout research is a useful external anchor here, because its abandonment figure has held near 70% for years while fashions in attribution came and went: the measurements that endure are the ones taken close to the behaviour.
Then name someone accountable for the second purchase. Not a campaign owner, an outcome owner. This is usually the change that produces the largest result in the first year, precisely because it has been nobody's job.
Leave the chart for a quarter after that. By then you will know which of the three accountabilities needed a dedicated person and which could sit with someone already in post, and the structure you draw will describe how the team actually works rather than how somebody hoped it might. The data groundwork that makes any of this possible, one agreed set of numbers, is covered separately in the work on the state of DTC growth in 2026.
Frequently Asked Questions
Because it was designed around a job that is disappearing. Most growth roles were defined by a channel, and a large part of each role was collecting numbers from that channel, reconciling them with everyone else's and preparing them for a decision. When that assembly work compresses, the roles defined by it lose their reason to be separate, and the chart that organised them stops describing anything useful.
The Human Middleware Problem is the pattern where skilled people spend most of their week moving data between systems that do not talk to each other, rather than deciding anything. It is a structural problem rather than a performance one: the roles were created to bridge disconnected tools, so the bridging work is the job description, and no amount of individual capability changes that.
Not necessarily smaller, but differently shaped. The work that compresses is assembly and preparation; the work that expands is deciding what to test, judging which risks are worth taking, and owning outcomes across channels rather than inside one. Teams that shrink headcount and keep the old chart usually end up with fewer people doing the same bridging work.
Three durable roles emerge in place of channel ownership. Someone owns the question of what to work on next, ranked by profit rather than by channel budget. Someone owns the evidence, meaning the measurement and the experiments that settle arguments. And someone owns the customer relationship end to end, including retention. Channel execution becomes a capability the team buys or automates rather than an identity.
Change what people are accountable for before changing who reports to whom. Give one person the prioritisation decision across channels, move the measurement argument to one owner, and make retention somebody's named responsibility. Those three accountability changes reshape how the team works within a quarter, and the formal chart can follow once the new shape has proved itself.
Do not start with a chart. Start by writing down who decides what the team works on next, who settles a disagreement about whether something worked, and who is accountable for whether a customer buys a second time. On most teams the first answer is whoever has budget, the second is nobody, and the third is nobody. Fix those three answers and the structure reshapes itself within a quarter, because accountability is what actually organises work. The chart is a description of that, and redrawing the description first is how reorganisations end up reproducing the arrangement they were meant to replace.
Put profit in charge of the priority list
Omniconvert Commander unifies your commerce data and ranks the next experiment by True Profit, so the question of what to work on next has an answer that is not whoever holds the budget.