Ecommerce Profit and Loss Statement: How to Build Yours

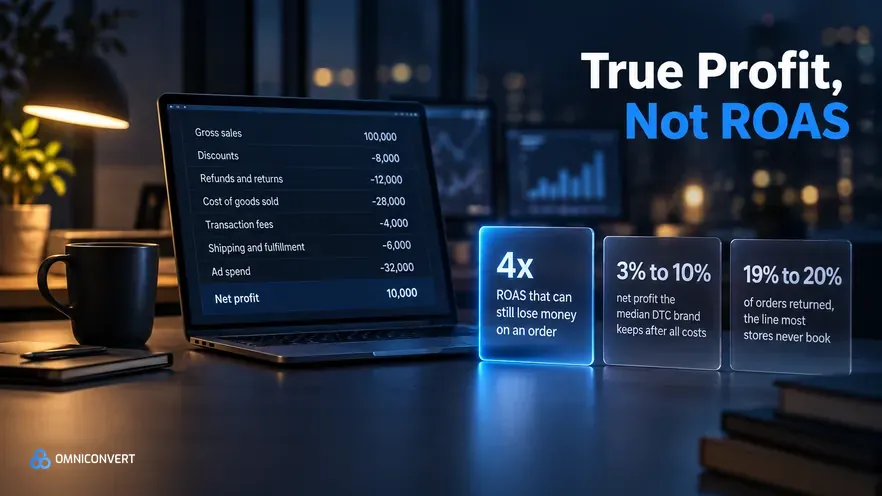
- ROAS reports attributed revenue, not profit; a 4x ROAS can coexist with a real loss once COGS, discounts, refunds and fees are netted against the order.
- Build the P&L bottom-up per order: gross sales, then discounts, refunds, COGS, fees, shipping and ad spend, so contribution margin and net profit stay visible.
- Break-even ROAS equals 1 divided by contribution-margin percentage; add a 15% to 25% buffer, and ad spend belongs in operating expenses, never in COGS.
- The median DTC brand nets just 3% to 10% after all costs even with 50% to 65% gross margins, and returns of 19% to 20% are the line most stores never book.
- True profit only settles across the customer lifetime, so read the per-order P&L beside customer lifetime value and acquisition cost, not in isolation.
An ecommerce profit and loss statement is a financial report that starts at gross sales and subtracts every cost, discounts, refunds, cost of goods, fees, shipping and ad spend, to reveal the profit a store actually kept over a period. It matters because revenue and ROAS both flatter: the average online store nets only about 10% after all costs even while gross margins sit at 50% to 65% [Eightx, 2025]. Across the CROBenchmark dataset of 7,000+ stores in 15+ industries, measured against 248+ audit criteria over 13 years, the operators who caught losing promotions early were the ones reading profit per order rather than blended return [CROBenchmark Report 2026, Omniconvert].
Nexus by Omniconvert is the AI eCommerce growth engine that nets those costs against every order and segment, so you steer by true profit instead of attributed revenue. This guide shows why a store can grow and still lose money, what true profit means, how to build the statement line by line, how to tie ad targets to it with break-even ROAS, and how to read it across the customer lifetime. Every section stands alone and answers its heading directly.
Why can your store grow and still lose money?
Return on ad spend answers one narrow question: for every dollar you gave the ad platform, how many dollars of attributed revenue came back? That is useful, but it is an input, not a verdict. It says nothing about what the product cost to make, the discount that closed the sale, the refund that reversed it, the payment fee, or the box and label that shipped it. A campaign can post a proud 4x return and still hand you a loss.
The worked case is worth internalizing. A $100 product with a 30% contribution margin earns $30 before advertising. If it costs $35 in ad spend to sell that unit, the platform reports a 2.86x ROAS, comfortably "efficient" by most target tables, yet the order loses about $5 [Saras Analytics, 2025]. Multiply that across a scaling campaign and you get the paradox every operator eventually meets: record revenue, thinner bank balance.
This is Goodhart's Law in a marketing dashboard: when a measure becomes a target, it stops being a good measure. The moment a team is paid to hit a ROAS number, the fastest route is a deeper discount, which inflates attributed revenue and quietly destroys contribution margin. The statement exists to keep the target honest, by forcing the discount, the refund and the fee back onto the same order that produced the revenue.
What is a P&L, and what does true profit mean?
A profit and loss statement, also called an income statement, records what a business earned and what it spent over a defined period and reports the difference as profit or loss. In ecommerce the structure is standard, but the discipline that makes it useful is building it bottom-up, per order, so every leak is subtracted before anything is called profit.
True profit is defined as the amount left from a sale after every cost it triggered has been netted against it, from the discount that won it to the ad that sourced it to the overhead that supported it. It matters in ecommerce because the industry's headline metrics, gross revenue and ROAS, both count money that leaves again as refunds, fees and cost of goods, so a store optimized for either can scale itself into a loss.
Contribution margin is defined as the revenue that remains from an order after all of its variable costs are removed, cost of goods plus discounts, refunds, payment and platform fees, shipping and advertising. It matters because it is the number that tells you whether one more order helps or hurts, and it is the figure break-even ROAS is built from. Gross margin, which removes only cost of goods, sits above it and flatters; net profit, which also removes fixed overhead, sits below it and settles the account.
There is a behavioral reason smart operators still get surprised. Mental accounting, the habit of filing money into separate mental buckets, leads founders to bank the sale as "money made" and stash refunds, fees and cost of goods in a different bucket that never gets netted against it. The P&L is the correction: it forces every bucket into one account and reports the single number that survives.
What does the ecommerce P&L look like, line by line?
The order of operations is the whole point. Record gross sales first, never the Shopify or Amazon payout, which already arrives net of fees and refunds and would hide two costs at once. Then subtract in sequence, keeping every subtotal on its own line so you can see exactly where the money goes.
| Line | What it captures | Example on a $100 order |
|---|---|---|
| Gross sales | List price × units, before any deduction | $100.00 |
| − Discounts & promotions | Codes, sitewide sales, first-order offers | −$8.00 |
| = Net sales | What you actually billed | $92.00 |
| − Refunds & returns | Reversed orders plus processing cost | −$7.00 |
| − Cost of goods sold (COGS) | Product cost and inbound handling | −$35.00 |
| = Gross profit | Margin before selling costs | $50.00 |
| − Payment & platform fees | Card, gateway and marketplace fees | −$3.00 |
| − Shipping & fulfillment | Outbound freight, pick, pack | −$9.00 |
| = Contribution margin | What one more order truly adds | $38.00 |
| − Advertising / acquisition | Paid media and CAC | −$28.00 |
| − Fixed overhead (allocated) | Salaries, rent, software, tools | −$7.00 |
| = Net profit | The honest bottom line | $3.00 |
Read the example and the lesson lands: a $100 order with a healthy $50 gross profit still ends at $3 of net profit, a 3% margin, which is squarely where the median direct-to-consumer brand lands after everything [WebMedic, 2025]. The margin is thin not because any single line is unreasonable, but because six of them stack. That is why one hidden line, an unbooked refund rate or ad spend folded into COGS, is enough to flip the whole order red without the top-line ever flinching.
Which four leaks don't show up in ROAS?
ROAS sees revenue and ad spend. It is structurally blind to the costs between them, and those costs are exactly where thin-margin stores bleed out. Four leaks recur:
- Discounts and promotions. A code lifts conversions and attributed revenue, so it improves ROAS while shrinking contribution margin. Booked properly, the discount comes off gross sales before anything else, which is why "we hit our ROAS target" and "the promo lost money" can both be true.
- Refunds and returns. Returns run about 19% to 20% of online orders, and higher, 20% to 40%, in apparel, with each return costing roughly 21% of order value and $10 to $65 to process [Opensend, 2025]. It is the line most stores never book against the order that generated it.
- Payment and platform fees. Card, gateway and marketplace fees skim a few percent off every transaction. Small per order, meaningful across a year, and invisible to ROAS.
- Shipping and fulfillment. Outbound freight, pick and pack, and the "free shipping" you absorb all land here. On a low average order value they alone can erase contribution margin.
The reframe worth keeping is that ROAS is a vanity metric in isolation: large, flattering and decision-useless. Contribution margin per order is the actionable counterpart, the number you can steer by. The four leaks are precisely what separates the two.
Nexus by Omniconvert books discounts, refunds, fees and shipping against every order automatically, so you see contribution margin without rebuilding a spreadsheet each week.
See how it works →How do you go from ROAS to break-even ROAS?
Break-even ROAS is the bridge between the two dashboards. Because contribution margin is the share of each sale left to cover advertising, the return that exactly covers the ad cost is its reciprocal:
- Break-even ROAS = 1 ÷ contribution-margin %. At 40% contribution margin, break-even is 2.5x. At 30%, it is about 3.3x.
- Target ROAS = break-even × (1 + buffer). Add 15% to 25% to fund net profit and fixed overhead [TapMedia, 2025].
| Contribution margin | Break-even ROAS (1 ÷ CM) | Target ROAS (+20% buffer) |
|---|---|---|
| 20% | 5.0x | 6.0x |
| 30% | 3.3x | 4.0x |
| 40% | 2.5x | 3.0x |
| 50% | 2.0x | 2.4x |
| 60% | 1.7x | 2.0x |
The table reframes every "good ROAS" debate. A 3x return is a comfortable profit at 40% margin and an outright loss at 20%. There is no universal target, only the one your own contribution margin dictates, which is why the campaign target has to be derived from the P&L rather than copied from a benchmark. Acquisition pressure makes this urgent: customer acquisition cost rose an estimated 40% to 60% between 2023 and 2025 as Google Shopping CPCs climbed 33.7% and Meta Q4 CPMs hit a record $22.98 [Mobiloud, 2025], which is the single biggest reason ROAS and profit have decoupled.
AliveCor used Omniconvert to run a structured A/B testing programme and achieved a +21% conversion rate, +5% revenue per visitor, and 94% statistical relevance across their experiments [Omniconvert, AliveCor case study]. Gains like these widen contribution margin on every order that follows, which is what lets a store lower its break-even ROAS rather than chase an ever-higher target as acquisition costs climb.
How do you build your P&L once and read it daily?
Accountants close the P&L monthly, and that cadence is right for the books. But the per-order logic underneath it should surface daily, because the questions that actually cost money are daily questions: did yesterday make money after refunds, discounts, cost of goods and ad spend? A monthly statement answers that four weeks too late to save the promotion.
The DTC brands that plateau at a 3% net margin consistently share one pattern: they steer by blended ROAS and never book refunds, fees and discounts against the order that produced them, so the losing campaign keeps running until the month closes. In our CVO work with ecommerce brands, we repeatedly find the benchmark gap closes fastest when operators treat contribution margin per order as the primary unit of measurement, not attributed revenue [Omniconvert, 2026]. Build the statement once with the correct line order, then automate the daily read so the number that changes the decision is in front of you while the decision is still reversible.
How do you measure true profit across the customer lifetime?
The per-order P&L is necessary but not sufficient, because the order is not the whole relationship. A first purchase that loses $5 can be the best money you spend if that customer returns four more times at full margin, and a first purchase that nets $10 can be your worst if the customer never comes back. This is where true profit and customer lifetime value meet: the verdict on an acquisition is a lifetime verdict, not an order-one verdict.
The practical move is to read the P&L per segment and per cohort rather than blended, then judge break-even ROAS against predicted lifetime value, not just the first order's contribution margin. A segment that returns reliably can justify a lower first-order ROAS; a segment of one-time bargain hunters cannot, no matter how efficient the campaign looked. Pair the statement with acquisition cost by segment so the two numbers are always read together. This lifetime view is the edge Customer Intelligence in Nexus by Omniconvert is built for: it maps true profit per order onto predicted lifetime value by segment, so acquisition targets the customers worth keeping.
What common mistakes quietly overstate profit?
A wrong P&L is worse than none, because it drives confident bad decisions. The mistakes that recur:
- Booking payouts as revenue. Shopify and Amazon deposits arrive net of fees and refunds; recording them as sales hides two costs at once. Book gross sales first, then subtract [a2x, 2025].
- Folding ad spend into COGS. Acquisition cost is an operating expense. Put it in COGS and gross margin looks great while true product economics disappear.
- Never booking returns. With returns near 20% of orders, an unbooked return rate is the fastest way to overstate profit on paper.
- Ignoring fixed overhead. Contribution margin is not net profit. Salaries, rent and software still have to be covered before the store makes money.
- Judging profit on order one. A first-order loss can be a lifetime win, and a first-order win can be a lifetime loss. Read the statement against lifetime value.
Avoiding these is discipline, not sophistication: book gross first, give every cost its own line, keep ad spend out of COGS, and never read a single order's profit without the customer's lifetime beside it.
Ecommerce P&L FAQs
An ecommerce profit and loss statement is a period summary of profitability that starts at gross sales and subtracts discounts, refunds and returns, cost of goods sold, transaction and platform fees, shipping and fulfillment, advertising and fixed overhead to arrive at net profit. Unlike an ad platform's ROAS, it nets every cost against the revenue it consumed, so it shows the honest bottom line rather than attributed revenue alone.
ROAS reports attributed revenue divided by ad spend, not profit. It ignores cost of goods, discounts, refunds, fees and shipping, so a healthy-looking 4x ROAS can still lose money on the order. A 30% contribution-margin product that costs $35 to sell shows a 2.86x ROAS that looks efficient yet loses about $5 per order. Contribution margin and net profit are what tell you whether an order actually made money.
Gross margin subtracts cost of goods sold only. Contribution margin subtracts every variable cost tied to the order, cost of goods plus discounts, refunds, payment and platform fees, shipping and ad spend, so it shows what one more order actually contributes. Net profit then removes fixed overhead such as salaries, rent and software. Gross margin flatters, contribution margin decides, and net profit is the final verdict.
Break-even ROAS equals 1 divided by your contribution-margin percentage. If contribution margin is 40%, break-even ROAS is 2.5x; at 30% it is about 3.3x. Anything below break-even loses money on the order, so add a 15% to 25% buffer to fund genuine profit and fixed costs. Tying every ad target to contribution margin this way is what connects the campaign dashboard back to the P&L.
Advertising belongs in operating expenses, not cost of goods sold. Folding acquisition cost into COGS inflates your gross margin and hides the true product economics, making a losing catalog look healthy. Keep COGS to the direct cost of the product and its inbound handling, then track ad spend separately so gross margin, contribution margin and the effect of rising acquisition cost each stay visible on the statement.
Nexus by Omniconvert ingests transactional and behavioral data across your store and nets discounts, refunds, cost of goods, fees and ad spend against each order, so profit is measured per order and per segment rather than as a blended ROAS. It then maps that true profit to predicted lifetime value, so budget targets the customers and cohorts worth acquiring and retaining, not just the campaigns with the flattering return.
ROAS tells you a campaign was efficient; it never tells you the order made money. The one number that changes the decision is contribution margin per order, and the P&L exists to protect it from every leak, discounts, refunds, fees, shipping and ad spend. Build the statement bottom-up once, read it daily, and set every ad target from break-even ROAS rather than a platform's flattering multiple. Then extend it across the customer lifetime, because true profit only settles once retention is in the picture. See how Nexus by Omniconvert ranks growth by true profit.
Measure true profit per order, not blended ROAS
Nexus by Omniconvert nets discounts, refunds, cost of goods, fees and ad spend against every order and segment, then ranks the opportunities by true profit and predicted lifetime value. Stop steering by attributed revenue and start acting on what actually pays.