Visual Reveal Was the Hook That Climbed Most in eCommerce Ads, October 2026

Scope: all industries and every country the eCommerceBenchmark Ad Library tracks. 33,668 ads active in October 2026, compared with September 2026. Hook shares only, with no country or industry split.
One second. That is all a hook gets.
A hook is the first line or the first second of an ad, the part that has to stop a thumb. In October 2026, one hook grew more than any other. Visual reveal took 9% of all ads, up from 6.2% a month before.
We read 33,668 ads active in October, from every industry and country the eCommerceBenchmark Ad Library tracks, against the same count for September. Hook shares only, with no country or industry split.
Here is what that hook is, the real ads that open that way, how the other big hooks moved, and the one test it is worth.
- One hook moved more than the rest. Visual reveal went from 6.2% of all ads in September to 9% in October. That is a gain of 2.8 points, the largest hook move of the month.
- It is not one brand's habit. 299 brands ran it, on 3,031 ads. A wide base, not a single advertiser's batch.
- The biggest hook is still much bigger. Curiosity gap sits at 15.9% in October against 18.8% in September. It lost share and still leads by a distance, so your control keeps its budget.
First, what Visual reveal actually is.
Visual reveal rose from 6.2% to 9% of all ads
Visual reveal is defined as a hook that opens by showing the thing itself, the product or a side by side, instead of making a claim about it in words first. In October it took 9% of all ads. In September it took 6.2%. That is a gain of 2.8 points, and it carried Visual reveal past Authority, which sat at 6.5% in September and 5.3% in October.
The share rests on 3,031 ads. Those ads came from 299 brands, so plenty of different advertisers opened this way.
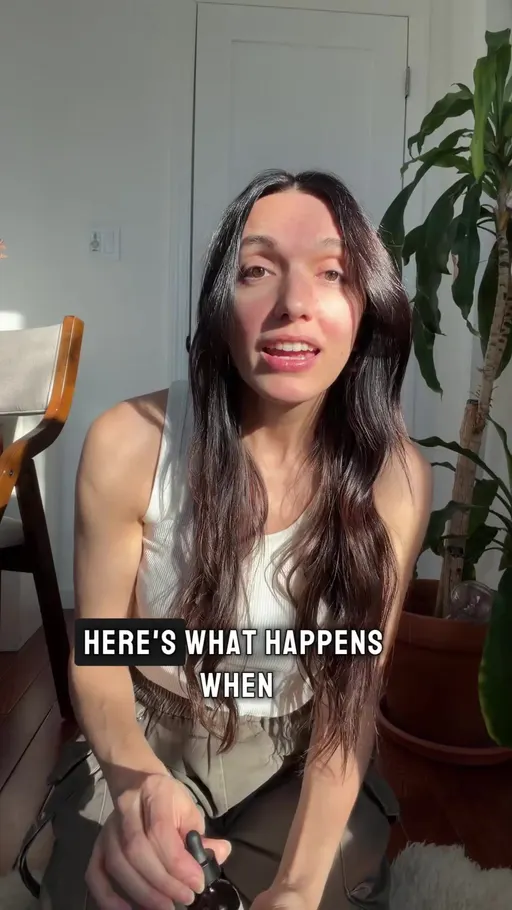

The longest-running Visual reveal ad we can show comes from banyanbotanicals.com, on air 246 days. It opens on "Here's what happens when you use this serum versus when you don't". Days on air say how long a brand kept an ad live, never what it sold.
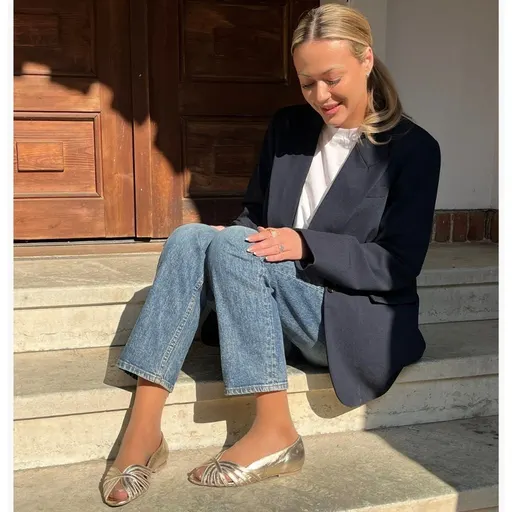
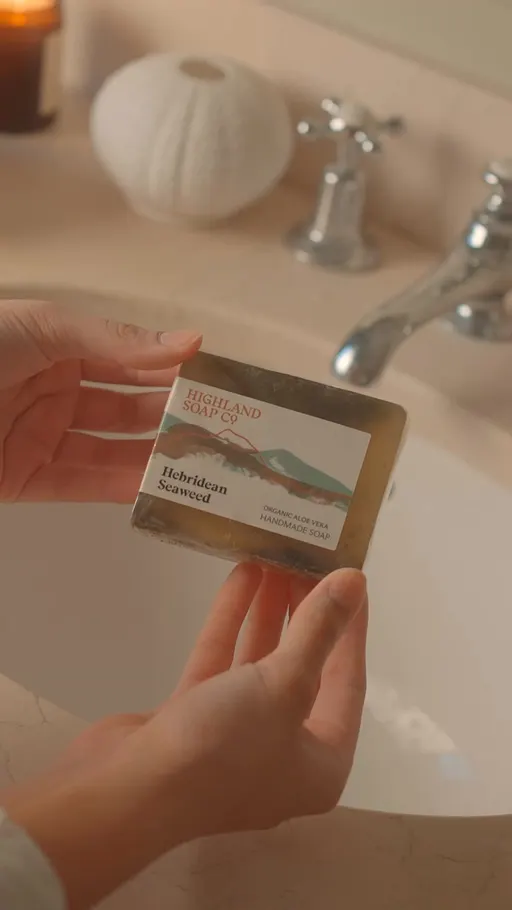
shoesuite.ie opens on "Copenhagen Gold Pump 🌟", 242 days on air. highlandsoaps.com names the bar itself, "Hebridean Seaweed Handmade Soap", at 230 days. blushlingerie.com points at the range with "Toute notre lingerie ✨" (translated from French: "All our lingerie"), at 170 days. All four put the thing on screen into the first few words.
Now look at the hook that still runs on more ads than any other.
Curiosity gap is still the biggest hook, but it shrank
Curiosity gap took 15.9% of all ads in October. In September it took 18.8%, so it gave up 2.9 points. It still ran on 5,367 ads, from 410 brands, and it sits 6.9 points above Visual reveal's 9%.

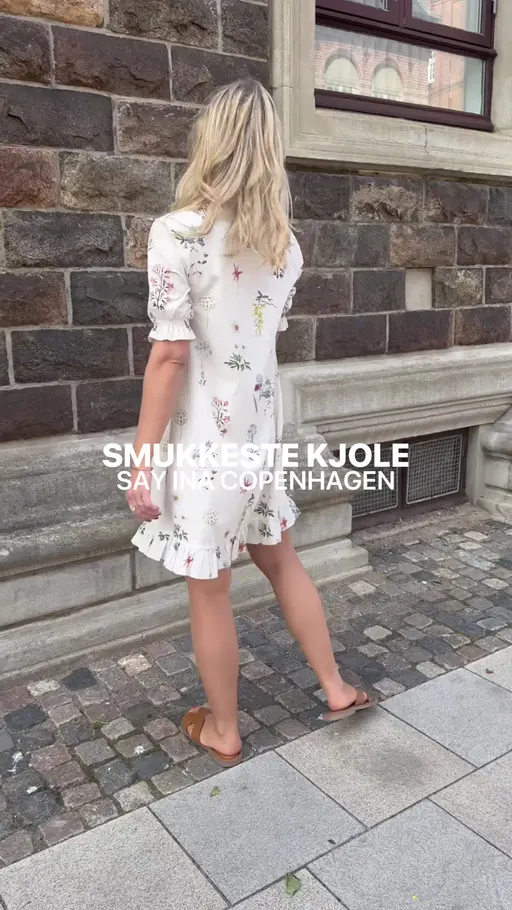
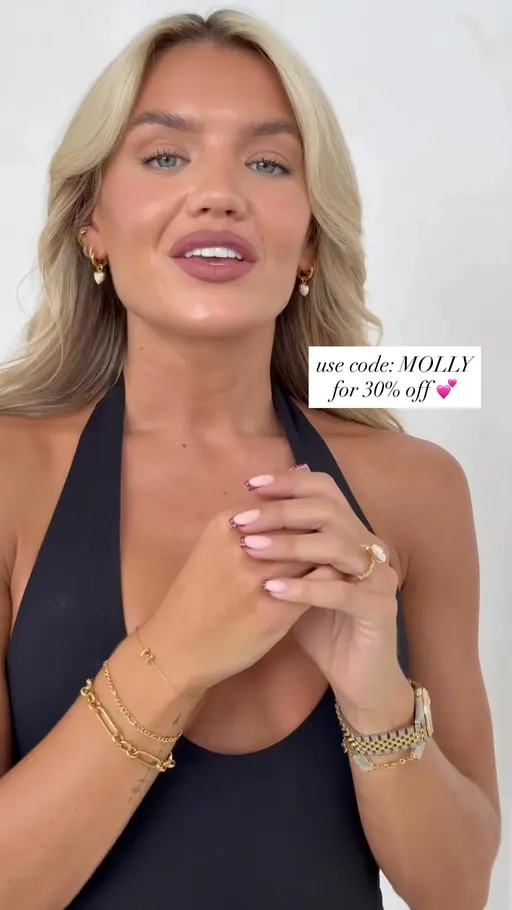
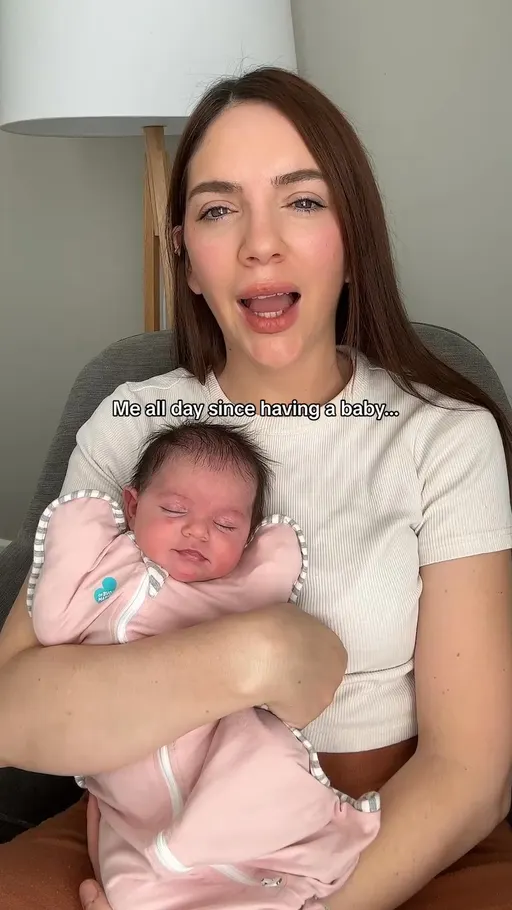
thrifted.com has kept "NEW AUTUMN RALPH LAUREN DROP" on air 398 days (that's time on air, not sales). fashionbystrand.com opens on "SMUKKESTE KJOLE" (translated from Danish: "Most beautiful dress"), at 397 days. abbottlyon.com opens on "You guys know that I am more of a gold jewellery girl", at 269 days. lovetodream.com.au holds the payoff behind an ellipsis in "Me all day since having a baby...", at 259 days. Each one says there is something worth seeing and makes you tap to see it.
Here is how the biggest hooks moved.
The biggest hooks, October against September
A hook share is defined as the portion of all ads active in the month that open with that one hook. Of the ten biggest hooks, Visual reveal gained the most, and Bold claim came next.
Change in share of all ads, October vs September 2026, in percentage points. Rows under three hundred ads are left out. Source: eCommerceBenchmark Ad Library, 2026.
Bold claim was the next riser, 8.3% in September to 10.6% in October, a gain of 2.3 points. Curiosity gap lost the most, 18.8% to 15.9%. Shocking statement held at 1.2% in both months.
One month of movement is a reason to test, not to rebuild. A hook that holds its share across both months is the one your account can lean on, and your copy budget belongs there. The riser earns a cell, nothing more.
So what do you do with this?
Three tests worth running
- One Visual reveal opening for your best seller. Run it against your current control for a full month. Visual reveal reached 9% of all ads in October.
- Name the thing on screen in the first three words. Put that opening inside the hook you already run most. banyanbotanicals.com has kept its side-by-side opener on air 246 days.
- Keep the Curiosity gap control funded. It is still the biggest hook at 15.9% of October ads, down from 18.8% in September.
The eCommerceBenchmark Ad Library sorts your ads into the same hooks, angles, concepts and offers used in this report and shows your mix next to the market, so you can see which shapes you have never shipped.
Audit my creatives, freeThose three fit inside one month and one test cell. Here is how this same finding gets read wrong.
The mistake: rewriting every opening to the hook that climbed
The mistake is reading one month's gain as an order, then changing the first line of every ad at once. You see it in the next batch: the same opening on the demo, on the retargeting ad, on the bundle ad and on the new launch.
A share cannot carry that weight. It counts what brands ran, not what sold. And an opening that every brand switches to stops stopping anyone, because a shopper meets the same first second over and over and scrolls past all of it. Keep your control and give the riser one cell.
Your test card
Here is the first test from the box, set up the way a media buyer would run it. Write your own numbers down before you launch.
| Hypothesis | One Visual reveal ad will land within my control's cost per purchase, so it is worth a second test. |
| Change only this | The opening only: the first second shows the product or a side by side instead of teasing it, for the same best seller. |
| Keep the same | Product, offer, angle, format, audience, placement and budget split, and the Curiosity gap control stays funded. |
| Funnel stage | Say first whether this ad is for prospecting (cold) or retargeting (warm). A deal in the first line is often right for warm audiences and wrong for cold ones, so test it where the ad will really run. |
| Setup | One control and one variant, same audience, same placement, even budget split. Do not edit either ad while the test runs. |
| How long and how much | Until each version has about 50 purchases, or two full weeks, whichever comes later. This is general testing practice (Meta's own learning-phase guideline is about 50 results per ad set per week), not a library finding. |
| Success metric | Cost per purchase, not clicks. |
| Stop rule | Pause a variant that has spent about 3 times your target cost per purchase with no purchase. If it is close, keep it running. |
| What counts as a win | The variant beats the control on the metric by an amount you would act on, and still does in a second week. |
Key takeaways
- Visual reveal rose from 6.2% of all ads in September to 9% in October [eCommerceBenchmark Ad Library, 2026], a gain of 2.8 points.
- It ran on 3,031 ads from 299 brands in October.
- Curiosity gap is still the biggest hook, 15.9% in October against 18.8% in September.
- Bold claim was the next riser, 8.3% to 10.6%. Curiosity gap lost the most share, 18.8% to 15.9%.
- Visual reveal passed Authority, which sat at 6.5% in September and 5.3% in October.
- The longest-running Visual reveal ad we can show is from banyanbotanicals.com at 246 days. That is time on air, not sales.
- Give the riser one test cell and keep your control funded.
Questions
Visual reveal reached 9% of all ads in October while Curiosity gap slipped to 15.9%. Pull your last ten ads and sort them by how they open: a tease, a claim, a question, or the product itself on screen in the first second. If no ad in that pile opens by showing the thing, that is the empty box, and it is the cell to fill before your next budget cycle. One opening, one month, control untouched.