Ad Creative Analytics: Find Patterns in Your Winning Ads

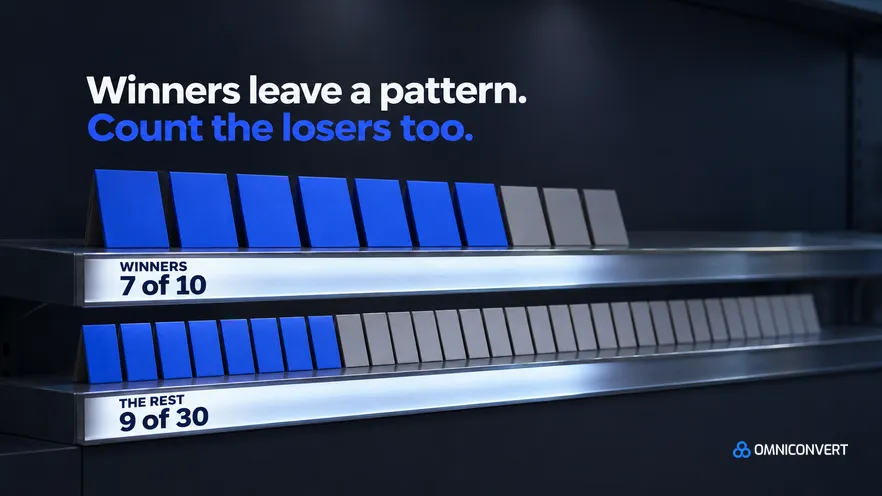
- Ad creative analytics describes every ad by its attributes and relates them to a result, so you learn which ideas pay and not only which files did.
- A winning pattern is an attribute that appears in winners more often than in the rest, not one that merely appears in winners.
- Ad names that carry angle, hook, format and offer in a fixed order are the cheapest analytics layer you can build.
- Rank ads by profit per ad and write the winner rule before you look at the data.
- Spend share and days live are controls: they stop you crediting a hook for a result that budget produced.
- A pattern is a hypothesis until a test confirms it, so every pattern ends in a brief, not a scale decision.
- Omniconvert Commander does not tag creative at element level or build concept-level dashboards, and it measures True Profit per ad and recommends scale, hold, reduce or kill, which you approve.
Ad creative analytics does not start with a new tool. It starts with consistent ad names, an ad-level export and a spreadsheet, plus the discipline to compare your winners with everything else you ran. Skip that last part and what you call a pattern is a trait you noticed in a few good ads.
I have watched teams pay for deep creative dashboards while their ads were still named Final_v3_NEW. The CROBenchmark audit scores 7,000+ websites in 15+ industries against a closed list of 248+ criteria [CROBenchmark Report 2026, Omniconvert], and a closed list is also what makes ad tags comparable. For test design, see Meta ads creative testing. For software, see the best creative analytics tools for Meta ads. Before either comes the question of what your winners share.
Omniconvert Commander (formerly Nexus) is the AI eCommerce growth engine for Shopify brands: it reads your store, ad and customer data, ranks growth opportunities by profit impact, and builds the campaigns to act on them, and you approve what goes live. It does not tag creative at element level. It works one layer down, at the decision. The method here runs in a spreadsheet.
What is ad creative analytics, and what counts as a winning pattern?
Ad creative analytics is defined as describing every ad by its attributes and relating those attributes to a result, so you learn which ideas pay and not only which files did. Campaign reporting tells you whether the account works. Creative analytics tells you what to brief next.
A winning pattern is defined as an attribute that appears in winning ads more often than in the rest of your ads, across enough ads and enough spend that luck and budget share do not explain it. The comparison with the rest is the whole point. A trait that every winner has is no pattern if every loser has it too.
Keep the attributes apart: an angle is the reason to buy, a hook is the first moment that earns attention. The difference between hook, concept and angle has its own page.
Build the sheet first: names, exports and tags
Name every ad in one pattern: concept, angle, hook, format, offer, launch month, separated by underscores. Use a closed list of values. The name must also travel into your URL parameters, so a store order can be matched to an ad. The UTM link entry covers the mechanics.
Then export the ad-level table for one fixed window. Take revenue from the store, not the platform, and subtract refunds, discounts and cost of goods. Divide by spend and you have POAS for each ad. How to measure true profit, not ROAS shows the arithmetic. Rank on this number, because a high-ROAS ad can lose money once costs are netted out.
| Column | What it records | Example values | Common mistake |
|---|---|---|---|
| Angle | The reason to buy | Saves time, proves quality, removes risk | Free-text labels that drift |
| Hook | How the first moment earns attention | Problem-first, result-first, product-first | Merging hook and angle |
| Format | The shape of the asset | Static, carousel, short video | Tagging by file type only |
| Offer | What the buyer gets | Bundle, discount, free shipping, none | Leaving out ads with no offer |
| Proof | What makes the claim believable | Review, number, demonstration, none | Counting a logo as proof |
| Spend share | Control: how much budget the ad received | Share of total spend in the window | Skipping it, so budget looks like quality |
| Days live | Control: how long the ad had to perform | Days between launch and window end | Comparing a week-old ad with a quarter-old one |
Find patterns in your winning ads in seven steps
- Name every ad on one pattern. Put concept, angle, hook, format and offer in the ad name, in a fixed order, from a closed list of values. Map old ad names to the new vocabulary in the sheet, and name every new ad correctly from today.
- Export ad-level results for a fixed window. Pull the ad name, spend, purchases and days live for every ad that ran in the window. Use one window for all ads, and keep the ads that lost as well as the ads that won.
- Join store revenue and costs to get profit per ad. Match store orders to ads through the ad name carried in the URL parameters. Subtract refunds, discounts and cost of goods from revenue, then divide by spend.
- Set the winner rule before you look. Write the rule in profit terms, for example the top quarter of ads by profit per ad among those that passed a spend floor. Ads below the floor go in a separate group called not enough spend, not in the losers.
- Tag each ad against the closed list. Fill the angle, hook, format, offer and proof columns by hand, from the ad itself and not from its name alone. Have two people tag the same sample and compare, so vocabulary drift shows up early.
- Compare winners with the rest. Build a pivot of each attribute value by group. For every value, record how many winners carry it and how many other ads do. A value that is common in both groups is not a pattern.
- Check the controls, then write the next brief. Check spend share and days live for the ads that carry the value. If the pattern survives, write it as a hypothesis, brief a test around it, and log the decision beside the number.
Step 5 is where tagging gets hard, because you must take an ad apart before you can label it. Winning ad angles shows how to do that on a single ad.
How to read a pattern without fooling yourself
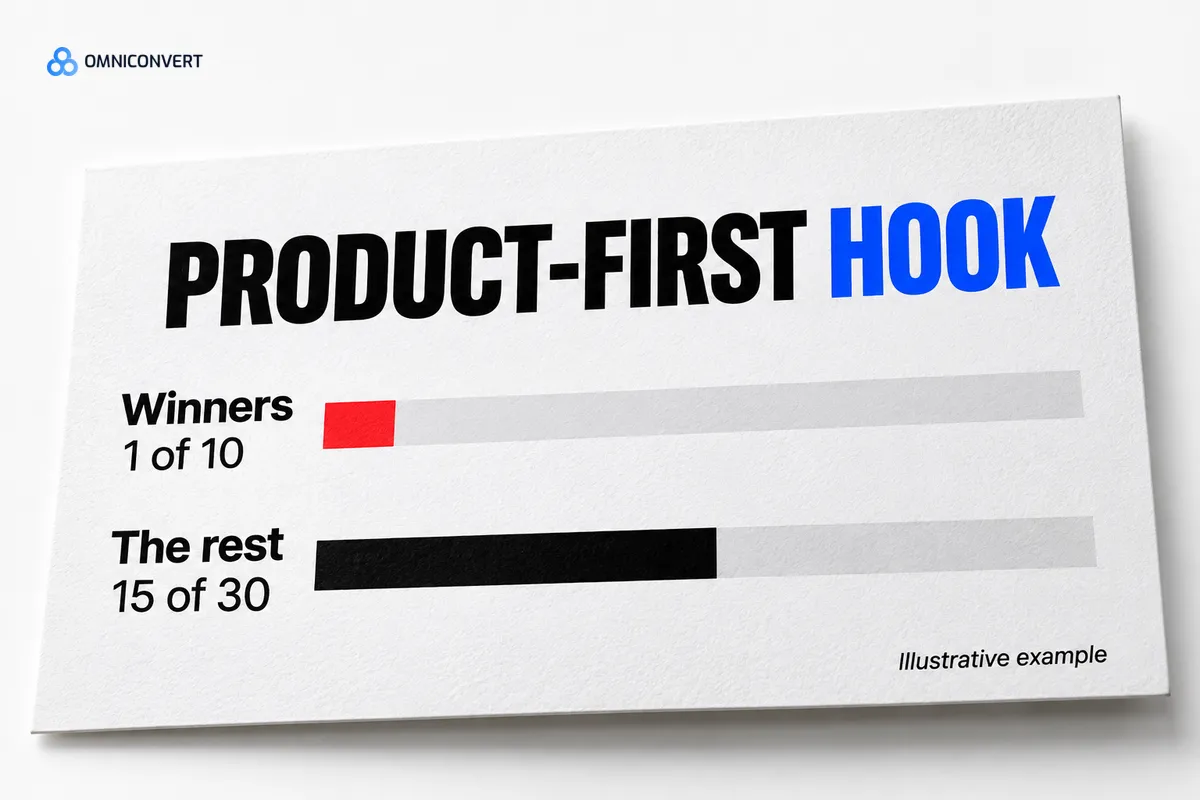
Here is an illustrative example. The numbers are invented to show the method, not data. A store ran 40 ads in a quarter, and ten cleared the winner rule. Seven of those ten opened with a problem-first hook. Among the other thirty, nine did. A problem-first hook sits in most winners and a minority of the rest, so it earns a test. A product-first hook sits in one winner and fifteen of the other thirty, so question it before you brief more of it.
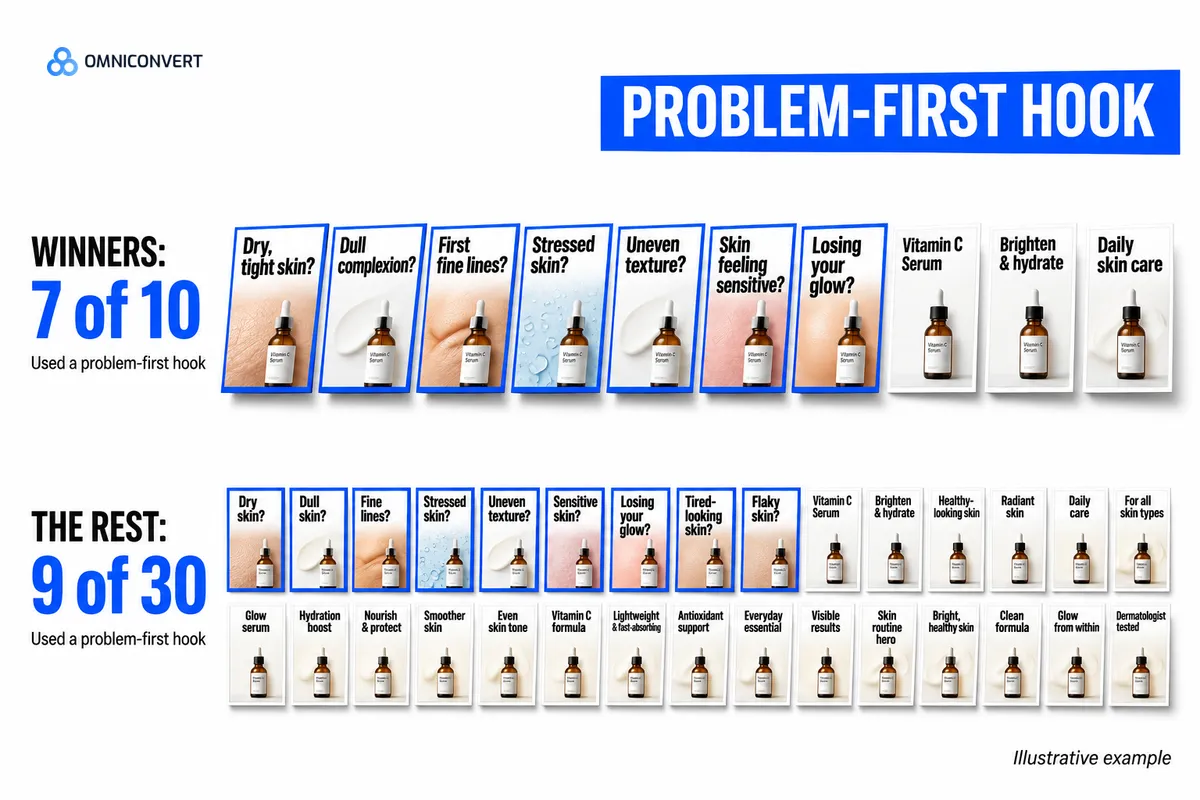
Counting traits in the winners only is the trap that catches careful teams too. A team sorts Ads Manager by ROAS, takes the top five ads, notices that four show a customer holding the product, and briefs the next twenty ads that way. It looks reasonable: the trait is visible and it feels like insight. The cost comes later. Nobody counted how many losers also showed a customer holding the product, and nobody checked whether the top five held most of the spend. The new batch copies a trait that was just as common in the losers, and a quarter goes by with nothing reusable learned.
Budget is the quiet confounder. In the accounts I have seen, delivery tends to give a few ads most of the spend, so look at spend share for every ad that carries the value. An ad live for a week cannot be compared with one that ran all quarter.
Then write the pattern as a hypothesis, test it, and record the hypothesis and the result. AliveCor used Omniconvert to run a structured A/B testing programme and achieved +21% conversion rate, +5% revenue per visitor, and 94% statistical relevance across their experiments. [Omniconvert, AliveCor case study]
Where a spreadsheet stops and dedicated tools start
A spreadsheet tags ads, not the elements inside them. To learn whether a text overlay or the first three seconds drive the result, you need tagging at element level, and by hand that does not scale. Dedicated creative analytics tools do this job.
Pick by the failure you have. If you cannot tell what an ad contains, buy tagging. If you cannot tell whether it paid, fix the profit join first.
Where Omniconvert Commander fits: the decision layer
Omniconvert Commander does not tag creative at element level, and it does not produce concept-level analytics dashboards. Dedicated analytics tools do that. To see how the two sit side by side, read Omniconvert Commander vs Motion.
Omniconvert Commander works one layer down. It unifies store, ad and customer data, reconciles against the platforms daily, and measures True Profit per ad. It then gives a scale, hold, reduce or kill recommendation on each ad, and you approve what goes live. Approved work launches to Meta. It also ranks creative variants by CLV-weighted angle, which CLV-weighted creative performance explains.
FAQ: finding patterns in winning ads
What is ad creative analytics?
Ad creative analytics describes every ad by its attributes, such as angle, hook, format, offer and proof, and relates those attributes to a result. Campaign reporting tells you whether the account works. Creative analytics tells you which ideas deserve another brief.
What is a winning pattern in ad creative?
A winning pattern is an attribute that appears in your winning ads more often than in the rest of your ads. It must hold across enough ads and enough spend that luck and budget share do not explain it. A trait that winners and losers share equally is not a pattern.
How do I find patterns in my winning ads with a spreadsheet?
Name ads on one pattern, export ad-level results, and join store revenue and costs to get profit per ad. Set a winner rule, tag each ad against a closed list, and compare how often each value appears in winners and in the rest. Check spend share before you trust the result.
How many ads do I need before a pattern means anything?
There is no universal number, and I will not invent one. Set two floors before you look: a minimum spend per ad, and a minimum count of ads that carry the attribute. A value found in two or three ads is an anecdote. Treat anything near the floor as a reason to test, not to scale.
When does a dedicated creative analytics tool beat a spreadsheet?
A tool earns its price when you run hundreds of ads, when you need tags inside the creative such as the first frame or on-screen text, or when several people need one live view. Across the brands I have seen, a spreadsheet with disciplined names is enough up to a few dozen ads.
Does Omniconvert Commander replace a creative analytics tool?
No. Omniconvert Commander does not tag creative at element level or produce concept-level dashboards. It works at the decision: it measures True Profit per ad and recommends scale, hold, reduce or kill for each one. You approve what goes live, and approved work launches to Meta.
Count the losers too
A winning ad shows you a trait. Only the losers show you whether the trait matters. Name your ads in one pattern, rank them in profit, fix the winner rule first, and compare winners with the rest while you check spend share. What survives is a hypothesis for the next test, and a test is how a pattern turns into a decision you can fund.