What Is POAS (Profit on Ad Spend)?

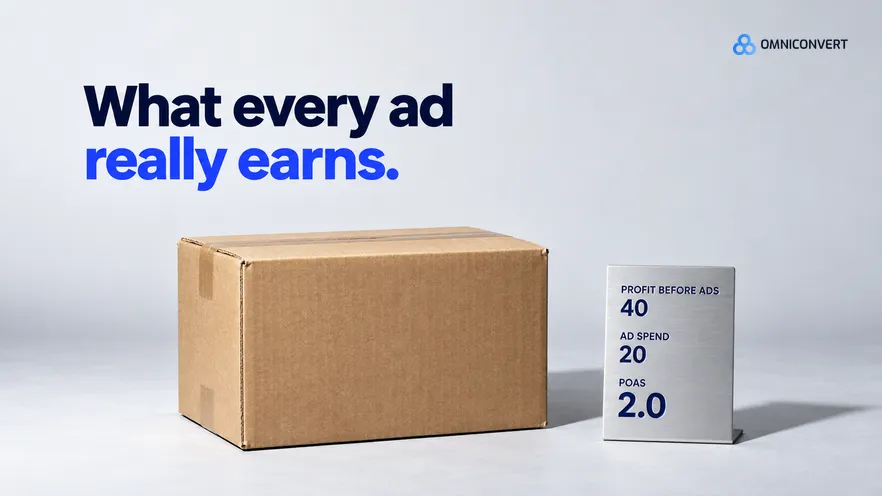
- POAS is defined as profit before ad spend divided by ad spend, and 1.0 is the break-even point.
- The numerator is order value after discounts minus every variable cost except advertising, not revenue and not gross margin alone.
- A POAS built on cost of goods only looks healthy while shipping, payment fees and returns erase the profit.
- There is no universal good POAS: the target follows from your contribution margin, your overheads and the customers you are buying.
- Fixed overheads stay outside the calculation, so a target of exactly 1.0 leaves them unpaid.
- Software can calculate POAS only if cost data sits in the same place as ad data.
Last updated: October 2026
What is POAS? Profit on ad spend (POAS) tells you how much profit each unit of ad spend brings back, counted before the ad cost comes off. At a POAS of 2.0, every dollar you spend returns two dollars of profit before that spend, so the ad paid for itself and left one dollar over.
I have spent 13 years in eCommerce, and one mistake keeps returning: a campaign that looks healthy in revenue and loses money once costs are counted. POAS catches that. Nexus by Omniconvert is the AI eCommerce growth engine for Shopify brands: it reads your store, ad and customer data, ranks growth opportunities by profit impact, and builds the campaigns to act on them, and you approve what goes live.
This page covers the definition and the arithmetic. For the wider picture, read what True Profit means in eCommerce and what ROAS is. For actions after a weak number, see how to reduce wasted ad spend.
What is POAS (profit on ad spend)?
POAS is defined as profit before ad spend divided by ad spend. Profit before ad spend is defined as order value after discounts, minus every variable cost of winning and fulfilling the order except advertising. Some tools call it gross profit, others contribution margin before ads. For the full argument about which metric to steer by, see ROAS, True Profit and contribution margin.
How to calculate POAS
The formula is POAS = (order value after discounts minus variable costs excluding ads) divided by ad spend. Here it is for one hypothetical order.
| Line | Per 100 of order value | Note |
|---|---|---|
| Order value after discounts | 100 | Money you actually received |
| Cost of goods | -40 | What the product cost you |
| Payment fees | -3 | Charged on the order |
| Fulfilment and shipping paid | -12 | Pick, pack and carrier |
| Returns provision | -5 | Expected cost of returns |
| Profit before ad spend | 40 | The numerator |
| Ad spend | 20 | The denominator |
| POAS | 2.0 | 40 divided by 20 |
Every figure above is invented for the example. Replace each line with your own costs.
Which costs come before ad spend?
Use the price after discounts. Shipping the customer pays is revenue, and shipping you pay is cost. Where each number lives is covered in how to measure True Profit.
What is a good POAS target?
At break-even your overheads are still unpaid. Margin sets the room you have. Two hypothetical stores both run a revenue return of 5.0. One keeps 40 per 100 of order value before ads, the other 20. Their POAS is 2.0 and 1.0: one has room, the other is at break-even.
Customer type moves the target. A campaign that wins new customers can accept a POAS below 1.0 if repeat orders repay it, but only when you measure them as a cohort with a stated payback window. I quote no industry POAS, because another store's margin says nothing about yours. Whatever target you set, test that a change moved it. A structured testing programme separates a real gain from noise.
AliveCor used Omniconvert to run a structured A/B testing programme and achieved +21% conversion rate, +5% revenue per visitor, and 94% statistical relevance across their experiments. [Omniconvert, AliveCor case study]
POAS in eCommerce: where the number goes wrong
A team wants POAS fast, so it takes the product margin from the store admin and divides by ad spend. The ratio looks comfortable and the campaign gets more budget. Every input is a real field. But shipping paid, payment fees and returns were never subtracted, so the true ratio is lower, sometimes under 1.0. The cost is concrete: the team scales ads that lose money on each order, and the dashboard stays green. Across 7,000+ websites in 15+ industries, audited against 248+ criteria [CROBenchmark Report 2026, Omniconvert], measurement gaps like this recur more often than missing tools.
Software to calculate POAS
A spreadsheet is the right first step, because it forces you to list the cost lines. It breaks when costs vary by product and month. A BI model scales but needs an analyst. Some teams send profit to the ad platform as the conversion value, so it optimises on profit. That works only if each order's profit is accurate when sent.
Nexus goes one step further. It unifies store, ad and customer data and measures results in True Profit, not ROAS, per ad, with live Meta and Google integrations reconciled daily. True Profit is what remains after ad cost, so POAS follows: POAS equals 1 plus True Profit divided by ad spend, when ad spend is the only marketing cost attached.
POAS: FAQs
What does POAS stand for?
POAS stands for profit on ad spend. It divides the profit an order earns before advertising by the ad spend that won it. A POAS of 1.0 is break-even, and anything above it is profit left after the ads are paid for.
How do you calculate POAS?
Take order value after discounts, subtract every variable cost except ads, and divide by ad spend. In the hypothetical example on this page, 40 of profit before ads on 20 of ad spend gives a POAS of 2.0.
What software can calculate POAS?
Start with a spreadsheet. Beyond that, use a BI model joined to your cost data, or a profit-analytics tool that already holds orders, costs and ad spend together.
What is a good POAS?
Above 1.0, which is break-even, by enough to cover your overheads and risk. Your contribution margin sets how much ad spend that takes, so no single figure fits every store.
How does Nexus by Omniconvert relate to POAS?
Nexus by Omniconvert measures results per ad in True Profit, not ROAS, and POAS follows from that figure. It recommends scale, hold, reduce or kill on each ad, and you approve what goes live.
What to do with POAS
POAS is small arithmetic that works only when the profit line is honest. Put every variable cost into profit before ad spend, compute the ratio per campaign, and set a target above 1.0 that your margin justifies. Then act: cut what sits below break-even, and keep a written hypothesis for anything you scale.