True Profit vs ROAS, POAS and MER: The Complete Guide

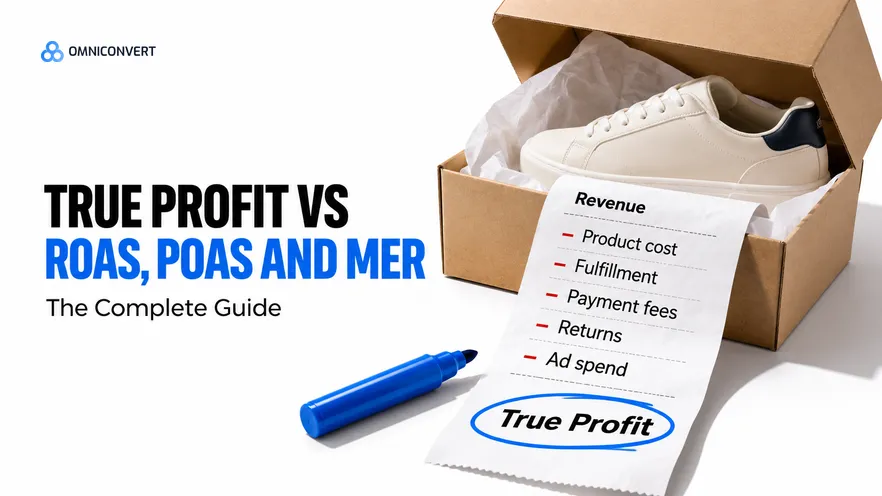
- ROAS measures revenue per unit of ad spend and ignores every cost of the order, so a high ROAS can sit on a loss-making sale.
- MER divides total revenue by total marketing spend, which makes it the right store-level check and a poor guide to individual campaigns.
- POAS divides profit before ad cost by ad spend, so 1.0 is break-even and the number compares campaigns on profit.
- Contribution margin is the floor under any ROAS target: it sets the ROAS at which an order stops losing money.
- True Profit subtracts all variable costs and the ad spend, which makes it the number to decide budget with.
- Moving a team off ROAS takes a cost source, a shared definition and one report, not a new tool on day one.
- Each metric answers one question. The mistake is asking a revenue metric a profit question.
True profit vs ROAS is the comparison most Shopify brands skip, and it is the one that decides whether ad spend makes money. ROAS, MER, POAS, contribution margin and True Profit all describe the same order. They give five different answers, and only one of them says whether the order was worth winning.
I have spent 13 years in eCommerce, and the most common budget mistake I see across brands is simple. A team reads a revenue metric as if it were a profit metric, scales what looks best, and finds the loss a quarter later in the finance report. Here I compare the five numbers on one illustrative order, say what each answers and misses, and show how to move a team onto the number that matters.
Omniconvert Commander (formerly Nexus) is the AI eCommerce growth engine for Shopify brands: it reads your store, ad and customer data, ranks growth opportunities by profit impact, and builds the campaigns to act on them, and you approve what goes live. It measures results in True Profit, not ROAS, and the sections below show why that choice matters.
What is the difference between True Profit and ROAS?
ROAS is defined as revenue attributed to ads divided by the ad spend that produced it. A ROAS of 4.0 means 4 units of revenue for every unit of spend. The number is fast to read and every ad platform reports it, which is why it became the default.
True Profit is defined as order value after discounts, minus product cost, payment fees, fulfilment, shipping and returns, minus the attributable ad spend. The full definition and formula live in our post on what True Profit is in eCommerce, and I use the same one here.
The gap between the two is every cost that sits between revenue and profit. ROAS ignores them all. A hypothetical store with a 55% gross margin and another with a 25% margin can post the same ROAS and have opposite businesses. That is the whole argument, and the rest of the page shows it in numbers.
One order, five answers
The order below is illustrative. Order value after discounts is 100. Product cost is 35, payment fees 3, fulfilment 8, shipping paid by you 7 and a returns provision 7. That leaves a contribution margin before ads of 40. The ad spend attributed to the order is 25. For MER, assume an illustrative month with 200,000 of total revenue and 60,000 of total marketing spend.
| Metric | Formula | Value on the example | Answers | Misses |
|---|---|---|---|---|
| ROAS | Revenue / ad spend | 4.0 (100 / 25) | How much revenue each unit of spend returned | Every cost of the order |
| MER | Total revenue / total marketing spend | 3.3 (200,000 / 60,000) | Whether the store as a whole earns its marketing | Which campaign did the work, and all costs |
| POAS | Profit before ad cost / ad spend | 1.6 (40 / 25) | Which campaigns pay back their own cost | The ad spend inside the profit, and lifetime value |
| Contribution margin | Order value minus variable costs | 40 before ads, 15 after | What an order can afford to spend on acquisition | Fixed and per-customer costs |
| True Profit | Contribution margin minus ad spend | 15 (40 minus 25) | Whether the order made money | Fixed overheads such as rent and salaries |
Read the table from the top. ROAS looks excellent at 4.0. POAS already pulls it down to 1.6, because it counts profit before ad cost. True Profit lands at 15, which is 15% of the order value. In the illustrative order, if returns come in at twice the provision, that 15 drops to 8. The metric you pick decides which of those numbers you see.
What ROAS answers, and what it hides
ROAS is a good speed gauge inside a campaign. You see within hours whether a creative or an audience is pulling. The trouble starts when the same number sets budget. Our guide to what ROAS is covers the formula, and the case against using it as a north star is in why ROAS is the wrong north star.
A second problem is attribution. Each platform counts the orders it can see, so Meta and Google can both claim the same sale. Add the lag between click and purchase and the reported ROAS drifts from what the store actually earned. ROAS is a platform opinion about revenue, not a measurement of profit.
Teams set one blended ROAS target, say a hypothetical 3.0, from the average gross margin, and apply it to every campaign. It looks reasonable because it is simple and the dashboard has a green line for it. The cost is that a campaign selling a high-return, low-margin category clears the target and loses money on every order, while a lower-ROAS campaign selling a high-margin line gets cut. The budget moves toward the loss.
MER: the store-level check
The formula is MER = total revenue / total marketing spend. Because it counts all revenue, organic sales and email sales count in its favour. That makes it hard to game and easy to trust at the store level. It is the right number for a Monday review and for a board slide.
Its weakness mirrors ROAS: it is still a revenue ratio. A store can hold a steady MER while its margin falls, if the mix shifts to discounted lines. For the full comparison of the three ratios, including mer vs roas vs poas on one set of numbers, read MER vs ROAS vs POAS. That page owns the detail.
POAS: profit before ad cost, per unit of spend
POAS, also called profit on ad spend, is the next step up from ROAS because it swaps revenue for profit in the numerator. Our page on profit on ad spend gives the formula and a worked example, so the calculation stays there.
What matters for the decision is where POAS sits in the ladder. It is the right per-campaign number when products have different margins. It has two limits. It reports profit before the ad cost, so a POAS of 1.6 and a True Profit of 15 describe the same order. And it ignores what a customer is worth over time. The definition page ROAS vs POAS vs True Profit sets the two side by side on one order.
Contribution margin: where ROAS starts to earn
On the example order, the break-even ROAS is 1 / 0.40, which gives 2.5. Any campaign under 2.5 loses money on that product mix, whatever the dashboard colour says. That is why I treat contribution margin as the floor and ROAS as a reading above it.
There are two versions, and teams mix them up. The version before ads is used to set targets. The version after ads is used to judge results. The full definition, the formula and the comparison with gross margin are in our page on contribution margin in eCommerce. If you want to test it on your own numbers, the Black Friday margin calculator shows how discounts eat into it.
True Profit and ecommerce profit analytics
Ecommerce profit analytics is defined as the joining of order, cost and ad data so that profit, not revenue, becomes the number each decision reads. The hard part is not the arithmetic. It is getting product cost, fees, shipping and returns onto the same row as the ad spend.
True Profit adds two things the other metrics lack. It subtracts the ad spend from the profit, so it is a real result and not a ratio. And it can carry the customer: an order that loses 5 today but brings a repeat buyer is a different decision from one that loses 5 and never returns. Our post on how to measure True Profit, not ROAS walks through the build. It still stops short of fixed overheads, which is the difference between True Profit and net profit.
If you have not set it up yet, the built-in Shopify reports are the usual starting point, and they are thin on cost data. Our guide to Shopify analytics lists what they miss.
When to use which metric
A simple rule works. Ask what the decision is, then pick the metric that can see the cost the decision depends on.
- Is the store healthy this month? MER. It needs no attribution.
- Is this creative or audience pulling today? ROAS. It is fast and the platform gives it free.
- Which campaign should get more budget? POAS, or better True Profit, because margins differ by product.
- What ROAS target should we set? Contribution margin before ads, turned into a break-even ROAS.
- Did this order or ad make money? True Profit.
The five do not compete. They sit on a ladder, and each rung adds one cost. The mistake is stopping on a rung below the decision you are making.
How to move a team from ROAS to profit
Start with the definition. Pick the cost lines that count, write them down and use them everywhere. Our True Profit definition is a fair starting point. A metric nobody agrees on gets argued about, not used.
Next, connect the cost source. Most brands can get product cost and shipping fast, and fees and returns take longer. Begin with the largest lines. A True Profit built on the largest cost lines beats a perfect ROAS that ignores cost.
Then run both numbers in one report for a month. The campaigns where ROAS is high and True Profit is low become the first conversation. That is how a team changes its mind, from its own data and not from an argument.
Structured measurement of this kind pays off beyond ad accounts. It is the same discipline behind an experimentation programme, where the metric chosen decides what you learn.
AliveCor used Omniconvert to run a structured A/B testing programme and achieved +21% conversion rate, +5% revenue per visitor, and 94% statistical relevance across their experiments. [Omniconvert, AliveCor case study]
Finally, change the targets. Replace a flat ROAS goal with a break-even ROAS per product group, then add a True Profit goal on top. Review it monthly, and let the budget follow the profit.
The data you need for True Profit
Each input has a usual home. Order value and discounts come from Shopify. Product cost comes from your catalog, your supplier sheet or an ERP. Payment fees come from the processor. Fulfilment and shipping come from your carrier or 3PL invoices. Returns come from Shopify refunds plus a provision for the ones still in transit. Ad spend comes from Meta and Google.
The join is where projects stall. Ad platforms report by campaign and day, while costs sit by order and SKU. A workable bridge is to allocate spend to products through the campaign's attributed orders, then roll costs up the same path. It is imperfect, and it is consistent, which is what a decision needs.
Customer data adds the next layer. Once orders carry a customer, you can see which acquisition channels bring repeat buyers, and move from a single-order view to a value-over-time view. That is the territory of customer lifetime value.
How Omniconvert Commander measures True Profit
The product exists because the join described above is slow to build by hand and slow to keep current. Omniconvert Commander does the join, reads the cost data you connect, and puts the result in profit instead of ROAS. Setup takes under 1 hour.
It has limits worth stating. It recommends and you approve, and it measures with the costs you give it. Missing cost lines mean a flattering number, the same as in a spreadsheet. The gain is that the number refreshes every day and sits next to the ad that produced it.
True Profit vs ROAS, POAS and MER: FAQs
What is the difference between True Profit and ROAS?
ROAS is revenue divided by ad spend. True Profit is what an order earns after every variable cost and the ad spend that won it. ROAS tells you how much revenue each unit of spend returned. True Profit tells you whether the order made money. Two orders with the same ROAS can differ by a wide margin in True Profit, because ROAS does not see product cost, shipping, fees or returns.
What is the difference between MER and ROAS?
MER is total revenue divided by total marketing spend over the same period. ROAS is revenue divided by the ad spend of one campaign or platform. MER covers the whole store, including organic and email sales, so it does not depend on attribution. ROAS depends on which orders each platform claims. Use MER to check the store and ROAS only as a rough per-campaign signal.
Is POAS better than ROAS?
POAS is better for comparing campaigns when products carry different margins, because it counts profit before ad cost instead of revenue. A campaign can win on ROAS and lose on POAS if it sells low-margin items. POAS still stops short of True Profit: it leaves out the ad spend in the profit figure and, on most setups, lifetime value. Treat it as the campaign-level view of profit.
Which metric should run my ad spend?
Use True Profit to decide where budget goes, MER to confirm the store is healthy as a whole, and ROAS or POAS only as the fast signal inside a campaign. The deciding number must include your variable costs. If it does not, a rising chart can hide a falling profit, which is the usual way brands scale into a loss.
What data do I need to measure True Profit?
You need order value after discounts, product cost, payment fees, fulfilment cost, shipping paid by you, a returns provision and ad spend by campaign. Store, ad and finance data must join on the order. The costs are the hard part: most stores hold product cost in one place and fees in another. Start with the largest cost lines and add the rest as you can.
How does Omniconvert Commander measure True Profit?
Omniconvert Commander measures True Profit per ad from the cost data you connect, and you approve what goes live. Setup takes under 1 hour. It reads the cost data you connect, so the result is only as complete as the cost lines behind it.
Pick the number that fits
Each metric earns its place for one question. ROAS tells you whether a campaign is pulling, MER tells you whether the store pays for its marketing, and POAS compares campaigns on profit. Contribution margin sets the floor, and True Profit decides the budget. Start with the number your decisions need, connect the costs behind it, and let the spend follow the profit.