Free Shipping Threshold: How to Set It Without Killing Margin

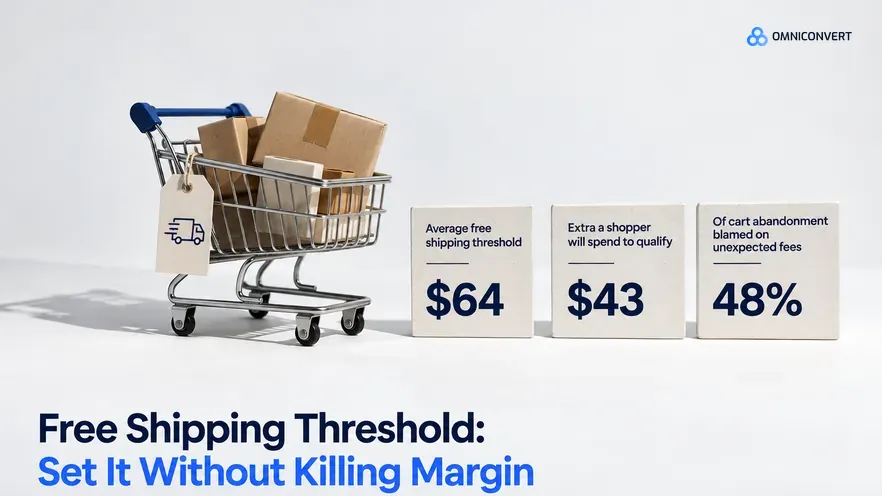
- A free shipping threshold is the minimum order value at which you absorb shipping; about 45 percent of retailers use a conditional threshold and the average is roughly $64.
- The AOV-maximizing threshold is almost never the profit-maximizing one: set it on contribution per order, not on average order value.
- The subsidy only pays for itself if the items customers add to cross the line carry enough margin; low-margin add-ons lift AOV while losing money.
- Model contribution per order (lifted AOV times margin minus absorbed shipping on qualifying orders) across candidate thresholds and pick the peak, not a round number above AOV.
- Progress bars lift AOV 11 to 30 percent via the goal-gradient effect; steer the nudge toward high-margin add-ons and show the cost early to cut the roughly 48 percent of abandonment caused by unexpected fees.
A free shipping threshold is the minimum order value at which a store stops charging for delivery and absorbs the cost itself. It is one of the most common levers in ecommerce, and one of the most casually set: the average threshold sits near $64, and shoppers will spend about $43 more to reach one. Across the CROBenchmark dataset of 7,000+ websites in 15+ industries, brands that set the threshold on contribution per order rather than on average order value protected margin while still lifting basket size, drawing on 13 years in conversion rate optimization [CROBenchmark Report 2026, Omniconvert].
Most advice tells you to pick a round number 20 to 30 percent above your average order value. That optimizes the wrong metric. Nexus by Omniconvert is the AI eCommerce growth engine that ranks orders by True Profit, and the honest version of this decision is a profit decision, not an AOV decision. This guide covers what a threshold is, why the popular default fails, the metric that should replace it, the margin trap underneath it, how to model your own number, and the psychology that makes the whole thing work.
What is a free shipping threshold?
The decision behind the threshold is where the money is. Setting one commits you to eating a variable cost on every qualifying order in exchange for a change in customer behavior: some shoppers who would have converted anyway now get free shipping they did not need, and some shoppers add items to cross the line. The number you pick decides the balance between those two groups, and that balance is the whole game.
The landscape shows how deliberate this should be. Only about 20.4 percent of retailers offer free shipping on all orders, 45.1 percent use conditional thresholds, and 77.2 percent of the top-1000 retailers offer free shipping in some form [SellersCommerce, 2026]. The average threshold is about $64, and shoppers report willingness to spend roughly $43 more to qualify [SellersCommerce, 2026]. Those two numbers together already hint at the tension: the average threshold is set well above what the average shopper wants to add.
Why is '20 to 30 percent above AOV' the wrong default?
The rule of thumb is popular because it is easy and because it usually does lift average order value. The problem is that AOV is a revenue metric, and a threshold is a cost decision dressed as a revenue lever. Raising AOV by 15 percent feels like a win on the dashboard, but if you now absorb shipping on a much larger share of orders, and the incremental items are thin-margin, contribution per order can fall while AOV rises.
There is also an anchoring effect the rule ignores. The threshold number is not just a qualification bar; it is an anchor that tells shoppers what a "normal" order looks like on your store. Set it at a round $75 and you have anchored the target basket at $75, whether or not $75 is where your margin math wants it. Placing that anchor deliberately, against your real basket distribution, matters more than making it a tidy multiple of a blended average that may not describe any actual customer.
Why is contribution per order the metric that matters?
Switching the objective from AOV to contribution per order changes the question from "does the threshold make baskets bigger?" to "does the threshold make orders more profitable?" Those are not the same question, and confusing them is the most expensive mistake in this whole area. Contribution per order at a candidate threshold is, roughly:
- Lifted AOV × gross margin: the profit contained in the larger average basket the threshold produces.
- minus absorbed shipping on qualifying orders: the real per-order cost of the free shipping you now give away, weighted by the share of orders that qualify.
The reason this matters is that the two terms move in opposite directions as you raise the threshold. Push it higher and the average qualifying basket grows (more profit per qualifying order), but fewer orders qualify and the ones that do are larger, so the mix shifts. Push it lower and more orders qualify, but you subsidize shipping on baskets that would have converted anyway. Contribution per order is the single curve that nets these effects, and it has a peak. That peak is your threshold.
Why does what customers add decide your margin?
Around 58 percent of shoppers say they add items to reach a free shipping threshold [SellersCommerce, 2026]. That statistic is usually quoted as pure upside. It is only upside if you know what they add. A customer who adds a $12 phone case at 70 percent margin to cross a $50 line has funded your shipping subsidy several times over. A customer who adds a $12 pack of refills at 8 percent margin has cost you money to give away delivery, even though your AOV chart moved the right way.
The ecommerce brands that plateau on shipping economics consistently share one pattern: they measure the threshold's success by AOV lift and never look at the margin of the marginal item. The benchmark gap closes fastest when operators treat contribution per order as the primary unit of measurement, not average order value, and design the nudge around which products they want customers to add.
See contribution per order at each candidate threshold, and which add-ons actually carry the margin to fund free shipping.
See how Nexus ranks orders by True Profit →How do you model your free shipping threshold?
The mechanics are simpler than they sound, and you can do the first pass in a spreadsheet:
-
Plot your real basket distributionNot the average, the spread. Where do orders actually cluster? A bimodal distribution (many small orders, a cluster of large ones) calls for a very different threshold than a tight one around the mean.
-
Pick candidate thresholds near the clusterSet candidates just above where the bulk of reachable baskets sit, so the goal is within reach for the shoppers most able to cross it. Aspirational round numbers far above the cluster convert almost no one.
-
Compute contribution per order at eachFor every candidate: estimate the lifted AOV, multiply by gross margin, then subtract the shipping you would absorb on the qualifying share of orders. Use the margin of the add-ons you expect, not blended margin.
-
Pick the peak, then test it liveThe spreadsheet finds the candidate; an A/B test confirms it. Run the winning candidate against your current setting and read contribution per order, not just conversion and AOV.
The table shows a simplified worked example for a store with a 45 percent blended margin and a $6 absorbed shipping cost, comparing three candidate thresholds against the same basket distribution.
| Candidate threshold | Lifted AOV | Qualifying orders | Contribution per order |
|---|---|---|---|
| $50 | $58 | 62% | $22.40 |
| $65 | $68 | 41% | $24.15 |
| $80 | $74 | 24% | $23.85 |
Notice that AOV keeps rising as the threshold climbs, but contribution per order peaks at $65 and then falls. The $80 threshold produces the biggest baskets and the worst economics of the three above $50. The AOV-maximizing choice and the profit-maximizing choice are different numbers, which is the entire point.
What psychology makes free shipping thresholds work?
The goal-gradient effect, first shown by Hull in 1934 and revisited by Kivetz, Urminsky, and Zheng, whose customers with a pre-stamped loyalty card completed it at 34 percent versus 19 percent for a plain card, describes how effort toward a goal accelerates as the goal gets closer [Kivetz, Urminsky & Zheng, JMR 2006]. Applied here, it means a threshold only motivates the shoppers who can see themselves reaching it. Set the bar far above the cluster of real baskets and the gradient never kicks in.
Mental accounting, from Richard Thaler, explains why free shipping beats an equivalent product discount even when the math is identical. Shoppers file shipping in a separate account and experience it as a penalty, a disliked line item rather than part of the product's price. Removing that line item feels better than saving the same money on the product. Loss aversion, from Kahneman and Tversky, completes the picture: a visible shipping fee reads as a loss, and a threshold converts that loss into an attainable gain, unlocking free shipping rather than paying a charge. The framing does real work, which is why "$8 away from free shipping" outperforms the raw arithmetic.
How do progress bars nudge the right add-ons?
The progress bar is the goal-gradient effect turned into interface. By showing exactly how far a shopper is from the line, it shrinks the perceived distance to the goal and accelerates the last stretch. Reported lifts run from 11 to 30 percent in AOV, with the strongest response from shoppers already within roughly 20 to 30 percent of the threshold [Growth Suite, 2026]. That is a large lever for a small piece of UI.
But the bar's default behavior invites the margin trap. "You're $8 away from free shipping" is an open invitation to add the cheapest thing that closes the gap, which is frequently a low-margin item. The refinement is to make the nudge specific: recommend a high-margin add-on that fits the gap, so the item that crosses the line is the item you wanted them to add. This is where the psychology and the margin math meet: the goal-gradient effect gets the shopper to add something, and your merchandising decides whether that something pays for the shipping.
Why should you show the free shipping number early at checkout?
A threshold that shoppers only discover at the final step does the opposite of its job. Unexpected extra costs are the most documented cause of cart abandonment among motivated shoppers, cited in about 48 percent of cases, against an average abandonment rate near 70 percent [Baymard, 2026]. Loss aversion is why: a fee that appears late reads as a loss inflicted at the worst possible moment, after the shopper has already committed mentally.
Surfacing the threshold early flips it from a hidden penalty into a visible, attainable goal. Show the delivery cost and the free-shipping line on the product page and in the cart, not just at checkout. The shopper who learns on the product page that they are $8 from free shipping has a goal; the shopper who learns at checkout that shipping is $8 has a grievance. Same number, opposite outcome.
When should you not use a free shipping threshold?
The threshold is not universal. Three situations argue against it. First, thin-margin catalogs: if your gross margin cannot cover the absorbed shipping even on lifted baskets, no threshold produces positive contribution, and a flat rate is more honest. Second, low-AOV catalogs with few add-ons: if there is nothing natural for a shopper to add, the threshold becomes a hurdle rather than a goal and simply suppresses conversion. Third, high shipping-cost variance: when weight or destination swings the shipping cost widely, one threshold cannot be set profitably across the range, and real-time carrier rates or a loyalty-tier benefit fit better.
AliveCor used Omniconvert to run a structured A/B testing programme and achieved a +21 percent conversion rate, +5 percent revenue per visitor, and 94 percent statistical relevance across their experiments [Omniconvert, AliveCor case study]. The lesson that transfers here is not the specific numbers but the discipline: treat the threshold as a hypothesis to test against contribution, not a setting to copy from a competitor, because the right answer depends entirely on your own margin mix and basket distribution.
How do you set and test your free shipping threshold?
Pulling the pieces together into a repeatable sequence:
-
Measure the distribution and the marginGet your real basket-value spread and your true blended margin, plus the average shipping cost you would absorb. This is the input to everything else.
-
Model contribution at candidate thresholdsCompute lifted AOV times margin minus absorbed shipping for two or three candidates near the basket cluster. Pick the peak of the contribution curve.
-
Add a margin-aware progress barShow the gap and recommend a specific high-margin add-on to close it, so the goal-gradient lift lands on items that pay for the subsidy.
-
Surface it early and testShow the threshold on the product page and cart, then A/B test the modeled threshold against your current one, reading contribution per order as the deciding metric.
Then treat it as a living setting. Margins move, product mix changes, and shipping costs drift, so the profit-maximizing threshold is not a number you set once. Re-run the model when any of those inputs shift, and let contribution per order, measured on your real orders, keep the number honest.
Free shipping threshold FAQs
A free shipping threshold is the minimum order value at which a store stops charging for delivery and absorbs the cost itself. About 45 percent of retailers use a conditional threshold rather than free shipping on everything, and the average threshold sits near $64. It is not just a marketing toggle: it is a joint pricing, merchandising, and logistics decision, because the number you pick changes both what customers buy and what each order earns you.
Model net contribution per order at several candidate thresholds against your real basket-value distribution, then pick the threshold where contribution peaks. Contribution per order is the lifted average order value multiplied by your gross margin, minus the shipping you absorb on qualifying orders. This is different from the threshold that maximizes average order value, because it accounts for the margin of whatever customers add to cross the line and the cost of the subsidy you now pay on those orders.
Treat it as a starting point, not the answer. The rule of thumb optimizes average order value and ignores margin, so it usually lands away from the profit-maximizing threshold. A round number 25 percent above your AOV can raise revenue while lowering profit if the add-ons customers reach for are low-margin. Test two or three candidate thresholds and let contribution per order, measured against your actual basket distribution, decide the number.
Only when the items customers add to qualify carry enough margin to cover the shipping you give away. Free shipping reliably lifts conversion and average order value, but those are revenue effects, not profit effects. If the marginal items are high-margin accessories, the subsidy pays for itself and then some. If they are low-margin staples or discounted stock, you can raise average order value while shrinking contribution per order, which is the trap most threshold advice ignores.
Yes. Progress bars that show how far a shopper is from the threshold report an 11 to 30 percent lift in average order value, and the response is strongest for shoppers already within about 20 to 30 percent of the line. This is the goal-gradient effect: motivation to complete a goal rises as the perceived distance to it shrinks. The lever is most profitable when the bar steers shoppers toward high-margin add-ons rather than any item that closes the gap.
Unexpected extra costs, mostly shipping, taxes, and fees, are the single most documented reason motivated shoppers abandon carts, cited in roughly 48 percent of cases. Shoppers file shipping in a separate mental account and feel a surprise fee as a penalty rather than part of the price. Surfacing the threshold and the delivery cost early, on the product page and in the cart, recovers much of that loss, because the cost stops arriving as a shock at the final step.
Nexus by Omniconvert ingests order, margin, and product-level cost data to rank every basket and segment by True Profit rather than revenue, so you can see the contribution per order at each candidate threshold instead of guessing from a blended average. It shows which products customers add to cross the line and what margin those add-ons carry, so the threshold you set, and the add-ons you nudge, protect contribution instead of just inflating average order value.
The threshold that maximizes average order value is almost never the one that maximizes profit, and the gap between them is contribution per order. Model that number at two or three candidate thresholds against your real basket distribution, watch the margin of what customers add, and let the peak, not a round figure above your AOV, set the line. Nexus by Omniconvert ranks each basket by True Profit so the threshold you choose protects margin instead of quietly spending it. See how Nexus ranks orders by True Profit.
Set a threshold that protects contribution margin
Nexus by Omniconvert ranks every order and segment by True Profit, not revenue, so you can see contribution per order at each candidate threshold and steer add-ons toward the margin that actually pays for free shipping. Stop optimizing a threshold on average order value and start setting it on the number that funds growth.