Health & Wellness Ads, October 2026: Solution-Aware Framing Carried 22.4%. Does Your Brief Still Open on the Ache?

Scope: Health & Wellness ads across every country the eCommerceBenchmark Ad Library tracks, 5,520 of them active in October 2026, from a vertical of 128 brands, read against September 2026. No split by country.
Open a wellness feed and count the complaints.
In September, problem-aware framing was the bigger of the two at 20.2%; in October the mix tipped the other way. Solution-aware framing carried 22.4% of the vertical's ads, up from 17.5% in September. Problem-aware framing fell from 20.2% to 16% [eCommerceBenchmark Ad Library, 2026].
That is 5,520 ads from the Health & Wellness brands the library tracks, in every country it tracks them. We read each one on four axes: the hook it opens with, the angle it argues, the concept it is staged as, and the offer it names, if it names one. Four lanes, four leaders, and movement in every one.
Here is the whole playbook, with the ads and the exact lines behind it.
- The category's argument changed in one month. Solution-aware framing went from 17.5% to 22.4% of ads. Problem-aware fell from 20.2% to 16%. If every brief you sign still opens on the symptom, you are writing for the shrinking lane.
- Explaining the how is getting crowded. Mechanism framing rose from 12.2% to 16.7% of ads, on 923 of them from 83 brands. A “here's how it works” line is table stakes in this category now, not a point of difference.
- Most of this category argues without a deal. 54.3% of October's ads name no offer at all, 2,998 ads from 104 brands. A discount is not the price of entry here, and your no-offer brand ad has plenty of company.
Solution-Aware Framing Argues 22.4% of the Category's Ads
A selling angle is defined as the argument an ad makes about why the product matters to the person watching. Solution-aware is the vertical's biggest one in October 2026, at 22.4% of ads, 1,236 of them from 88 brands. That share sat at 17.5% in September. Over the same two months, problem-aware slipped from 20.2% to 16%, on 885 ads from 59 brands [eCommerceBenchmark Ad Library, 2026].
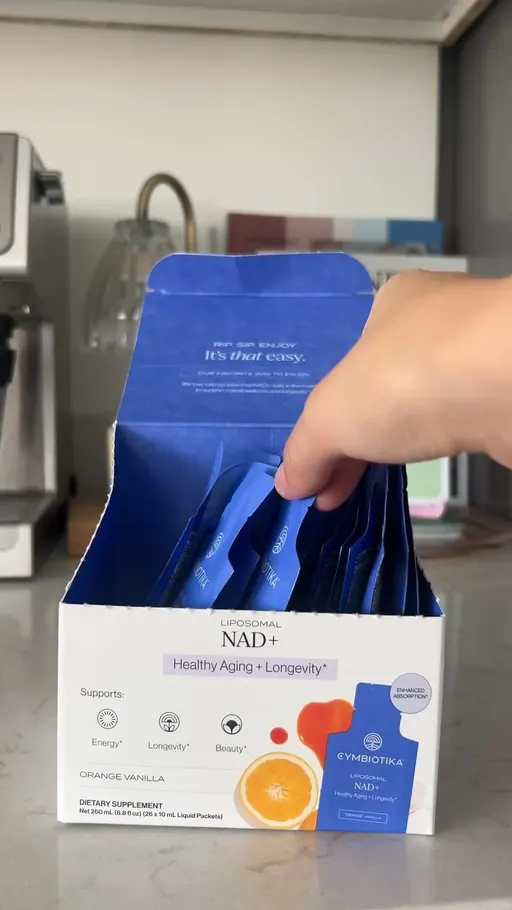
So what does naming the fix actually sound like? Four brands, four first lines.
Share of Health & Wellness ads by selling angle, the three largest rows, both full months. Source: eCommerceBenchmark Ad Library, 2026.
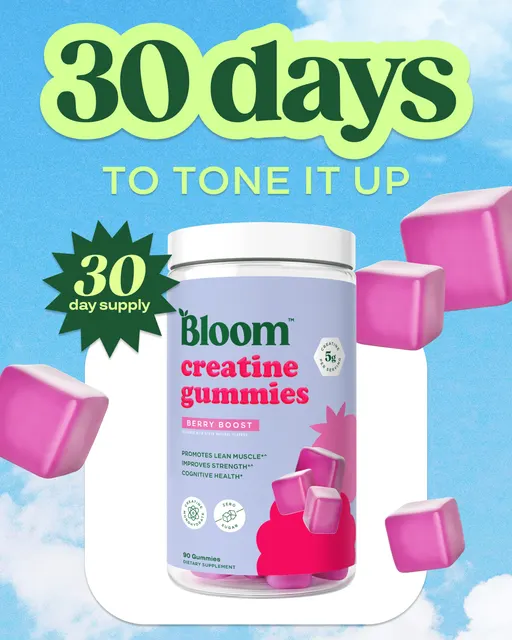
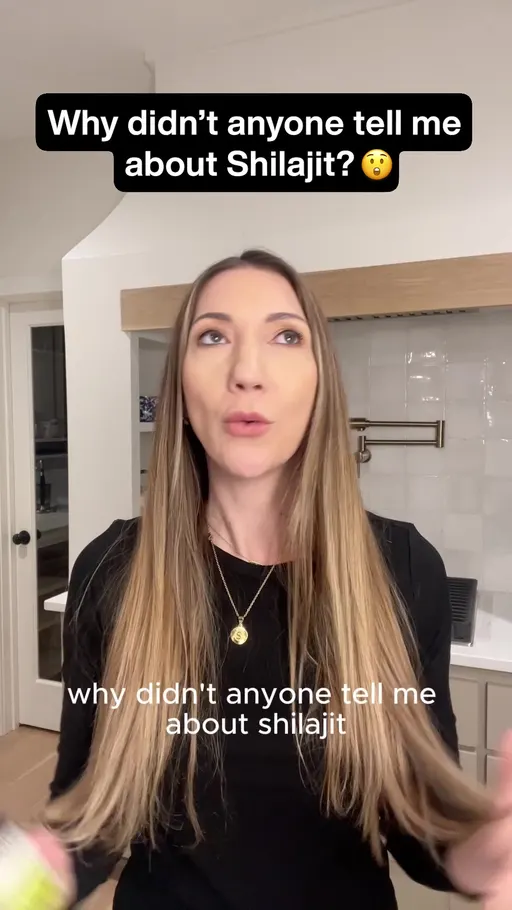
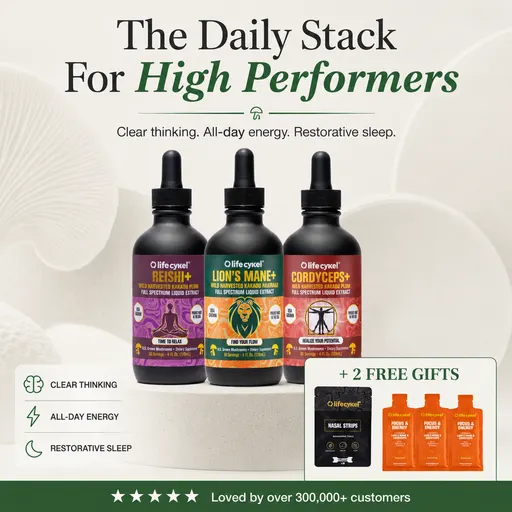
bloomnu.com opens on “30 days to tone it up”. banyanbotanicals.com opens on “Why didn't anyone tell me about Shilajit?” lifecykel.com opens on “The Daily Stack For High Performers”. And cymbiotika.com opens on “Lately, I've been realizing feeling better has a lot more to do with the small habits”. These are named examples from a Meta sample ranked by time on air, which tells you how long a brand kept an ad live and nothing about what it sold.
None of the four waits for the reader to agree they have a problem. The product, the stack or the habit is on screen in the first clause.
The category names the fix. Does it bother to explain it?
Mechanism Is the Second Angle at 16.7%, Up From 12.2%
Mechanism framing, the ad that explains how the thing works, carried 16.7% of October's ads, 923 of them from 83 brands. In September it was 12.2%; at 16.7% it now sits a hair above problem-aware's 16% [eCommerceBenchmark Ad Library, 2026].
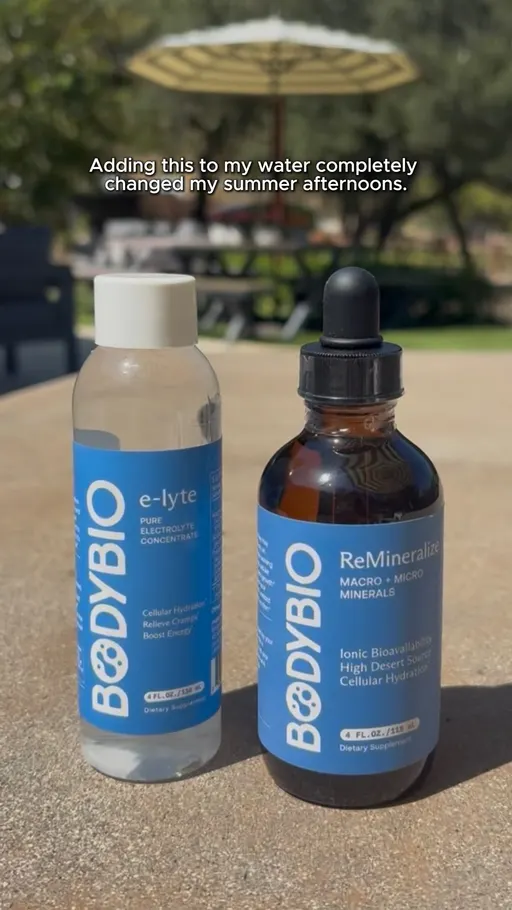
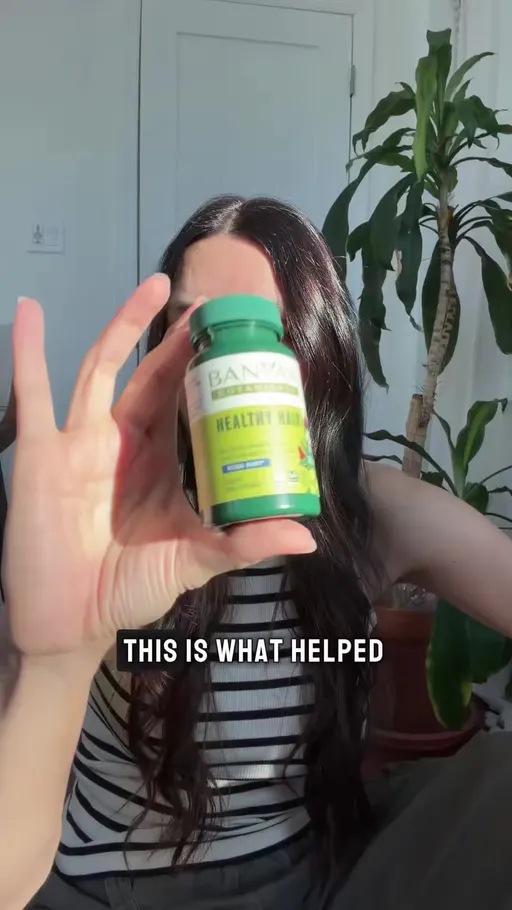
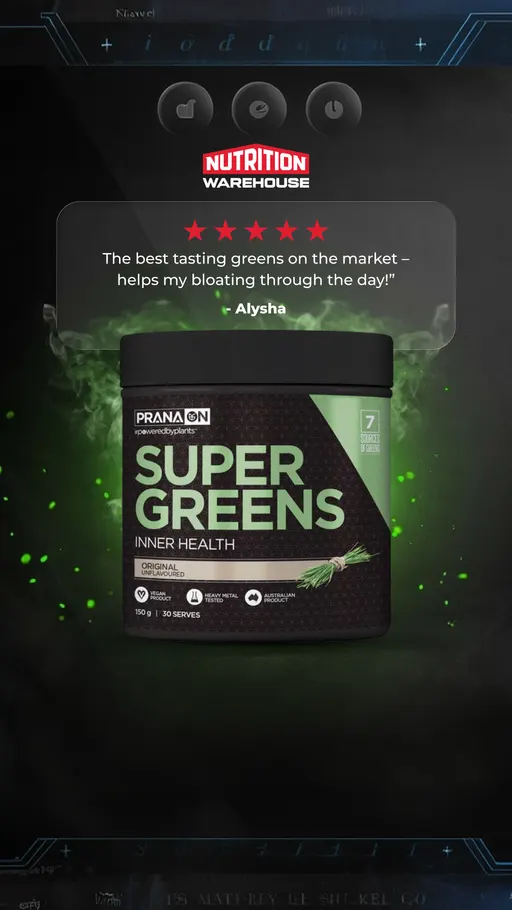
Solution-aware carried 22.4% of October's ads. Mechanism carried 16.7%. Add those two rows of the angle ranking and 39.1% of the vertical's ads either name the fix or explain it.
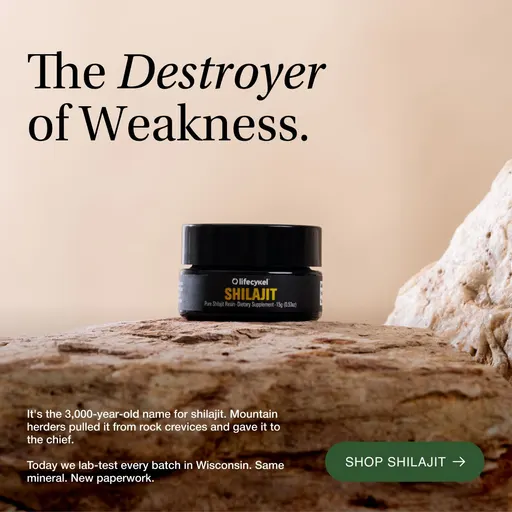
bodybio.com opens on “Adding this to my water completely changed my summer afternoons.”, and its headline is the part that names the electrolytes and minerals the stack replaces. banyanbotanicals.com opens on “This is what helped my hair look shinier and fuller again”. nutritionwarehouse.com.au opens on “Daily Support for Better Health”. lifecykel.com opens on “The Destroyer of Weakness.”
Two of those four carry the how in the headline rather than the first line. The hook earns the second look; the headline does the explaining.
Openings are the one thing every brief argues about. Here is what they look like at scale.
Bold Claim Opens 15.5% of October's Ads, on 77 Brands
Bold claim is the most common opening hook in the vertical, at 15.5% of ads, 856 of them from 77 brands. September was 12.2%. Direct question follows at 12.5% and relatability at 11.1%, while curiosity gap slipped from 10.8% to 9% and authority from 8.6% to 7.3% [eCommerceBenchmark Ad Library, 2026].

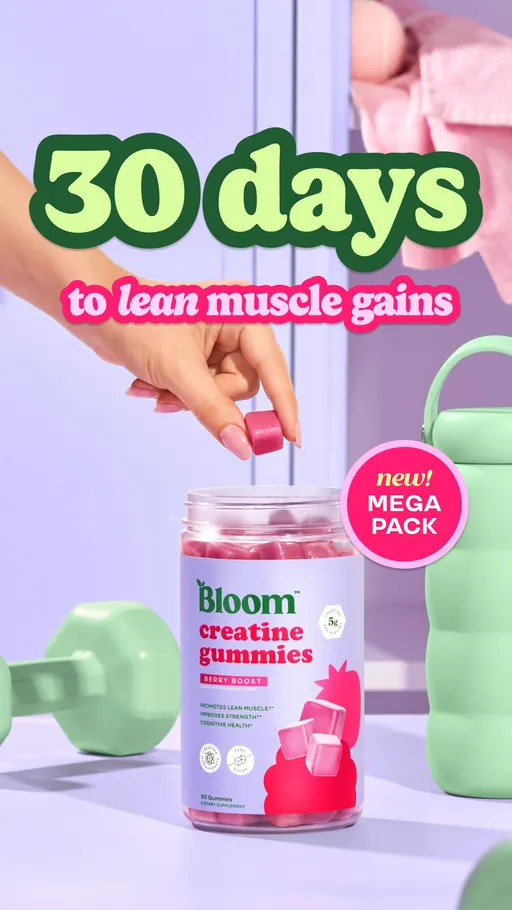
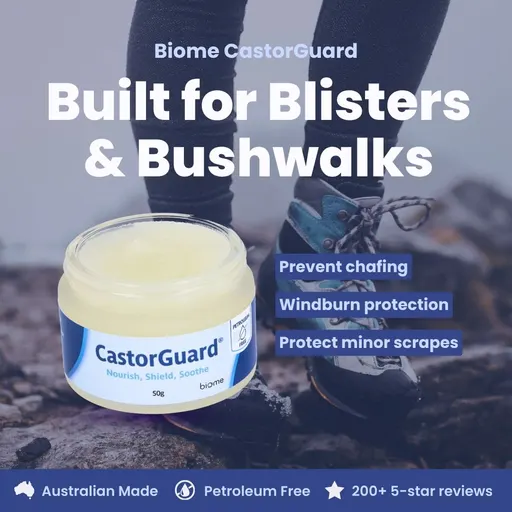
wearefeel.com opens on “No needles, no nonsense”. welzo.com opens on “Lost 20 pounds in 3 months and this is what I do if I had to start again”. bloomnu.com opens on “30 days to lean muscle gains”. biome.com.au opens on “Built for Blisters & Bushwalks”.
Share of October 2026 Health & Wellness ads by opening hook, the five largest rows. Source: eCommerceBenchmark Ad Library, 2026.
That is the words. Now the staging.
Montage Climbs From 6.7% to 9.8% of the Category's Ads
A creative concept is defined as the way an ad is staged on screen, such as a close-up demo or a montage of short cuts. Montage moved most of the three largest concepts, from 6.7% of ads in September to 9.8% in October, 539 ads from 61 brands. Product demo close-up is the most crowded concept at 10.9%, up from 9.2%, and offer-first banner rose from 6.1% to 7.6% [eCommerceBenchmark Ad Library, 2026]. These concept rows rest on fewer ads than the hook and angle rows, so read them against each other.
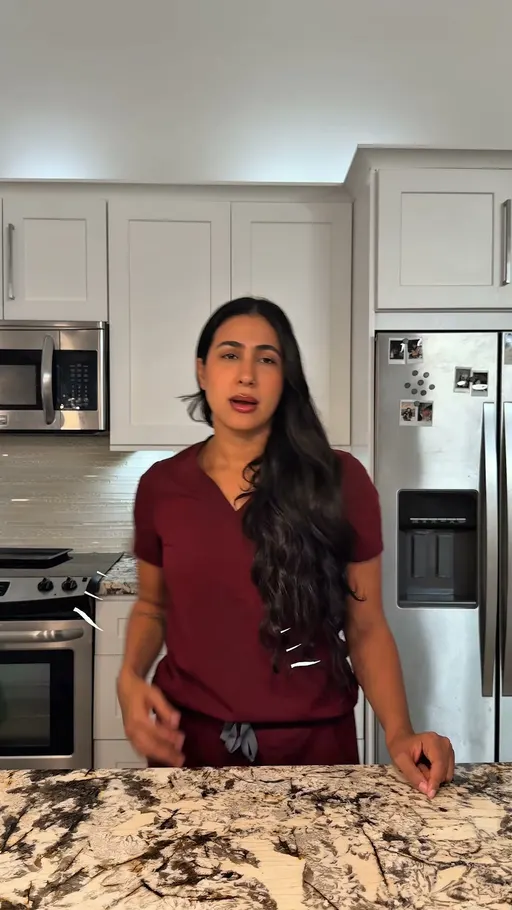
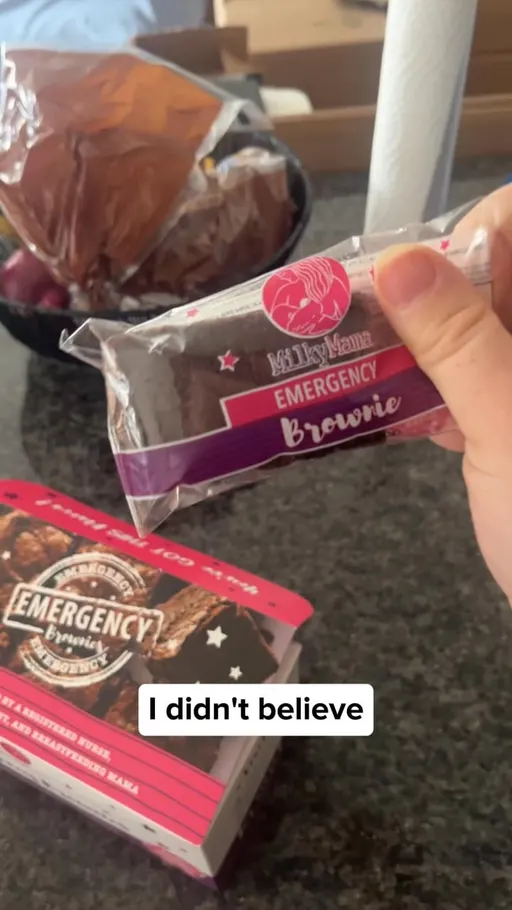
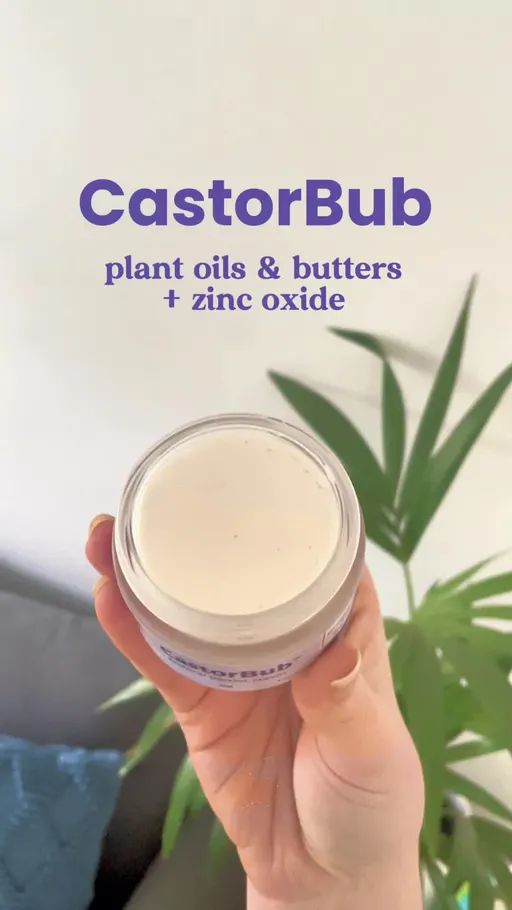
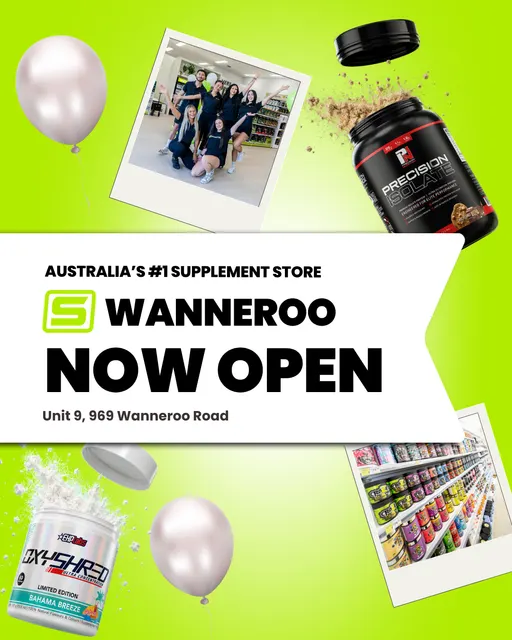
orgain.com opens on “If you're always running on empty because life doesn't stop, this is for you.” milky-mama.com opens on “I didn't believe brownies could actually boost my milk supply until I found 7 reasons why everyone's obsessed with these”. biome.com.au opens on “Your baby's skin is 3x thinner than ours! Why cover them with petroleum?” supplementmart.com.au opens on “Wanneroo store now open”.
Share of October 2026 Health & Wellness ads by creative concept, the three largest rows. Source: eCommerceBenchmark Ad Library, 2026.
Four very different jobs in one staging lane: a benefit, a list, a worry and a shop opening. Almost none of them mentions a deal, which turns out to be the rule here rather than the exception.
54.3% of the Vertical's Ads Name No Offer
More than half of October's Health & Wellness ads carry no offer in their words at all: 54.3%, 2,998 of 5,520 ads, from 104 brands. September sat at 54.5%, so that lane is close to flat. Of the offers these ads do name, discount is the only one above 5%, and it rose from 15% to 18.4%, on 1,015 ads. Free gift sits at 4.4%, bundle at 3.3%, and free shipping fell from 3.1% to 2.4% [eCommerceBenchmark Ad Library, 2026].
54.3% of the vertical's ads name no offer. Another 18.4% name a discount. Add those two rows of the offer ranking and 72.7% of October's ads sit in one or the other.
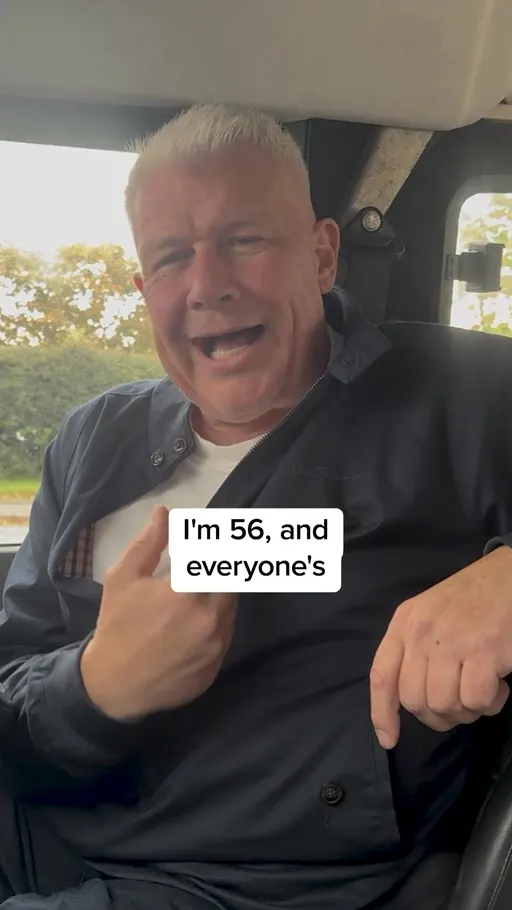
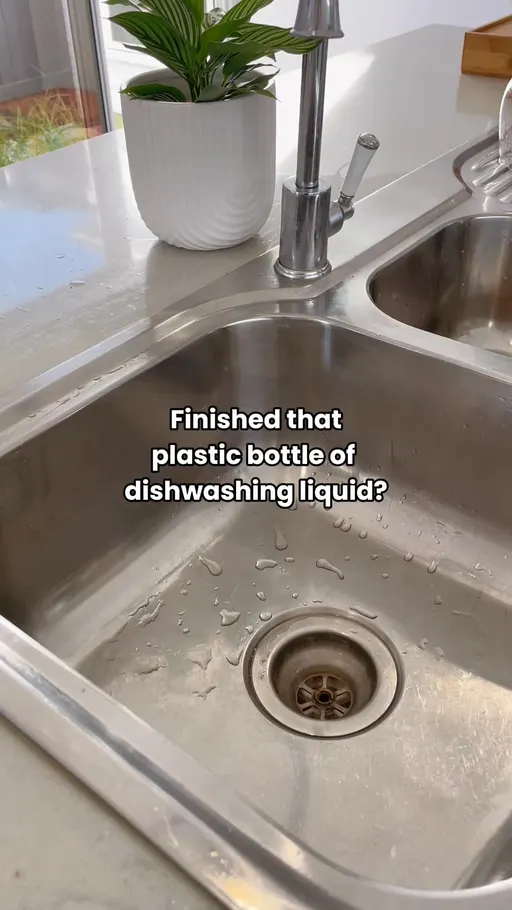
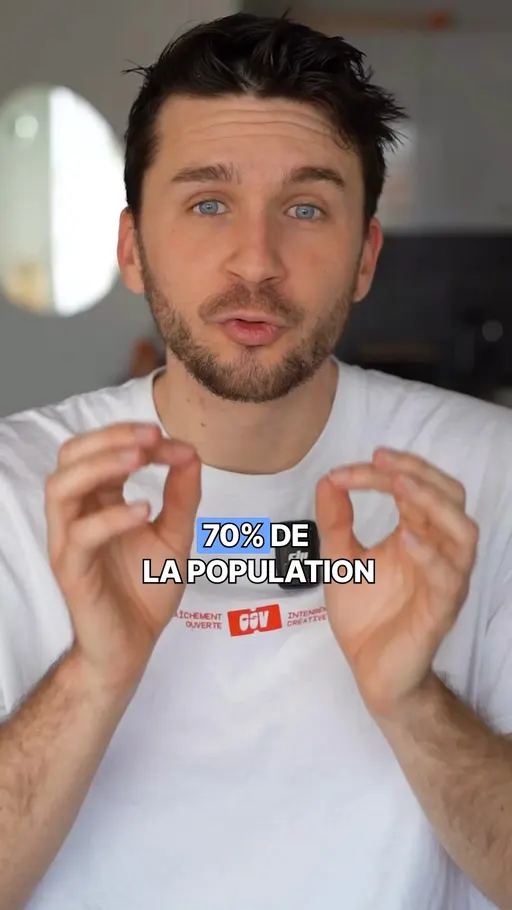
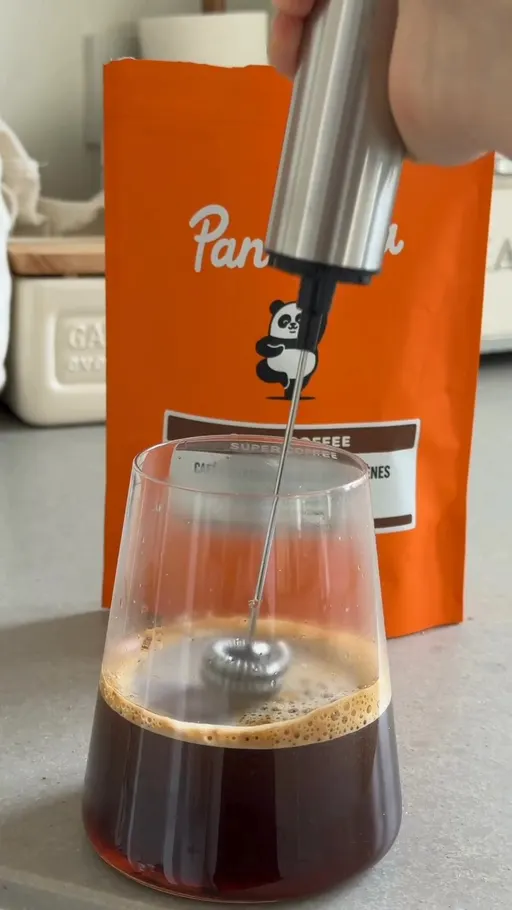
ankhway.com opens on “I'm 56, and everyone's got jokes about guys like me.” biome.com.au opens on “Finished that plastic bottle of dishwashing liquid? Try the plastic-free Dishwash Block!” novoma.com opens on “70% de la population est carencée en magnésium” (translation: 70% of the population is short on magnesium). pandatea.fr opens on “pourquoi je bois des champignons ?” (translation: why do I drink mushrooms?).
Not one of those four lines has a price, a code or a discount in it. They argue, and then they stop.
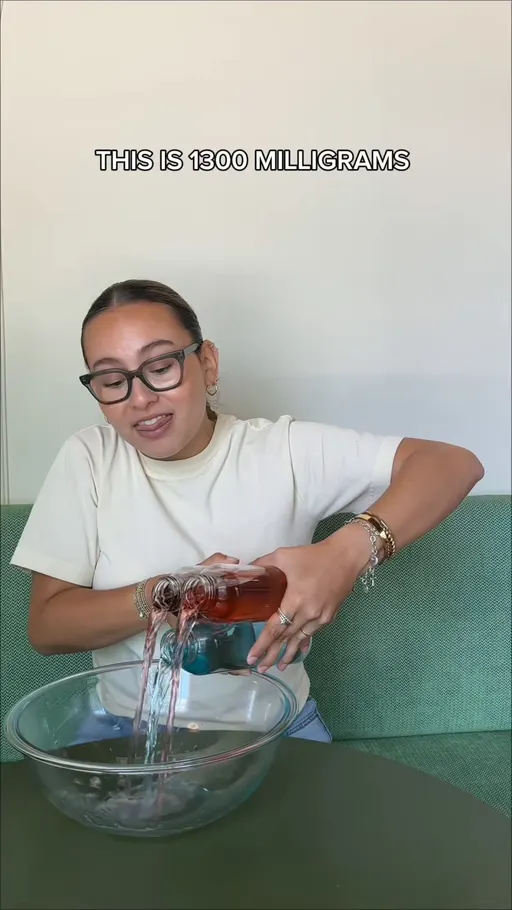
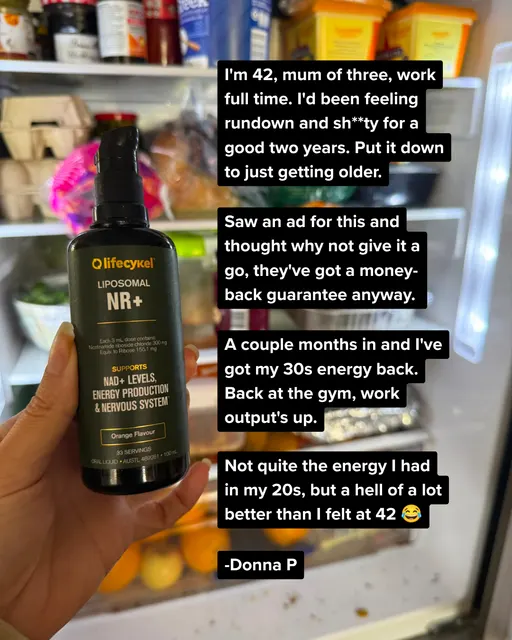
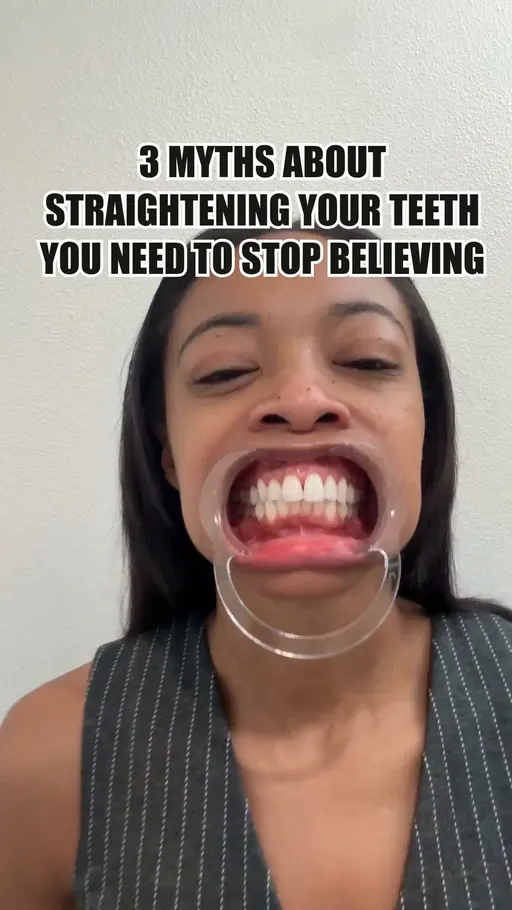
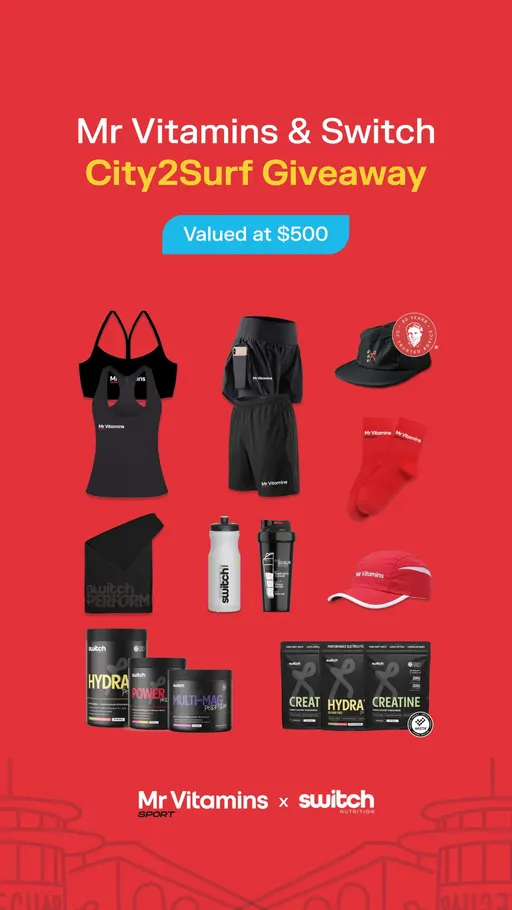
The free gift lane is a small one, and four of its ads read like this. bloomnu.com opens on “THIS IS 1300 MILLIGRAMS OF THE LEADING ELECTROLYTE DRINK”. lifecykel.com opens on “Energy doesn't have to fade with age.” smileset.com opens on “3 MYTHS ABOUT STRAIGHTENING YOUR TEETH YOU NEED TO STOP BELIEVING”. mrvitamins.com.au opens on “Fuel Your City2Surf Finish Line”. None of the four names the gift in its opening line.
Three Health & Wellness Tests to Run Next Month
- A solution-first opening. Run one ad that names the fix in its first three words against your current symptom-led control, since solution-aware framing carried 22.4% of the vertical's ads in October.
- A mechanism line in the headline. Keep your hook and swap the headline for how the product works, the lane that went from 12.2% to 16.7% of ads.
- A brand ad with no offer. Add one ad that argues without a discount beside your offer creative, the way 54.3% of the category's ads do.
The eCommerceBenchmark Ad Library sorts your ads into the same hooks, angles, concepts and offers used in this report and shows your mix next to the market, so you can see which shapes you have never shipped.
Audit my creatives, freeBefore you pick one, look at how the four axes moved side by side. Some of these lanes are much bigger than they feel in a feed.
The Full October Mix, Axis by Axis
Every axis moved between September and October 2026. The risers are led by solution-aware at 22.4% and mechanism at 16.7%; the fallers by problem-aware at 16% and curiosity gap at 9% [eCommerceBenchmark Ad Library, 2026]. Read each axis against itself, never one axis against another.
One honest warning. One row this month is too thin to brief from: the named enemy angle, at 3 ads from 2 brands. Three ads from two brands is not a trend and it is not a brief, so that row is left out of the mix table. Listicle is left out of the table as well, at 4% of ads on 221 of them.
| What moved | Before → after | Change |
|---|---|---|
| Solution-aware angle | 17.5% → 22.4% | ▲ 4.9 pt · +28% |
| Mechanism angle | 12.2% → 16.7% | ▲ 4.5 pt · +37% |
| Discount offer | 15% → 18.4% | ▲ 3.4 pt · +23% |
| Bold claim hook | 12.2% → 15.5% | ▲ 3.3 pt · +27% |
| Montage concept | 6.7% → 9.8% | ▲ 3.1 pt · +46% |
| Product demo close-up concept | 9.2% → 10.9% | ▲ 1.7 pt · +18% |
| Offer-first banner concept | 6.1% → 7.6% | ▲ 1.5 pt · +25% |
| Direct question hook | 11% → 12.5% | ▲ 1.5 pt · +14% |
| Relatability hook | 10.8% → 11.1% | ▲ 0.3 pt · +3% |
| Problem-aware angle | 20.2% → 16% | ▼ 4.2 pt · -21% |
| Curiosity gap hook | 10.8% → 9% | ▼ 1.8 pt · -17% |
| Authority hook | 8.6% → 7.3% | ▼ 1.3 pt · -15% |
| No offer (brand ad) offer | 54.5% → 54.3% | ▼ 0.2 pt · -<1% |
The mistake: briefing the ache when the category has moved to the fix
Here is the habit: every new brief starts from the pain point, so the account fills up with symptom-led variants of the same idea. A shopper scrolling a wellness feed meets four ads in a row that read like a waiting-room questionnaire. None of them has said yet what the product actually does.
The share of ads arguing from the ache fell from 20.2% to 16% across the two months. The solution-first share rose to 22.4%. The field moved its share from the ache to the fix: problem-aware fell from 20.2% to 16% while solution-aware rose to 22.4%. That is not an argument for abandoning problem-aware, which still carried 885 ads from 59 brands [eCommerceBenchmark Ad Library, 2026]. It is an argument for filling the box in your account that is currently empty.
Your test card
Here is the first test from the box, set up the way a media buyer would run it. Fill in the blanks with your own numbers, and write them down before you launch.
| Hypothesis | A solution-first opening that names the fix in the first three words will hold my cost per purchase against my symptom-led control without taking budget from it. |
| Change only this | The first line of the ad, rewritten to name what the product does instead of the problem the viewer has. |
| Keep the same | Same product, same audience, same placement, same concept and staging, same headline, same offer, same landing page. |
| Funnel stage | Say first whether this ad is for prospecting (cold) or retargeting (warm). A deal in the first line is often right for warm audiences and wrong for cold ones, so test it where the ad will really run. |
| Setup | One control and one variant, same audience, same placement, even budget split. Do not edit either ad while the test runs. |
| How long and how much | Until each version has about 50 purchases, or two full weeks, whichever comes later. This is general testing practice (Meta's own learning-phase guideline is about 50 results per ad set per week), not a library finding. |
| Success metric | Cost per purchase, not clicks. |
| Stop rule | Pause a variant that has spent about 3 times your target cost per purchase with no purchase. If it is close, keep it running. |
| What counts as a win | The variant beats the control on the metric by an amount you would act on, and still does in a second week. |
Key takeaways
- Solution-aware framing carried 22.4% of October's Health & Wellness ads, 1,236 of them from 88 brands, after 17.5% in September [eCommerceBenchmark Ad Library, 2026].
- Problem-aware framing fell from 20.2% to 16%, still 885 ads from 59 brands, so the ache lane is smaller but far from empty.
- Mechanism framing rose from 12.2% to 16.7%, on 923 ads from 83 brands: explaining how it works is a crowded lane now, not a difference.
- Bold claim is the most common opening hook at 15.5% of ads, 856 of them across 77 brands, up from 12.2%.
- Montage rose from 6.7% to 9.8% of ads, 539 of them from 61 brands. Product demo close-up is the most crowded concept at 10.9%, up from 9.2%.
- 54.3% of the vertical's ads name no offer, 2,998 ads from 104 brands. Of the offers these ads name, discount is the only one above 5%, at 18.4%.
Questions
Sort last month's ads into the four boxes this piece used: the hook each one opens with, the angle it argues, the concept it is staged as, and the offer it names. Then look for the box that is empty. If nothing in your account argues the fix, that is the lane 22.4% of this category sat in last month. If every ad you signed off carried a percentage off, you are missing the half of the category that argues without one. Brief one of each next month, and write down what you expect from them before you launch.