How to Reduce Ecommerce Returns Without Hurting Sales

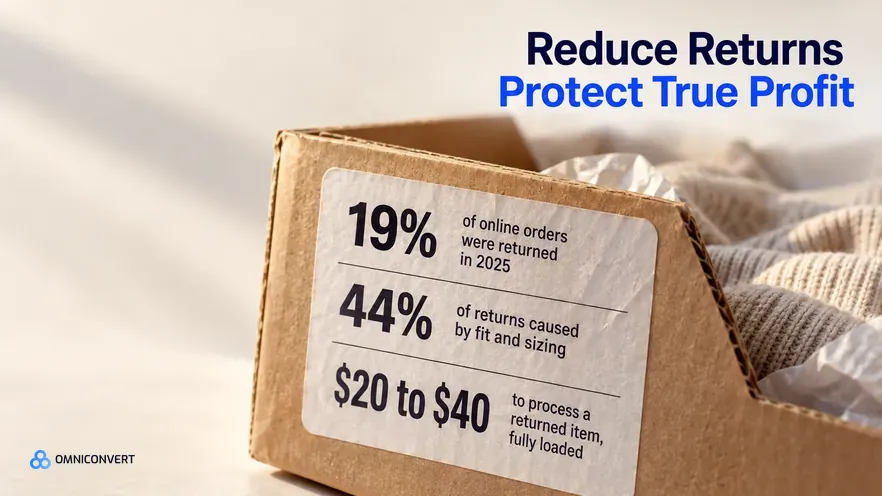
- Around 19 percent of online orders were returned in 2025, but the return rate is the wrong target: it is easy to lower with friction that suppresses conversion and net profit at the same time.
- A return costs roughly 20 to 40 dollars fully loaded, enough to turn a 42 percent gross-margin item into an 18 percent net-margin one, which is why returns belong in your profit model, not a separate ops report.
- Split returns into expectation-gap (avoidable, margin-destroying) and policy-enabled (often tied to high-value buyers); reduce the first aggressively and tolerate the second.
- Fit and sizing cause about 44 percent of returns, so the product page, not the warehouse, is the highest-leverage place to fix them; 3D and AR content can cut returns up to 40 percent.
- Manage returns as a P&L, not a rate: the metric that matters is retained contribution margin per session, and Nexus by Omniconvert models returns as a direct input to True Profit.
An ecommerce return is the reversal of a completed sale, and it is one of the most underpriced costs in the business. Roughly 19.3 percent of online orders were returned in 2025, and US retail returns reached about 849.9 billion dollars, or 15.8 percent of sales [Richpanel, 2026]. Yet most brands still watch the return rate as if it were the problem, when the rate is only a symptom, and often a misleading one.
Nexus by Omniconvert is the AI eCommerce growth engine that models returns as a direct input to True Profit rather than a line in an ops report. This guide covers why the return rate is the wrong target, what returns actually cost, how to tell avoidable returns from valuable ones, where to fix them, and how to measure the work by profit instead of a rate you can game.
Why is the return rate the wrong number to chase?
Return rate is defined as the share of orders or units that customers send back over a period. It is a useful diagnostic, but a dangerous target, because the actions that lower it most quickly, friction and fees, also suppress the purchases that a shopper only makes because returning is easy. You can hit a lower rate and a lower profit in the same quarter and never see the trade-off, because the two numbers live in different reports.
This is loss aversion, the prospect-theory finding that a potential loss weighs heavier than an equal gain. At checkout, an online shopper cannot touch the product, so buying carries an anticipated loss: the risk of being stuck with the wrong thing. A generous return policy removes that anticipated loss, which is precisely why leniency lifts conversion. Re-impose the loss by adding return friction and you suppress the sale before it ever becomes a return. The rate improves; the business does not.
The reframe that fixes this is to stop treating returns as an ops metric and start treating them as a profit input. You do not want the lowest possible return rate. You want the highest possible margin retained after returns, which is a different, and often opposite, thing.
What do ecommerce returns actually cost you?
The gross-margin illusion is the gap between what an item appears to earn and what it keeps after returns. Contribution margin is defined as the revenue from a sale minus all the variable costs attributable to it, including fulfillment, payment fees, and the loaded cost of any return it generates. Gross margin flatters you because it stops at cost of goods; contribution margin is the number that actually funds growth, and returns hit it directly.
The arithmetic is unforgiving because the cost of a return is largely fixed per unit while margin is a percentage of price. A 40-dollar return cost is a rounding error on a 400-dollar item and a catastrophe on a 45-dollar one. Heavily discounted units are the most exposed of all: the discount already thinned the margin, and the return then wipes out what was left. This is why two SKUs with the same return rate can have opposite profit profiles, and why a blended rate tells you almost nothing about where the money is going.
| Item price | Gross margin (42%) | Loaded return cost | Net margin after 1 return per 4 sold |
|---|---|---|---|
| $45 | $18.90 | $40 | Net-negative on the cohort |
| $90 | $37.80 | $40 | About 18% net |
| $250 | $105.00 | $40 | About 32% net |
The table shows why the same 25 percent return rate is survivable on a 250-dollar item and fatal on a 45-dollar one. If you manage returns as a single rate, you never see this. If you manage them as contribution margin per SKU, it is the first thing you see.
What are expectation-gap vs policy-enabled returns?
The most useful frame here comes from Jobs-to-Be-Done: the product page is a promise, and a return is the refund on a broken promise. An expectation-gap return happens because what arrived did not match what was promised, which is a defect in your merchandising, not your logistics. A policy-enabled return happens because your policy made it safe to buy more than the shopper intended to keep, which is often the same generosity that won the sale.
These two types demand opposite responses. Expectation-gap returns should be driven toward zero, because every one is a sale that cost you the item, the shipping both ways, and the customer's confidence. Policy-enabled returns should be modeled and tolerated up to the point where the contribution they enable exceeds their loaded cost, because the shopper who brackets three sizes and keeps one is frequently a high-frequency, high-LTV customer you do not want to train away with fees.
The failure is trying to fix both with one lever. In our audits of ecommerce catalogs, we repeatedly see brands add a blanket restocking fee to fight a rate that is actually driven by a handful of poorly-merchandised SKUs, and watch conversion fall across the whole store to solve a problem that lived on five product pages [Omniconvert, 2026]. Separate the two, and the fix for each becomes obvious.
How does the product page create avoidable returns?
Because most avoidable returns are expectation gaps, they are set at the point of sale. The product detail page is where the promise is made, so it is where the promise is most cheaply kept. Detailed, accurate photography, true-to-life color, explicit dimensions and materials, and honest fit notes all narrow the delta between expected and received. Reviews that surface fit and quality signals do the same work at scale, because they let previous buyers set the next buyer's expectation more accurately than any spec sheet.
This is also where returns reduction and conversion optimization stop being in tension and start reinforcing each other. The same richer product content that sets accurate expectations also increases confidence to buy. You are not trading conversion for fewer returns; you are earning both from the same investment, which is exactly why the product page is the place to start.
Case study. AliveCor used Omniconvert to run a structured A/B testing program on its store and achieved a 21 percent lift in conversion rate, a 5 percent lift in revenue per visitor, and 94 percent statistical relevance across their experiments [Omniconvert, AliveCor case study]. The same discipline that lifts conversion, testing the clarity and accuracy of the product experience, is what closes the expectation gaps that drive avoidable returns, because both come down to the page setting a promise the product can keep.
How does fit and sizing reduce returns?
If one cause drives close to half of returns, it deserves close to half of the effort. Fit and sizing account for about 44 percent of returns, per consumer-returns research [Shorr, 2026]. That concentration is good news: it means a large share of your avoidable returns has a single, addressable root cause, and the tools to address it are well understood.
- Measurement-based size guides: tie sizes to real garment or product dimensions, not vanity labels, and let shoppers match to an item they already own.
- Fit reviews: ask previous buyers to rate whether an item ran small, true, or large, and surface that on the page. It is the most trusted size signal there is.
- 3D and AR content: Shopify reports up to 40 percent fewer returns and up to 94 percent higher conversion with 3D product content [Shopify, 2026].
- Virtual try-on and fit tools: dedicated fit technology reduces size-related returns by roughly 31 to 34 percent [Shopify, 2026].
Every item on that list narrows the expectation gap rather than penalizing the customer for it, which is why each one tends to lift conversion at the same time as it cuts returns. That is the signature of a returns fix worth making: it protects profit on both sides of the sale.
How do you handle bracketing without adding friction?
Bracketing is defined as the practice of deliberately ordering multiple variants of a product with the intention of returning most of them. It matters in ecommerce because it is both a cost and a signal: it inflates returns, but it also identifies engaged shoppers who are trying to get the purchase right, and those shoppers often become your most valuable repeat buyers.
The instinct to charge for it is where brands go wrong. A bracketing fee lowers the return rate and lowers conversion with it, because it re-imposes the checkout loss that drove the behavior in the first place. The better path is twofold: shrink the uncertainty so bracketing is less necessary, with the same fit content that fixes sizing, and then convert the returns you do get into retained revenue with an exchange-first flow that offers a size swap or store credit before a cash refund. You keep the customer, keep the revenue, and still reduce the net cost of the return.
Nexus by Omniconvert loads the real cost of every return against the product and segment that caused it, so you can see which returns are worth keeping and which are quietly net-negative, without adding friction that suppresses conversion.
See how it works →Why do strict return policies cost you sales?
The evidence here is counterintuitive and worth internalizing. A meta-analysis in the Journal of Retailing found that return-policy leniency lifts purchases more than it lifts returns, and that stricter policies are associated with roughly 9 percent lower sales [ScienceDirect, 2015]. The policy you tighten to save 40 dollars a return can cost you multiples of that in sales you never make.
The nuance is that leniency has dimensions, and they do not all behave the same way. Monetary leniency, free return shipping, and effort leniency, an easy process, both lift purchases strongly. Time leniency, a longer return window, and exchange leniency can actually reduce returns, because a longer window lowers the urgency that drives impulsive returns, and an exchange-first option keeps the sale. The implication is precise: be generous on money and effort to protect conversion, and use time and exchange design to reduce returns, rather than reaching for the blunt lever of a shorter window and a restocking fee.
How do you measure retained contribution margin per session?
Every metric encodes a strategy, and the return rate encodes the wrong one. Retained contribution margin per session encodes the right one: it goes up only when you keep more real profit per visitor, whether that comes from fewer avoidable returns, higher conversion, or a better mix of the two. Add friction and conversion falls, so the denominator wins and the metric drops, correctly telling you the move destroyed value.
This is the True Profit lens applied to returns. True Profit is what remains after discounts, returns, cost of goods, and fulfillment come out of revenue, and returns are one of its largest and most ignored inputs. Managing to it means you stop optimizing a rate and start optimizing the profit the rate was only ever a proxy for. Across the CROBenchmark dataset of 7,000+ websites in 15+ industries, measured against 248+ audit criteria over 13 years of conversion optimization, the brands that model returns as a profit input rather than an ops rate are the ones that reduce the returns that matter without paying for it in conversion [CROBenchmark Report 2026, Omniconvert].
The apparel and fashion brands that plateau at a 30 percent return rate consistently share one pattern: they chase the blended rate with policy friction while ignoring the ten SKUs that generate most of the margin-destroying returns. The benchmark gap closes fastest when operators treat retained contribution margin per session as the primary unit of measurement, not the return rate, because the rate is a vanity metric that a restocking fee can improve while profit falls.
What is a prioritized plan to reduce returns?
-
Do now: measure returns by SKU and segment against loaded costLoad the real 20 to 40 dollar cost of each return against the product and customer segment that caused it. Rank by contribution margin retained, not by rate, and the handful of net-negative SKUs will surface immediately.
-
Do now: fix the product pages behind your worst offendersFor the SKUs driving avoidable returns, upgrade photography, dimensions, materials, and reviews so the page sets an accurate expectation. This cuts returns and lifts conversion from the same work.
-
Test: fit and sizing contentAdd measurement-based size guides, fit reviews, and 3D, AR, or virtual try-on where fit drives returns. Test the lift on both conversion and size-related returns before rolling out.
-
Test: an exchange-first return flowOffer a size swap or store credit before a cash refund, so a return keeps the revenue instead of reversing it. Curbs the net cost of bracketing without a fee that deters buyers.
-
Monitor: retained contribution margin per session, and revisit policy lastTrack the profit metric, not the rate. Only after the diagnosis and the page fixes should you touch policy, and then with selective leniency, generous on money and effort, deliberate on time and exchange.
Ecommerce returns FAQs
Around 19 percent of online orders were returned in 2025, but a single target is misleading because return rates are category-specific. Apparel and fashion run 20 to 40 percent, driven by fit and sizing, while electronics sit nearer 8 to 15 percent. Benchmark against your own category and, more importantly, against your net margin per order. A rate that is healthy for one catalog quietly destroys profit in another, so the right comparison is your category and your economics, not a universal number.
Fit and sizing is the single largest cause, accounting for roughly 44 percent of returns. That matters because it points to where the fix lives: the product page, not the warehouse. Most avoidable returns are created before the order ships, when the photos, size guidance, and reviews leave the buyer with the wrong expectation. Wrong size, wrong fit, and item not as described are all expectation gaps set at the point of sale, which is also the cheapest place to close them.
A return typically costs 20 to 30 dollars per item, and often around 40 dollars fully loaded once return shipping, inspection, restocking, and markdown on the resold unit are included. That is frequently enough to invert an item's economics: an item with a 42 percent gross margin can net closer to 18 percent after return costs. Because the cost is fixed per return but margin is a share of price, low-price and heavily discounted items are the ones most likely to go net-negative when they come back.
It can reduce returns, but research shows it reduces sales by more. A meta-analysis in the Journal of Retailing found that lenient return policies lift purchases more than they lift returns, and that strict policies are associated with about 9 percent lower sales. A generous policy removes the anticipated loss a shopper feels at checkout, which is what lifts conversion. Money and effort leniency raise purchases, while time and exchange leniency can actually lower returns, so the smart move is selective leniency, not blanket friction.
Bracketing is when a shopper deliberately orders several sizes or colors intending to keep one and return the rest. Between 58 and 63 percent of shoppers report doing it, and it drives roughly 15 percent of returns. Fees curb it but also deter buyers, so the durable fix is to remove the reason for it: accurate size guidance, fit reviews, and virtual try-on reduce the uncertainty that makes bracketing rational, and an exchange-first flow keeps the revenue when a return does happen. Curb the cause, not the customer.
Nexus by Omniconvert ingests order, returns, and cost-of-goods data and models returns as a direct input to True Profit, so every product, campaign, and segment is ranked by the margin it keeps after returns, not the revenue it books. It surfaces which SKUs and audiences are quietly net-negative once returns are loaded in, and which returns come from your highest-value customers. That tells you where to close expectation gaps and where a lenient policy is worth protecting, so you reduce the returns that destroy profit without suppressing the sales that make it.
Stop chasing a lower return rate and start protecting retained contribution margin per session, the revenue that survives after returns and their fully-loaded cost. A return rate falls the moment you add friction, and so does conversion; margin per session only rises when you close the expectation gap at the product page and keep the policy-enabled returns that come from customers worth keeping. Pick your ten highest-return SKUs this week, load the real cost of each return against them, and you will usually find a handful that are net-negative on every unit sold. That is where reducing returns actually protects profit. Nexus by Omniconvert models returns as a direct input to True Profit, so the SKUs and segments quietly losing money surface on their own. See how Nexus ranks opportunities by True Profit.
See which returns are really costing you profit
Nexus by Omniconvert models returns as a direct input to True Profit, ranking every product, campaign, and segment by the margin it keeps after returns rather than the revenue it books. Find the SKUs that go net-negative once returns are loaded in, and the returns worth tolerating because they come from your best customers.