Creative Fatigue Forecasting: What It Is and How It Works

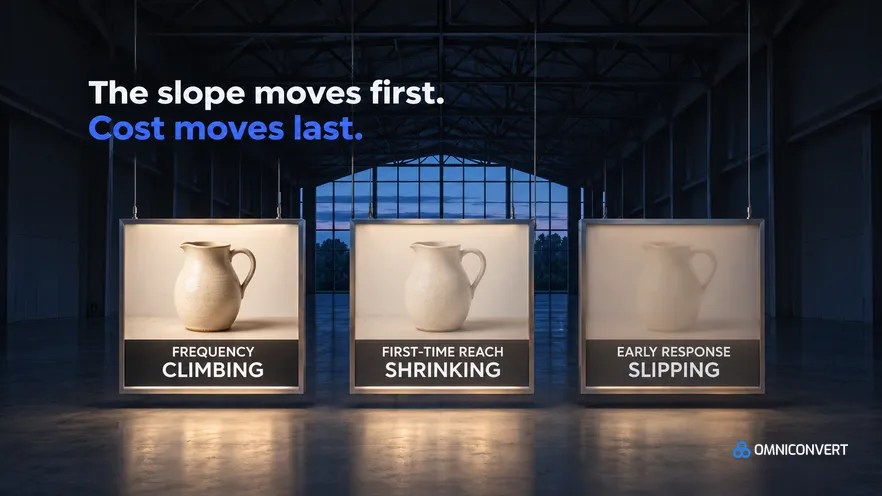
- Creative fatigue forecasting projects the date an ad crosses a cost or response line, from the slope of its leading signals.
- The signals are frequency, first-time reach share and early response. Cost per result, ROAS and profit are outcomes that move late.
- A slope beats a threshold because it gives a date and a warning time, and a threshold only reports that a line was crossed.
- A forecast is only useful when its warning time is longer than your production cycle.
- A forecast says when an ad will tire, not why, so it cannot tell fatigue from audience saturation, an auction change, seasonality or a tracking break.
- A budget or audience change creates a step, not a slope. Forecast only from the weeks after the last change.
Creative fatigue forecasting is the practice of projecting when an ad will wear out from the direction its early signals are moving, instead of waiting for cost per result to say so. A forecast gives you a date to plan against, not a loss to explain.
The complete guide to creative fatigue covers the whole subject. The cause sits in ad creative fatigue, and the working method in how to predict ad fatigue. Omniconvert Commander (formerly Nexus) is the AI eCommerce growth engine for Shopify brands: it reads your store, ad and customer data, ranks growth opportunities by profit impact, and builds the campaigns to act on them, and you approve what goes live.
What is creative fatigue forecasting?
Creative fatigue forecasting is defined as projecting when an ad will cross a cost or response line, from the slope of its leading signals, early enough to brief a replacement before it does. "Slope" means direction and speed over a window, not one reading. "Leading" means the signal moves before cost per result. "Early enough" means the forecast has to beat your production cycle.
Warning time is defined as the number of days between the forecast and the date the ad is projected to cross your line. A forecast pays off only when warning time exceeds the time you need to brief, make and approve a replacement. Detection, by contrast, tells you an ad is already tired.
Which creative fatigue signals does a forecast read?
| Measure | What its slope tells you | What it cannot tell you |
|---|---|---|
| Frequency (signal) | How hard the ad leans on the same people | Whether they are bored or still buying |
| First-time reach share (signal) | Whether anyone new is left to reach | Whether the cause is the audience or a budget change |
| Early response, such as clicks (signal) | Where attention fades first | Whether the later funnel will follow |
| Cost per result (an outcome, late) | Whether the damage has started | Anything early, because it moves late |
| True Profit per ad (an outcome) | Whether the ad is still worth defending | Why it is moving |
Read the signals together, because each one has an innocent reading. Across the brands I talk to, frequency climbing while first-time reach holds tends to mean someone added budget. Frequency climbing while first-time reach falls is the look of audience saturation. A signal points to decay. It does not prove fatigue until the cause is confirmed.
Why does a slope beat a threshold?
Take an illustrative case, not data. Two ads show the same frequency today. One has climbed every week since launch. The other has sat flat for a month. A threshold alert treats them alike. The slope calls the first a brief for next week and the second a winner to leave alone.
A threshold also fires after the fact, and the level that trips it can come from another account. A slope needs no borrowed number, because it compares the ad with its own recent weeks.
What can a creative fatigue forecast not tell you?
Picture a team that raises the budget on a winner. Frequency jumps within days. The dashboard draws a line through the jump and projects the ad dead by month end. The data is real, so the call feels careful. The team pulls the winner or briefs a replacement early, and the ad would have run on fine. The cost is a production cycle, then trust: after one false alarm, people stop reading the forecast. Mark every budget, audience and offer change on the same timeline, and forecast only from the weeks after the last one.
A new ad has no history to compare against. And an ad that never worked is not fatiguing, it failed: check days active as a performance proxy first.

How is creative fatigue forecasting done?
The steps are in how to predict ad fatigue. A refresh calendar treats every ad alike, which a forecast does not: cadence is covered in how often to refresh ad creative.
A forecast is a hypothesis, and a hypothesis is read like a test: the line is written before the result, and the replacement is read against the old ad. Omniconvert Explore holds data from 70,000+ experiments [Omniconvert Explore, 70,000+ experiments], so testing is the discipline we know best.
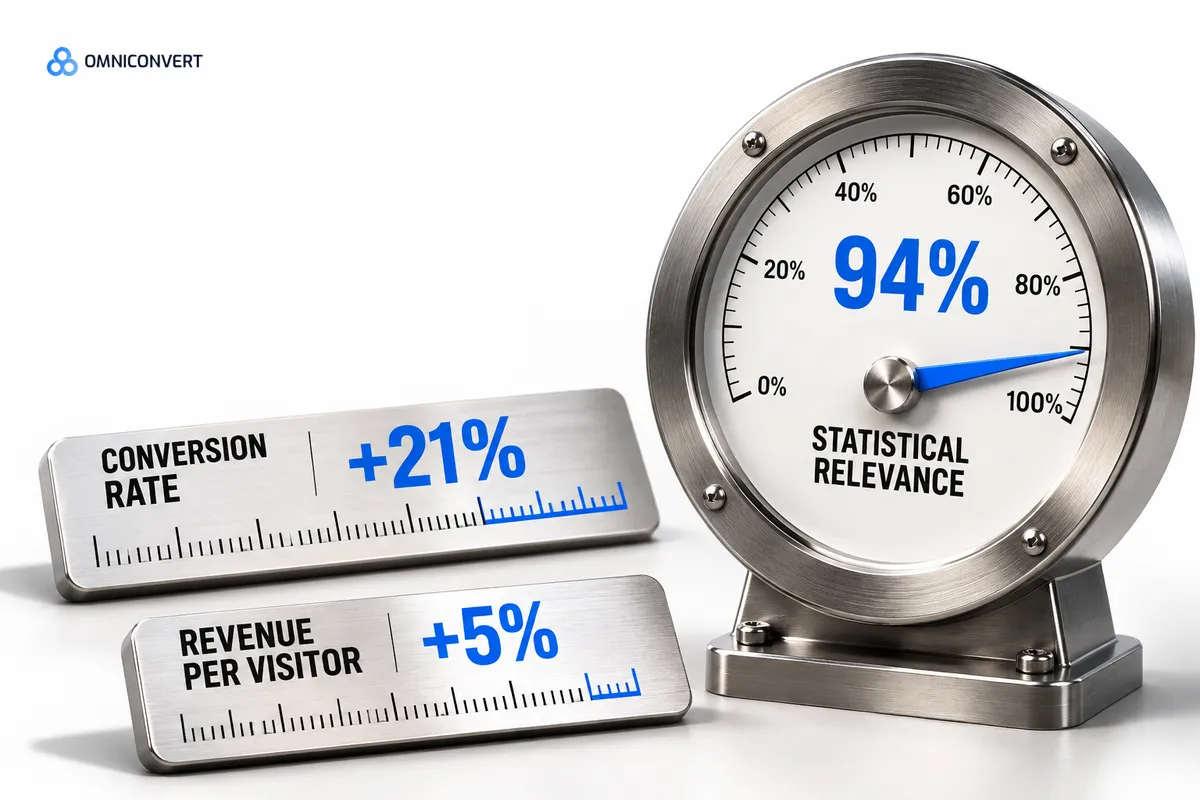
AliveCor used Omniconvert to run a structured A/B testing programme and achieved +21% conversion rate, +5% revenue per visitor, and 94% statistical relevance across their experiments. [Omniconvert, AliveCor case study]
The forecast ends at a date. Then comes a decision: is the ad worth defending, and what replaces it? Omniconvert Commander works on that side, with True Profit per ad. It does not draw a fatigue curve. For tools, see the ranking of creative fatigue tools and the comparison of Omniconvert Commander and Motion.
Creative fatigue forecasting: FAQs
What is creative fatigue forecasting?
Projecting when an ad will cross a cost or response line, from the slope of signals that move before cost does. It gives you a date to plan a replacement against.
What are creative fatigue signals?
Per-ad measures that move before cost per result does: frequency, first-time reach share and early response such as clicks. Cost per result and ROAS are outcomes, and they move late.
How do I start forecasting creative fatigue?
Pick a few leading signals and record them weekly for each ad. The worked method, with a numbered example, is in the guide to predicting ad fatigue.
Is a forecast better than a frequency alert?
It answers a different question. A frequency alert fires after a level is crossed, a level that may come from someone else's account. A forecast reads direction against the ad's own history and gives warning time. Keep alerts as a backstop.
How does Omniconvert Commander fit with creative fatigue forecasting?
Omniconvert Commander does not draw a fatigue curve, so the slope work stays in a spreadsheet or a dedicated tool. Once you have a date, it measures True Profit per ad to show whether the ad is worth defending, and it generates launch-ready assets from customer data for the replacement. You approve what goes live.
Forecast the date, brief early
Creative fatigue forecasting turns a slow loss into a schedule. Read the direction of each ad's signals, project it to a line you set, and keep warning time longer than your production cycle. Mark every budget change so a step never passes for a slope, and remember that a forecast says when, not why.