Creative Fatigue: Detect It, Forecast It, Fix It

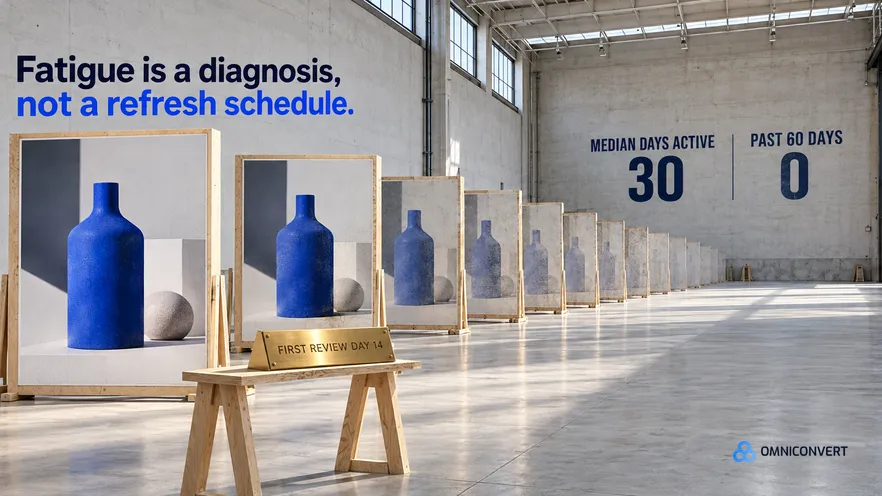
- Creative fatigue is decay under repetition, so it belongs to the pairing of a creative and an audience rather than to the creative.
- A rising cost per result is only fatigue when frequency is climbing and first-time reach is falling at the same time.
- Audience saturation, auction pressure, seasonality and a tracking break produce the same symptom, and three of them are not fixed by new creative.
- Forecast fatigue from slopes rather than levels: frequency, first-time reach and early response all move before cost does.
- Refresh on a trigger with an age floor behind it, never on a calendar alone.
- Fix in order of leverage: angle, then concept, then execution, then crop. Most teams work the list backwards.
- There is no trustworthy cross-account lifespan benchmark, so record your own distribution and compare against that.
Creative fatigue is the most over-diagnosed condition in paid social. An ad gets more expensive, somebody says the creative is tired, and a replacement goes into production. Sometimes that is correct. Just as often the ad was fine and something else moved: the addressable audience ran out, the auction got more expensive for everybody, or the conversion tracking broke on a Thursday and nobody checked. Last updated: October 2026.
I have spent 13 years in eCommerce, and across the CROBenchmark dataset of 7,000+ websites in 15+ industries, assessed against 248+ audit criteria, one pattern repeats. Teams can tell you how their ads performed. Almost none of them can tell you how their ads decayed. Performance gets reported as a level, fatigue is a slope, and nobody in the room owns the slope.
So this page does three things the rest of the cluster only touches. It defines fatigue precisely, separates it from the four conditions it gets confused with, and sets out what to change in the order that works. Nexus by Omniconvert is the AI eCommerce growth engine for Shopify brands: it reads your store, ad and customer data, ranks growth opportunities by profit impact, and builds the campaigns to act on them, and you approve what goes live.
If you own a media budget rather than a creative calendar, the operational version of all this sits with the rest of our work for performance marketers.
What creative fatigue is, and what it is not
Hold the mechanism, because everything downstream follows from it. A person sees an advertisement. The first exposure carries the whole argument. The fifth carries almost none of it, because the argument is already known and the only new information on offer is that you are still asking. Response falls. Cost per result rises. Nothing in the file changed.
That makes fatigue a property of the pairing between a creative and an audience, not of the creative. The same video can be exhausted in one segment and fresh in another, which is why the creative is tired is an incomplete sentence. Tired for whom is the version you can act on, and the one that tells you whether the answer is new creative or a new audience.
One more boundary, and it saves wasted work. Fatigue is decay under repetition, not the verdict on an ad that never worked. An advertisement that failed in its opening week failed on its merits, and calling that fatigue sends you hunting for a refresh when you need a different argument. Read survival first, because an ad has to earn the right to decay: days active as a performance proxy is the method, and it comes before any fatigue measure.
Fatigue or one of its four look-alikes
Audience saturation is defined as the point at which a campaign has already reached most of the people it is allowed to reach, so further spend buys repeat impressions instead of new ones. It is the closest relative of fatigue, because both show frequency climbing. The difference is what is scarce: under saturation it is people, under fatigue it is attention from people you can still reach.
Auction pressure is the cheapest to rule out and the one most often missed. When more advertisers bid against the same inventory, cost per thousand impressions rises for everything in the account at once, including an ad that launched this morning. If a brand new asset carries the same inflated cost, the creative was never the cause.
The other two are quicker. Seasonality is a demand problem wearing a creative costume: intent falls, the same traffic converts worse, and the ad takes the blame because the ad is what somebody can change this week. A tracking break is the worse of the pair, because it manufactures a crisis out of nothing, and teams pause their best creative while a pixel or a consent banner is quietly broken.
| What you see | Reads as fatigue when | The look-alike | The check that separates them |
|---|---|---|---|
| Cost per result rising on one ad | Frequency climbs and first-time reach falls together | Audience saturation | Is first-time reach falling faster than response, and is the audience itself near its limit |
| Cost per thousand impressions rising | Only on the older assets, while new ones are normal | Auction pressure | Launch one new asset and compare: if it costs the same, the auction moved |
| Conversion rate falling on site | Only for traffic from the fatiguing ad | Seasonality or a demand shift | Compare non-paid traffic and the same fortnight last year |
| Conversions dropping sharply | Gradually, never on one day and hour | A tracking break | Do platform-side clicks and add-to-carts still hold steady |
| Click-through rate falling | Early response falls while later steps hold | An offer or landing page problem | Read the funnel step by step: fatigue hits the top, offers hit the bottom |
| One ad decaying, its siblings holding | The siblings share the angle but not the execution | A bad single execution | Rotate the execution and keep the angle: if it recovers, the angle was fine |
The last row pays for itself. If an ad decays while two siblings on the same angle hold steady, you have a weak execution rather than a worn argument, and the cheap fix is the right one. If every ad on the angle decays together, the argument is spent.
Why ad creative fatigue arrives faster than it used to
Start with how audiences get built. Operators used to assemble delivery by hand out of many narrow segments, and a creative moved through them slowly because each one was small. Delivery today is far broader by default, with automated placement and audience expansion doing that work. So a single asset now meets a large, varied audience within days, and frequency accumulates in that window instead of over a month.
Then budget consolidation. The prevailing structure is fewer campaigns and fewer ad sets carrying larger budgets, which concentrates spend on a smaller number of assets. Concentration is good for learning and hard on individual creatives, because the same money that used to be spread across twenty assets now exhausts five.
Third, ranking compounds the decline. Auctions rank on predicted response as well as on bid, so as an ad slips it wins a smaller share of the cheap impressions and keeps the expensive ones. The ad does not decay in a straight line. It decays, loses ranking quality, and gets more expensive because it decayed.
I am describing the general mechanics here, not a named system or a release date. The consequence for the operator is the same either way: once audience construction is automated, creative is the main variable you still control, so each asset carries more of the load and burns through its useful life faster.
Creative fatigue forecasting: reading the slope, not the level
Three indicators carry most of the signal. Frequency, which tells you how hard you are leaning on the same people. First-time reach as a share of impressions, which tells you whether anybody new is left. And early response, the click or the first seconds of a video, where boredom shows up before it reaches the checkout.
The baseline matters more than the indicator. Compare an ad against its own first seven days, never against an account average, because an average blends assets at different stages of their life and hides the thing you are looking for.
The forecast falls out of the slope. If frequency has risen steadily for two weeks while first-time reach has fallen steadily, you can project roughly when the ad crosses the cost line you care about, and brief the replacement before that date rather than after it. Treat the projected date as a scheduling aid, not a prediction.
None of this works without a baseline, which is the unglamorous part. AliveCor used Omniconvert to run a structured A/B testing programme and achieved +21% conversion rate, +5% revenue per visitor, and 94% statistical relevance across their experiments. [Omniconvert, AliveCor case study] Once you know what a normal first week looks like in your own account, a deviation from it is information rather than noise.
How often to refresh ad creative
A calendar is attractive because it is schedulable and it fits a production budget. It is also indifferent to performance, so it retires winners on the same day it retires losers. Any fixed cadence is too slow for one ad and too fast for another in the same week.
A trigger fixes that. Set the three lines once, from your own history: the frequency above which response falls in your account, the first-time reach share below which an asset is only repeating itself, and the drop from week one in early response that you will not fund. Any one of them crossing starts a brief. Behind the trigger, keep a maximum age at which an ad gets reviewed regardless, because a low-spend ad can coast under all three lines for months and still be stale.
The planning side of this, including how to keep a pipeline full enough that a trigger does not fire into an empty cupboard, is the subject of the spoke: how often to refresh ad creative. Volume is the other half of it, and the production economics live in scaling ad creative production.
Reading fatigue in someone else's library
This is the one place where the information asymmetry works in your favour. Public ad libraries publish first-seen dates and show what is still running, so the turnover of somebody else's library is readable without any access to their numbers. What you are reading is their refresh behaviour, a decent proxy for how fast creative wears out in your shared category.
Read the angle, not the asset. A competitor who has run the same argument for three months with six different executions has found something that works and is managing its fatigue deliberately. A competitor cycling through six different arguments in three months is searching, and their category experience is worth less to you than the first one's.
The method, including what to record so the library is comparable month to month, is in the spoke on how to analyze competitor Facebook ads. Nexus does this part continuously: it monitors competitor ad libraries and classifies creative by angle, hook and offer, so the repetition pattern arrives as a report instead of an afternoon of scrolling.
The ad creative fatigue solution, in the order that works
An angle is the reason somebody should buy. A concept is the device that carries it. An execution is the specific file. A crop is a format change. Those four sit in descending order of how much new information the viewer gets, and fatigue is a shortage of new information, so the fix starts at the top. The definitions are in hook versus concept versus angle.
Here is the failure mode I see most, and it looks completely reasonable from the inside. Cost per acquisition rises on day twelve. The team pauses the ad, re-edits the same concept with a different opening shot and a new thumbnail, and relaunches it as a fresh asset, often believing that a new ad identifier resets delivery. The numbers look better for three or four days, which confirms the decision, and then they decay again, faster than the first time. The audience is unchanged and the argument is unchanged, so the second ad inherits the first one's exhaustion. The cost is not the wasted edit. It is that each cycle gets shorter while the team records the problem as solved, so the account ends up running a treadmill of near-identical assets and concludes that creative fatigue is simply the cost of doing business.
Do it the other way around. Brief a genuinely different angle against a different customer motivation, hold the offer and the product constant so the comparison is readable, and run it alongside the fatiguing ad rather than in place of it. Running alongside is what tells you whether the angle was the problem, and it costs you nothing you were not already spending.
Where do new angles come from? From customers, not from a brainstorm. Reviews, support tickets and survey answers describe motivations in the customer's own words, and segmentation tells you which motivation belongs to which group. This is where generation belongs in the sequence: Nexus generates launch-ready static and video creative from customer data and ranks angles by customer lifetime value, and you approve what goes live.
Finally, change the audience as well as the argument when saturation is in play. If first-time reach has collapsed, a brilliant new angle still lands in front of the same tired people. Fatigue and saturation travel together more often than either travels alone.
Tools, and what to look for in them
Four requirements, and most tools fail at least one. The first is a time series per asset rather than per campaign, because a campaign average cancels fatigue out. The second is a creative identity that survives a relaunch, so the same file reappearing under a new identifier keeps its history instead of arriving with a clean record.
The third is grouping above the asset. You need to see all executions of one angle together, because that is the only view that distinguishes a worn-out argument from a weak file, which is the distinction the last row of the table above turns on.
The fourth is the outcome measure. ROAS moves with discounting, returns and product mix, so an ad can look like it is fatiguing when the margin behind it changed. Measuring profit per ad removes that confusion. Nexus works that layer directly: live Meta and Google integrations reconciled against the platforms daily, True Profit measured per ad, and a scale, hold, reduce or kill recommendation on every ad that you approve before anything moves.
Two boundaries, since they matter when you compare tools: Nexus does not tag creative at element level, and it does not run multivariate test frameworks. For how the generation side of the stack fits together, the umbrella pillar is AI ad creative generation for eCommerce.
Benchmarks worth holding, and the one you will not find
The number people want is an average creative lifespan, and I will not give you one, because it does not survive contact with a second account. Lifespan moves with category, budget, audience size, offer strength and rotation habits, and those vary more between two stores than lifespan varies within one.
What is worth holding is a shape, and there is one measured data point I can point you at. In an anonymized single-store creative audit the median ad had been live 30 days, and no ad in the library had passed 60 days: the distribution is in creative longevity and days active. Treat 30 days as a working median from one store rather than a benchmark, and read the empty band past 60 days as a finding about that account.
Record four things per ad and the benchmark question answers itself in two quarters: days active, peak frequency, first-time reach share at launch and at retirement, and profit per ad over its life. That table beats any industry figure, because it describes the audience you actually buy.
Your first 30 days
Four moves, in this order.
- Days 1 to 7: build the baseline. For every live ad, record days active, frequency, first-time reach share and early response rate, weekly, as far back as your platform allows. One row per ad per week. This is the file everything else reads from, and it is the part teams skip.
- Day 14: the first review. Take your three most expensive ads and run the four checks in the table above before you accept fatigue as the diagnosis. Expect at least one of the three to be saturation, auction pressure, seasonality or a broken conversion signal.
- Days 15 to 21: brief angles, not edits. Group live creative by angle and find the angles with no fresh execution behind them. Pull two new angles from reviews, tickets or survey answers rather than re-cutting what you have.
- Days 22 to 30: set the trigger and the floor. Write down the three lines, from your own baseline, plus the maximum age at which an ad gets reviewed regardless. Put them where the whole team can see them, and let them start the next brief instead of the calendar.
FAQ: creative fatigue, forecasting and refresh cadence
What is creative fatigue?
Creative fatigue is the decline in an advertisement's response rate caused by repeated exposure to the same audience, while the advertisement itself is unchanged. It is a property of the pairing between a creative and an audience rather than a property of the creative, so the same asset can be exhausted in one segment and fresh in another. The practical consequence is that a rising cost per result only counts as fatigue once frequency is rising and first-time reach is falling alongside it.
How is creative fatigue different from audience saturation?
Audience saturation is about who is left to reach. Creative fatigue is about what the people you reach have already seen. Saturation shows up as first-time reach falling while frequency climbs, and new creative does not fix it, because the limit is the audience. Fatigue shows up as response falling inside an audience that still has room in it. The two often run together, which is why the honest fix is usually a new argument and a wider or different audience rather than one or the other.
How do I tell fatigue from a rising auction or a tracking break?
Check whether the problem is specific to the ad. Auction pressure raises cost per thousand impressions across every ad in the account at once, including ones launched yesterday, so compare a brand new asset against an old one. A tracking break shows platform-side clicks and add-to-carts holding steady while recorded conversions drop on a particular day and hour. Fatigue is gradual, ad-specific and accompanied by rising frequency. If a brand new ad shows the same cost, the creative was never the cause.
How often should I refresh ad creative?
Refresh on a trigger, with a floor behind it. The trigger is your own leading indicators crossing a line you set: frequency above the level where your history shows response falling, first-time reach below a share you decide, or early response off its first week by a margin you decide. The floor is a maximum age at which you refresh regardless, so nothing coasts. A fixed weekly or monthly schedule replaces thinking with a calendar, and it usually retires winners early while protecting losers too long.
What is the fastest ad creative fatigue solution when cost is already rising?
Change the argument before you change the file. Brief a new angle against a different customer motivation, keep the offer and the product the same so the result is readable, and launch it alongside the fatiguing ad rather than in place of it. A new crop, a new thumbnail or a new first three seconds of the same argument buys days rather than weeks, because the audience is not tired of the execution. It is tired of the claim.
Is there a benchmark for how long an ad should last?
Not one you should trust across accounts. Lifespan moves with category, budget, audience size and how aggressively a team rotates, so a single average hides more than it reveals. In one anonymized store audit the median ad had been live 30 days and nothing in the library had passed 60 days, which is a useful shape rather than a target. Record your own distribution for two quarters and compare against that instead.
How does Nexus by Omniconvert help with creative fatigue?
It works both ends of the problem. On the measurement side it unifies store, ad and customer data, measures results in True Profit per ad rather than ROAS, and returns a scale, hold, reduce or kill recommendation on each ad that you approve before anything changes. On the supply side it generates launch-ready static and video creative from customer data, ranks angles by customer lifetime value, and monitors competitor ad libraries continuously, classifying their creative by angle, hook and offer. It recommends rather than trading hands-off, and you approve what goes live.
Diagnose before you refresh
Creative fatigue is real, it is mechanical, and it is also the default explanation for any rising cost in an ad account, which is what makes it expensive. Three of the four conditions that look exactly like it are not improved by new creative at all, so the first move is a diagnosis rather than a brief: is frequency climbing, is first-time reach falling, does a brand new asset carry the same cost, and did the conversion signal break on a Tuesday. Once you know it is fatigue, read the slope rather than the level, because the slope tells you when to have the replacement ready instead of telling you that you needed it last week. Then fix the argument before the file. The audience is not tired of your crop or your thumbnail. It is tired of the reason you gave it.